Organisational Skills Contracts with Hybrid/Remote/WFH Options

Organisational Skills
UK > Work from Home

The table below looks at the prevalence of the term Organisational Skills in remote or hybrid contract work. Included is a benchmarking guide to the contractor rates offered in vacancies that cited Organisational Skills over the 6 months leading up to 17 July 2025, comparing them to the same period in the previous two years.

6 months to
17 Jul 2025
Same period 2024 Same period 2023
Rank 157 133 206
Rank change year-on-year -24 +73 +44
Contract jobs citing Organisational Skills 164 235 281
As % of all contract jobs with a WFH option 1.61% 1.66% 1.18%
As % of the General category 2.57% 2.81% 2.02%
Number of daily rates quoted 110 130 223
10th Percentile £269 £182 £264
25th Percentile £352 £313 £350
Median daily rate (50th Percentile) £475 £432 £460
Median % change year-on-year +10.08% -6.20% -5.15%
75th Percentile £600 £525 £569
90th Percentile £714 £600 £650
UK median daily rate £449 £405 £475
% change year-on-year +10.86% -14.74% -
Number of hourly rates quoted 12 61 6
10th Percentile £19.90 £14.13 £18.25
25th Percentile £21.94 - £21.56
Median hourly rate £24.34 £38.12 £31.86
Median % change year-on-year -36.15% +19.65% +59.30%
75th Percentile £27.73 - £47.69
90th Percentile £31.41 - £54.38
UK median hourly rate £19.90 £22.53 £21.05
% change year-on-year -11.67% +7.03% -19.04%

All General Skills
Work from Home

Organisational Skills falls under the General Skills category. For comparison with the information above, the following table provides summary statistics for all contract job vacancies with remote or hybrid options requiring common skills.

Contract vacancies with a requirement for common skills 6,380 8,357 13,911
As % of all contract jobs with a WFH option 62.58% 58.92% 58.54%
Number of daily rates quoted 4,231 5,460 9,752
10th Percentile £325 £325 £350
25th Percentile £413 £425 £450
Median daily rate (50th Percentile) £513 £532 £550
Median % change year-on-year -3.57% -3.36% +1.85%
75th Percentile £650 £650 £675
90th Percentile £800 £788 £775
UK median daily rate £500 £525 £550
% change year-on-year -4.76% -4.55% -
Number of hourly rates quoted 204 404 317
10th Percentile £14.00 £15.50 £18.63
25th Percentile £16.59 £24.00 £25.71
Median hourly rate £32.03 £39.02 £49.00
Median % change year-on-year -17.93% -20.37% +40.00%
75th Percentile £64.64 £57.50 £66.21
90th Percentile £75.00 £72.50 £79.08
UK median hourly rate £26.21 £33.29 £30.65
% change year-on-year -21.26% +8.61% +22.59%

Organisational Skills
Trend for Jobs with a WFH Option

Job vacancies with remote working options citing Organisational Skills as a proportion of all IT jobs advertised.
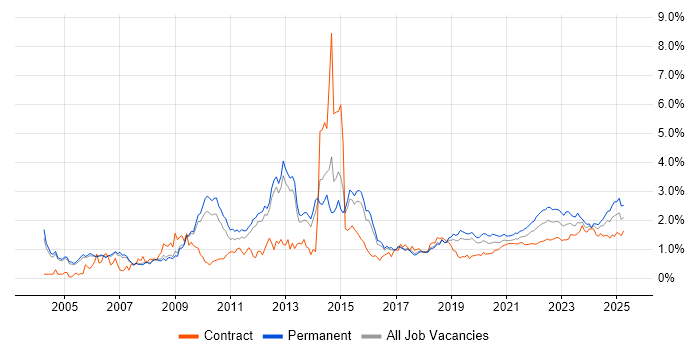
Organisational Skills trend for jobs with Hybrid/Remote/WFH options

Organisational Skills
Daily Rate Trend for Jobs with a WFH Option

3-month moving average daily rate quoted in job vacancies with remote working options citing Organisational Skills.

Organisational Skills daily rate for jobs with a WFH option

Organisational Skills
Daily Rate Histogram for Jobs with a WFH Option

Daily rate distribution for jobs with remote working options citing Organisational Skills over the 6 months to 17 July 2025.

Organisational Skills daily rate histogram for jobs with a WFH option

Organisational Skills
Hourly Rate Trend for Jobs with a WFH Option

3-month moving average hourly rate quoted in job vacancies with remote working options citing Organisational Skills.

Organisational Skills hourly rate for jobs with a WFH option

Organisational Skills
Hourly Rate Histogram for Jobs with a WFH Option

Hourly rate distribution for jobs with remote working options citing Organisational Skills over the 6 months to 17 July 2025.

Organisational Skills hourly rate histogram for jobs with a WFH option

Organisational Skills
Co-occurring Skills and Capabilities with WFH Options by Category

The follow tables expand on the table above by listing co-occurrences grouped by category. The same employment type, locality and period is covered with up to 20 co-occurrences shown in each of the following categories:

Application Platforms
1 5 (3.05%) SharePoint
2 3 (1.83%) ArcGIS
3 2 (1.22%) Confluence
4 1 (0.61%) CMS
4 1 (0.61%) Drupal
4 1 (0.61%) Microsoft Exchange
4 1 (0.61%) WebLogic
Applications
1 19 (11.59%) Microsoft Excel
2 16 (9.76%) Microsoft PowerPoint
3 11 (6.71%) Microsoft Office
4 6 (3.66%) Microsoft Project
5 3 (1.83%) MS Visio
5 3 (1.83%) Spreadsheet
Business Applications
1 4 (2.44%) Remedy ITSM
2 3 (1.83%) SAP S/4HANA
3 2 (1.22%) Dynamics CRM
3 2 (1.22%) SAP Oil and Gas
4 1 (0.61%) HFM
4 1 (0.61%) Oracle ERP
4 1 (0.61%) SAP ERP
4 1 (0.61%) Shopify
Cloud Services
1 18 (10.98%) Azure
2 5 (3.05%) Entra ID
2 5 (3.05%) Microsoft 365
2 5 (3.05%) SaaS
3 4 (2.44%) AWS
3 4 (2.44%) Power Platform
4 3 (1.83%) Asana
5 2 (1.22%) Microsoft Copilot
5 2 (1.22%) PowerApps
6 1 (0.61%) Azure Data Factory
6 1 (0.61%) Azure DevOps
6 1 (0.61%) Azure Synapse Analytics
6 1 (0.61%) BigCommerce
6 1 (0.61%) GCP
6 1 (0.61%) IaaS
6 1 (0.61%) Lucidchart
6 1 (0.61%) Miro
6 1 (0.61%) OCI
6 1 (0.61%) OneDrive
6 1 (0.61%) PaaS
Communications & Networking
1 5 (3.05%) Firewall
2 3 (1.83%) DHCP
2 3 (1.83%) DNS
2 3 (1.83%) SAN
2 3 (1.83%) VLAN
3 2 (1.22%) Cisco Nexus
4 1 (0.61%) Broadband
4 1 (0.61%) Internet
4 1 (0.61%) Network Security
4 1 (0.61%) Unified Communications
4 1 (0.61%) VPN
Database & Business Intelligence
1 4 (2.44%) Data Warehouse
1 4 (2.44%) Oracle Database
1 4 (2.44%) Power BI
1 4 (2.44%) SQL Server
1 4 (2.44%) Star Schema
2 3 (1.83%) Geospatial Data
2 3 (1.83%) GIS
2 3 (1.83%) Metadata
2 3 (1.83%) Spatial Data
2 3 (1.83%) SQL Server Integration Services
2 3 (1.83%) SQL Server Reporting Services
3 2 (1.22%) Looker
3 2 (1.22%) MS Access
4 1 (0.61%) BusinessObjects
4 1 (0.61%) PostgreSQL
4 1 (0.61%) QGIS
4 1 (0.61%) Relational Database
4 1 (0.61%) SAP Data Services
4 1 (0.61%) Tableau
Development Applications
1 11 (6.71%) Jenkins
2 10 (6.10%) JIRA
3 2 (1.22%) GDB
3 2 (1.22%) Postman
3 2 (1.22%) Sonatype Nexus
4 1 (0.61%) Git
4 1 (0.61%) GoCD
4 1 (0.61%) Selenium
4 1 (0.61%) SpecFlow
4 1 (0.61%) Subversion
General
1 98 (59.76%) Social Skills
2 53 (32.32%) Finance
3 37 (22.56%) Analytical Skills
4 20 (12.20%) Banking
5 16 (9.76%) Public Sector
6 14 (8.54%) Presentation Skills
7 12 (7.32%) Influencing Skills
7 12 (7.32%) Investment Banking
8 6 (3.66%) Telecoms
9 5 (3.05%) Manufacturing
10 4 (2.44%) Legal
10 4 (2.44%) Retail
11 3 (1.83%) Inclusion and Diversity
11 3 (1.83%) Law
11 3 (1.83%) Pharmaceutical
11 3 (1.83%) Welsh Language
12 2 (1.22%) Aerospace
12 2 (1.22%) Automotive
12 2 (1.22%) Back Office
12 2 (1.22%) Documentation Skills
Job Titles
1 40 (24.39%) Analyst
2 19 (11.59%) Project Manager
3 13 (7.93%) Business Analyst
4 10 (6.10%) Administrator
4 10 (6.10%) IT Manager
5 9 (5.49%) Artificial Intelligence Developer
5 9 (5.49%) Developer
5 9 (5.49%) Gen AI Developer
5 9 (5.49%) Lead
5 9 (5.49%) Python Developer
6 7 (4.27%) Data Analyst
6 7 (4.27%) Senior
7 6 (3.66%) Architect
7 6 (3.66%) Change Manager
7 6 (3.66%) Consultant
7 6 (3.66%) Coordinator
8 5 (3.05%) Junior
9 4 (2.44%) Infrastructure Project Manager
9 4 (2.44%) Release Manager
9 4 (2.44%) Technical Support
Libraries, Frameworks & Software Standards
1 9 (5.49%) .NET
1 9 (5.49%) Django
1 9 (5.49%) FastAPI
1 9 (5.49%) React
2 2 (1.22%) GeoJSON
2 2 (1.22%) KML
2 2 (1.22%) LDAP
3 1 (0.61%) CSS
3 1 (0.61%) FpML
3 1 (0.61%) HTML
3 1 (0.61%) Next.js
3 1 (0.61%) Node.js
3 1 (0.61%) PySpark
3 1 (0.61%) SailPoint
3 1 (0.61%) SAML
3 1 (0.61%) VML
3 1 (0.61%) Web Services
3 1 (0.61%) XML
Miscellaneous
1 10 (6.10%) Self-Motivation
2 8 (4.88%) Virtual Team
3 7 (4.27%) Product Ownership
4 6 (3.66%) Data Centre
4 6 (3.66%) Management Information System
4 6 (3.66%) Onboarding
5 5 (3.05%) PMI
6 4 (2.44%) Data Protection Act
7 3 (1.83%) Legacy Systems
7 3 (1.83%) NHS
7 3 (1.83%) Operational Technology
7 3 (1.83%) Renewable Energy
7 3 (1.83%) SWIFT Messaging Network
8 2 (1.22%) Data Structures
8 2 (1.22%) Learning Management System
8 2 (1.22%) Life Science
8 2 (1.22%) Reinsurance
9 1 (0.61%) Clustering
9 1 (0.61%) Freedom of Information
9 1 (0.61%) Social Media
Operating Systems
1 14 (8.54%) Windows
2 8 (4.88%) Linux
3 4 (2.44%) Windows 10
4 3 (1.83%) AIX
4 3 (1.83%) Unix
4 3 (1.83%) Windows Server
5 1 (0.61%) Android
5 1 (0.61%) Apple iOS
Processes & Methodologies
1 40 (24.39%) Project Management
2 38 (23.17%) Agile
3 33 (20.12%) Problem-Solving
4 26 (15.85%) Stakeholder Management
5 25 (15.24%) Continuous Improvement
6 23 (14.02%) Change Management
7 22 (13.41%) Time Management
8 21 (12.80%) Project Delivery
9 19 (11.59%) Collaborative Working
9 19 (11.59%) Data Analysis
10 16 (9.76%) Migration
11 15 (9.15%) User Acceptance Testing
12 14 (8.54%) DevOps
12 14 (8.54%) SDLC
13 13 (7.93%) CI/CD
13 13 (7.93%) Process Improvement
13 13 (7.93%) Stakeholder Engagement
14 12 (7.32%) Artificial Intelligence
14 12 (7.32%) Asset Management
14 12 (7.32%) Data Modelling
Programming Languages
1 20 (12.20%) SQL
2 13 (7.93%) Python
3 10 (6.10%) C#
3 10 (6.10%) Java
3 10 (6.10%) TypeScript
4 6 (3.66%) PowerShell
5 3 (1.83%) VBScript
6 2 (1.22%) Data Analysis Expressions
7 1 (0.61%) PL/SQL
Qualifications
1 22 (13.41%) Degree
2 14 (8.54%) Security Cleared
3 13 (7.93%) SC Cleared
4 7 (4.27%) PMI Certification
5 6 (3.66%) Master's Degree
6 4 (2.44%) PMP
7 3 (1.83%) BPSS Clearance
7 3 (1.83%) Cisco Certification
7 3 (1.83%) Computer Science Degree
8 2 (1.22%) Azure Certification
8 2 (1.22%) CCNP
8 2 (1.22%) IIBA
8 2 (1.22%) ITIL Certification
8 2 (1.22%) Network+ Certification
9 1 (0.61%) AWS Certification
9 1 (0.61%) CCNA
9 1 (0.61%) CISSP
9 1 (0.61%) CompTIA Security+
9 1 (0.61%) DBS Check
9 1 (0.61%) ISEB
Quality Assurance & Compliance
1 16 (9.76%) PMO
2 9 (5.49%) QA
3 5 (3.05%) Data Quality
4 3 (1.83%) SLA
5 2 (1.22%) Accessibility
5 2 (1.22%) GDPR
5 2 (1.22%) GRC
5 2 (1.22%) NIST
6 1 (0.61%) Actionable Recommendations
6 1 (0.61%) EMIR
6 1 (0.61%) ISO/IEC 27001
6 1 (0.61%) MiFID
6 1 (0.61%) NCSC
6 1 (0.61%) NIST 800
6 1 (0.61%) WCAG
System Software
1 9 (5.49%) Docker
2 5 (3.05%) VMware Infrastructure
3 3 (1.83%) Active Directory
4 2 (1.22%) Virtual Desktop
5 1 (0.61%) BitLocker
5 1 (0.61%) Hyper-V
Systems Management
1 12 (7.32%) Ansible
2 9 (5.49%) Kubernetes
3 4 (2.44%) SCCM
4 3 (1.83%) Tivoli
4 3 (1.83%) Tivoli Storage Manager
5 2 (1.22%) Microsoft Intune
6 1 (0.61%) Jamf Pro
6 1 (0.61%) Terraform
6 1 (0.61%) WSUS
Vendors
1 35 (21.34%) Microsoft
2 10 (6.10%) SAP
3 9 (5.49%) Oracle
4 8 (4.88%) VMware
5 5 (3.05%) BMC
5 5 (3.05%) IBM
5 5 (3.05%) ServiceNow
6 4 (2.44%) BT
6 4 (2.44%) Cisco
6 4 (2.44%) Google
6 4 (2.44%) Remedy
6 4 (2.44%) Salesforce
7 3 (1.83%) Workday
8 2 (1.22%) Citrix
8 2 (1.22%) Databricks
8 2 (1.22%) F5
8 2 (1.22%) Juniper
8 2 (1.22%) NetScout
8 2 (1.22%) Palo Alto
9 1 (0.61%) Adobe