Telecoms Contracts with Hybrid/Remote/WFH Options

Telecommunications
UK > Work from Home

The table below looks at the prevalence of the term Telecoms in remote or hybrid contract work. Included is a benchmarking guide to the contractor rates offered in vacancies that cited Telecoms over the 6 months leading up to 7 May 2025, comparing them to the same period in the previous two years.

6 months to
7 May 2025
Same period 2024 Same period 2023
Rank 119 65 77
Rank change year-on-year -54 +12 +13
Contract jobs citing Telecoms 212 463 752
As % of all contract jobs with a WFH option 2.15% 3.04% 2.95%
As % of the General category 3.44% 5.17% 5.04%
Number of daily rates quoted 109 233 499
10th Percentile £325 £256 £300
25th Percentile £400 £388 £400
Median daily rate (50th Percentile) £481 £475 £463
Median % change year-on-year +1.26% +2.70% -7.50%
75th Percentile £600 £600 £600
90th Percentile £700 £738 £700
UK median daily rate £495 £450 £491
% change year-on-year +10.00% -8.40% -1.75%
Number of hourly rates quoted 15 55 30
10th Percentile - £13.55 £19.40
25th Percentile - £29.75 £47.50
Median hourly rate £14.00 £65.00 £65.00
Median % change year-on-year -78.46% - +150.00%
75th Percentile £16.75 £72.50 £68.75
90th Percentile £28.70 £74.00 £90.75
UK median hourly rate £23.59 £55.00 £52.50
% change year-on-year -57.11% +4.76% +40.00%

All General Skills
Work from Home

Telecoms falls under the General Skills category. For comparison with the information above, the following table provides summary statistics for all contract job vacancies with remote or hybrid options requiring common skills.

Contract vacancies with a requirement for common skills 6,166 8,955 14,919
As % of all contract jobs with a WFH option 62.52% 58.82% 58.43%
Number of daily rates quoted 4,161 5,880 10,507
10th Percentile £328 £325 £363
25th Percentile £415 £425 £450
Median daily rate (50th Percentile) £525 £538 £550
Median % change year-on-year -2.33% -2.27% +4.76%
75th Percentile £650 £650 £675
90th Percentile £800 £775 £775
UK median daily rate £525 £525 £550
% change year-on-year - -4.55% +2.33%
Number of hourly rates quoted 177 474 342
10th Percentile £14.00 £14.02 £19.01
25th Percentile £18.22 £22.61 £26.00
Median hourly rate £31.76 £38.12 £50.00
Median % change year-on-year -16.68% -23.76% +53.85%
75th Percentile £64.52 £52.88 £67.50
90th Percentile £85.55 £72.50 £80.25
UK median hourly rate £27.50 £30.00 £32.60
% change year-on-year -8.33% -7.96% +48.16%

Telecoms
Trend for Jobs with a WFH Option

Job vacancies with remote working options citing Telecoms as a proportion of all IT jobs advertised.
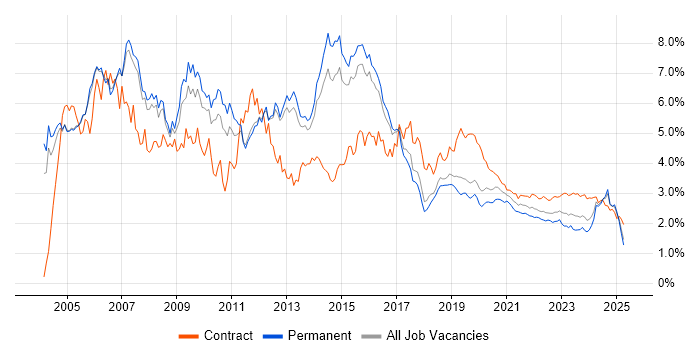
Telecoms trend for jobs with Hybrid/Remote/WFH options

Telecoms
Daily Rate Trend for Jobs with a WFH Option

3-month moving average daily rate quoted in job vacancies with remote working options citing Telecoms.

Telecoms daily rate for jobs with a WFH option

Telecoms
Daily Rate Histogram for Jobs with a WFH Option

Daily rate distribution for jobs with remote working options citing Telecoms over the 6 months to 7 May 2025.

Telecoms daily rate histogram for jobs with a WFH option

Telecoms
Hourly Rate Trend for Jobs with a WFH Option

3-month moving average hourly rate quoted in job vacancies with remote working options citing Telecoms.

Telecoms hourly rate for jobs with a WFH option

Telecoms
Hourly Rate Histogram for Jobs with a WFH Option

Hourly rate distribution for jobs with remote working options citing Telecoms over the 6 months to 7 May 2025.

Telecoms hourly rate histogram for jobs with a WFH option

Telecoms
Co-occurring Skills and Capabilities with WFH Options by Category

The follow tables expand on the table above by listing co-occurrences grouped by category. The same employment type, locality and period is covered with up to 20 co-occurrences shown in each of the following categories:

Application Platforms
1 13 (6.13%) SharePoint
2 8 (3.77%) Microsoft Exchange
3 3 (1.42%) OpenStack
4 2 (0.94%) CMS
4 2 (0.94%) Confluence
5 1 (0.47%) SharePoint 2013
5 1 (0.47%) Tomcat
5 1 (0.47%) WebLogic
Applications
1 6 (2.83%) Microsoft Excel
2 4 (1.89%) Microsoft Office
3 2 (0.94%) MS Visio
4 1 (0.47%) InVision
4 1 (0.47%) Sketch
Business Applications
1 6 (2.83%) Remedy ITSM
2 2 (0.94%) Oracle EBS
3 1 (0.47%) NetSuite
3 1 (0.47%) Primavera
3 1 (0.47%) Siebel CRM
Cloud Services
1 26 (12.26%) Azure
2 13 (6.13%) AWS
3 10 (4.72%) Microsoft 365
4 9 (4.25%) Azure DevOps
4 9 (4.25%) GCP
5 7 (3.30%) Power Platform
6 6 (2.83%) SaaS
7 5 (2.36%) Entra ID
8 4 (1.89%) IaaS
9 3 (1.42%) OpenShift
9 3 (1.42%) Yammer
10 2 (0.94%) Amazon CloudWatch
10 2 (0.94%) Amazon SQS
10 2 (0.94%) AWS CodeBuild
10 2 (0.94%) AWS Lambda
10 2 (0.94%) AWS Step Functions
10 2 (0.94%) GitHub
10 2 (0.94%) Power Automate
10 2 (0.94%) PowerApps
10 2 (0.94%) Serverless
Communications & Networking
1 20 (9.43%) Firewall
2 19 (8.96%) 5G
3 18 (8.49%) Radio Access Network
4 14 (6.60%) MPLS
5 13 (6.13%) Network Security
6 12 (5.66%) 4G
6 12 (5.66%) BGP
7 10 (4.72%) OSPF
8 9 (4.25%) VPN
9 8 (3.77%) 2G
10 6 (2.83%) 3G
10 6 (2.83%) Wireless
11 5 (2.36%) Cisco ASA
11 5 (2.36%) Ethernet
11 5 (2.36%) Internet
11 5 (2.36%) WAN
12 4 (1.89%) DNS
12 4 (1.89%) HTTP
12 4 (1.89%) Intrusion Detection
12 4 (1.89%) VoIP
Database & Business Intelligence
1 5 (2.36%) Power BI
2 4 (1.89%) Power Query
2 4 (1.89%) SQL Server
3 3 (1.42%) Data Warehouse
3 3 (1.42%) Oracle Database
4 2 (0.94%) Amazon RDS
4 2 (0.94%) DynamoDB
5 1 (0.47%) BigQuery
5 1 (0.47%) Data Lake
5 1 (0.47%) Enterprise Data Warehouse
5 1 (0.47%) PostgreSQL
5 1 (0.47%) Relational Database
5 1 (0.47%) Tableau
Development Applications
1 6 (2.83%) JIRA
2 2 (0.94%) Git
2 2 (0.94%) NUnit
2 2 (0.94%) Postman
2 2 (0.94%) Selenium
3 1 (0.47%) Axure RP
3 1 (0.47%) Cypress.io
3 1 (0.47%) GCC
3 1 (0.47%) Jenkins
3 1 (0.47%) Maven
3 1 (0.47%) Visual Studio
3 1 (0.47%) Vite
General
1 56 (26.42%) Social Skills
2 49 (23.11%) Finance
3 41 (19.34%) Public Sector
4 38 (17.92%) Marketing
5 36 (16.98%) Analytical Skills
6 34 (16.04%) Electronics
6 34 (16.04%) Manufacturing
7 19 (8.96%) Billing
8 16 (7.55%) Legal
9 13 (6.13%) Retail
10 12 (5.66%) Inclusion and Diversity
11 6 (2.83%) Organisational Skills
12 4 (1.89%) Influencing Skills
13 3 (1.42%) Back Office
13 3 (1.42%) Banking
13 3 (1.42%) Digital Economy
14 2 (0.94%) Italian Language
14 2 (0.94%) Law
15 1 (0.47%) Dutch Language
15 1 (0.47%) Military
Job Titles
1 31 (14.62%) Architect
2 21 (9.91%) Senior
3 19 (8.96%) Telecoms Manager
4 18 (8.49%) Developer
5 17 (8.02%) Network Engineer
6 12 (5.66%) Analyst
7 11 (5.19%) Administrator
7 11 (5.19%) Delivery Manager
7 11 (5.19%) Lead
7 11 (5.19%) Solutions Architect
8 10 (4.72%) Designer
8 10 (4.72%) Project Manager
9 9 (4.25%) IT Manager
9 9 (4.25%) Operations Manager
10 8 (3.77%) IT Operations Manager
10 8 (3.77%) Senior Developer
11 7 (3.30%) Network Security Engineer
11 7 (3.30%) Performance Manager
11 7 (3.30%) Security Engineer
11 7 (3.30%) Solutions Designer
Libraries, Frameworks & Software Standards
1 11 (5.19%) REST
1 11 (5.19%) Web Services
2 7 (3.30%) CSS
2 7 (3.30%) HTML
3 5 (2.36%) .NET
3 5 (2.36%) RESTful
3 5 (2.36%) SOAP
4 4 (1.89%) Ajax
4 4 (1.89%) AngularJS
4 4 (1.89%) JSON
4 4 (1.89%) XML
5 3 (1.42%) .NET Core
5 3 (1.42%) Node.js
5 3 (1.42%) React
6 2 (0.94%) AWS CDK
6 2 (0.94%) OpenAPI
6 2 (0.94%) Playwright
6 2 (0.94%) Spring
6 2 (0.94%) Spring Boot
6 2 (0.94%) Swagger
Miscellaneous
1 12 (5.66%) Onboarding
2 7 (3.30%) Data Protection Act
2 7 (3.30%) Product Ownership
3 5 (2.36%) Cloud Native
3 5 (2.36%) Data Centre
3 5 (2.36%) Self-Motivation
4 4 (1.89%) CMDB
4 4 (1.89%) Frameworx
4 4 (1.89%) TM Forum
4 4 (1.89%) Virtual Team
5 3 (1.42%) IoT
5 3 (1.42%) Legacy Systems
5 3 (1.42%) Private Cloud
5 3 (1.42%) Social Media
6 2 (0.94%) NHS
6 2 (0.94%) PKI
7 1 (0.47%) IVR
7 1 (0.47%) Mainframe
7 1 (0.47%) Management Information System
7 1 (0.47%) PACS
Operating Systems
1 15 (7.08%) Windows
2 7 (3.30%) Linux
2 7 (3.30%) Windows Server
3 4 (1.89%) Windows 10
4 2 (0.94%) Windows Server 2012
4 2 (0.94%) Windows Server 2016
4 2 (0.94%) Windows Server 2019
5 1 (0.47%) Unix
Processes & Methodologies
1 52 (24.53%) Problem-Solving
2 40 (18.87%) Business Intelligence
3 36 (16.98%) Agile
3 36 (16.98%) Programme Management
4 34 (16.04%) Digital Marketing
5 26 (12.26%) ITIL
6 24 (11.32%) Change Management
7 21 (9.91%) DevOps
7 21 (9.91%) Project Management
8 19 (8.96%) Service Delivery
9 17 (8.02%) Migration
9 17 (8.02%) Project Delivery
10 16 (7.55%) Continuous Improvement
10 16 (7.55%) Stakeholder Management
11 15 (7.08%) Collaborative Working
11 15 (7.08%) Stakeholder Engagement
12 12 (5.66%) Customer Experience
12 12 (5.66%) Microservices
13 11 (5.19%) Actionable Insight
13 11 (5.19%) Scrum
Programming Languages
1 21 (9.91%) Python
2 12 (5.66%) PowerShell
3 9 (4.25%) SQL
4 8 (3.77%) Java
5 5 (2.36%) TypeScript
6 4 (1.89%) C#
7 3 (1.42%) JavaScript
7 3 (1.42%) VBA
8 2 (0.94%) Bash
8 2 (0.94%) Bicep
8 2 (0.94%) C++
8 2 (0.94%) Go
8 2 (0.94%) PL/SQL
9 1 (0.47%) Assembly Language
9 1 (0.47%) C
9 1 (0.47%) Data Analysis Expressions
9 1 (0.47%) JCL
9 1 (0.47%) Natural
9 1 (0.47%) Perl
Qualifications
1 36 (16.98%) Security Cleared
2 29 (13.68%) SC Cleared
3 21 (9.91%) Degree
4 10 (4.72%) Azure Certification
4 10 (4.72%) Microsoft Certification
5 7 (3.30%) Computer Science Degree
6 6 (2.83%) AWS Certification
6 6 (2.83%) AWS Certified Solutions Architect
6 6 (2.83%) Cisco Certification
6 6 (2.83%) PMI Certification
7 5 (2.36%) ITIL Certification
7 5 (2.36%) PMP
8 3 (1.42%) APMP
8 3 (1.42%) CCNP
8 3 (1.42%) CISSP
8 3 (1.42%) RHCSA
9 2 (0.94%) BPSS Clearance
9 2 (0.94%) Chartered Engineer
9 2 (0.94%) CISM
9 2 (0.94%) PRINCE2 Practitioner
Quality Assurance & Compliance
1 11 (5.19%) QA
2 6 (2.83%) SLA
3 3 (1.42%) Data Quality
3 3 (1.42%) GDPR
4 2 (0.94%) Accessibility
4 2 (0.94%) ISO/IEC 27001
4 2 (0.94%) P3O
4 2 (0.94%) PMO
5 1 (0.47%) GRC
5 1 (0.47%) HIPAA
5 1 (0.47%) SOC 2
System Software
1 11 (5.19%) Active Directory
2 8 (3.77%) Docker
3 7 (3.30%) VMware Infrastructure
4 4 (1.89%) vSphere
5 1 (0.47%) Firmware
Systems Management
1 12 (5.66%) Ansible
2 10 (4.72%) Kubernetes
3 8 (3.77%) Microsoft Intune
4 6 (2.83%) Terraform
5 3 (1.42%) Amdocs OSS
6 2 (0.94%) NSN NetAct
7 1 (0.47%) FortiGate
7 1 (0.47%) OfficeScan
7 1 (0.47%) Single Sign-On
7 1 (0.47%) Trend Micro Deep Security
Vendors
1 35 (16.51%) SAP
2 29 (13.68%) Microsoft
3 18 (8.49%) Cisco
4 12 (5.66%) ServiceNow
5 11 (5.19%) Splunk
6 10 (4.72%) VMware
7 9 (4.25%) Ericsson
7 9 (4.25%) Google
8 7 (3.30%) BT
8 7 (3.30%) Nokia
8 7 (3.30%) Remedy
8 7 (3.30%) Salesforce
9 6 (2.83%) BMC
9 6 (2.83%) CheckPoint
10 5 (2.36%) Oracle
11 4 (1.89%) Dynatrace
11 4 (1.89%) Fortinet
11 4 (1.89%) Huawei
12 3 (1.42%) Ciena
12 3 (1.42%) NetCracker