Administrator Jobs in London

Administrator
England > London

The median Administrator salary in London is £50,121 per year, according to job vacancies posted during the 6 months leading to 18 May 2025.

The table below provides salary benchmarking and summary statistics, comparing them to the same period in the previous two years.

6 months to
18 May 2025
Same period 2024 Same period 2023
Rank 257 254 289
Rank change year-on-year -3 +35 +132
Permanent jobs requiring an Administrator 140 278 409
As % of all permanent jobs advertised in London 1.08% 1.18% 1.22%
As % of the Job Titles category 1.20% 1.25% 1.28%
Number of salaries quoted 104 204 331
10th Percentile £28,000 £26,000 £36,250
25th Percentile £36,688 £32,000 £42,500
Median annual salary (50th Percentile) £50,121 £47,500 £60,000
Median % change year-on-year +5.52% -20.83% +20.00%
75th Percentile £63,750 £65,000 £70,000
90th Percentile £80,000 £73,750 £87,500
England median annual salary £45,000 £35,000 £47,500
% change year-on-year +28.57% -26.32% +5.56%

All Permanent IT Job Vacancies
London

For comparison with the information above, the following table provides summary statistics for all permanent IT job vacancies in London. Most job vacancies include a discernible job title that can be normalized. As such, the figures in the second row provide an indication of the number of permanent jobs in our overall sample.

Permanent vacancies in London with a recognized job title 11,676 22,285 31,986
% of permanent jobs with a recognized job title 90.22% 94.22% 95.14%
Number of salaries quoted 7,282 16,637 23,612
10th Percentile £41,250 £37,500 £42,445
25th Percentile £55,000 £51,250 £55,000
Median annual salary (50th Percentile) £75,000 £70,000 £72,500
Median % change year-on-year +7.14% -3.45% +3.57%
75th Percentile £100,000 £93,750 £95,000
90th Percentile £122,500 £115,000 £115,000
England median annual salary £56,500 £53,000 £60,800
% change year-on-year +6.60% -12.83% +1.33%

Administrator
Job Vacancy Trend in London

Job postings that featured Administrator in the job title as a proportion of all IT jobs advertised in London.
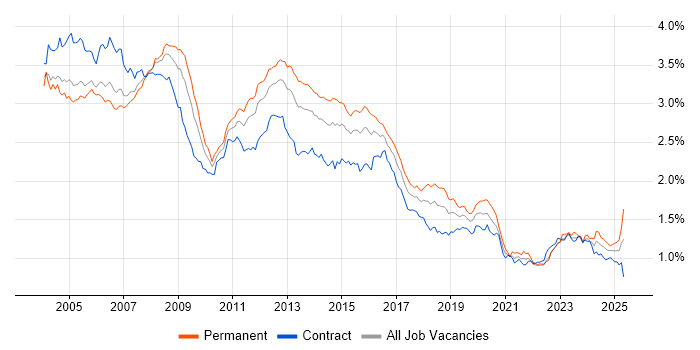
Job vacancy trend for Administrator in London

Administrator
Salary Trend in London

3-month moving average salary quoted in jobs citing Administrator in London.

Salary trend for Administrator in London

Administrator
Salary Histogram in London

Salary distribution for jobs citing Administrator in London over the 6 months to 18 May 2025.

Salary histogram for Administrator in London

Administrator
Job Locations in London

The table below looks at the demand and provides a guide to the median salaries quoted in IT jobs citing Administrator within the London region over the 6 months to 18 May 2025. The 'Rank Change' column provides an indication of the change in demand within each location based on the same 6 month period last year.

Location Rank Change
on Same Period
Last Year
Matching
Permanent
IT Job Ads
Median Salary
Past 6 Months
Median Salary
% Change
on Same Period
Last Year
Live
Jobs
Central London +9 26 £45,000 -18.18% 9
South London -32 4 £80,000 +168.34% 9
West London +17 3 £32,500 +25.00% 17
East London -12 1 £29,500 +7.27% 5
Administrator
England

Administrator Skill Set
Top 30 Co-occurring Skills and Capabilities in London

For the 6 months to 18 May 2025, Administrator job roles required the following skills and capabilities in order of popularity. The figures indicate the absolute number co-occurrences and as a proportion of all permanent job ads across the London region featuring Administrator in the job title.

1 58 (41.43%) Social Skills
2 49 (35.00%) Microsoft
3 45 (32.14%) Problem-Solving
4 38 (27.14%) Microsoft 365
5 37 (26.43%) Linux
6 36 (25.71%) Windows
7 35 (25.00%) Finance
8 32 (22.86%) Analytical Skills
9 25 (17.86%) VMware
10 24 (17.14%) VMware Infrastructure
11 23 (16.43%) Microsoft Office
11 23 (16.43%) DevOps
12 22 (15.71%) Active Directory
13 21 (15.00%) Degree
13 21 (15.00%) Azure
14 19 (13.57%) ITIL
14 19 (13.57%) SharePoint
15 18 (12.86%) Salesforce
15 18 (12.86%) PowerShell
15 18 (12.86%) Windows Server
16 16 (11.43%) Red Hat
17 15 (10.71%) Microsoft Exchange
17 15 (10.71%) SQL
17 15 (10.71%) Ansible
17 15 (10.71%) Organisational Skills
18 14 (10.00%) Nagios
18 14 (10.00%) QA
19 13 (9.29%) AWS
19 13 (9.29%) Bash
19 13 (9.29%) Cisco

Administrator Skill Set
Co-occurring Skills and Capabilities in London by Category

The follow tables expand on the table above by listing co-occurrences grouped by category. The same employment type, locality and period is covered with up to 20 co-occurrences shown in each of the following categories:

Application Platforms
1 19 (13.57%) SharePoint
2 15 (10.71%) Microsoft Exchange
3 4 (2.86%) Tomcat
4 3 (2.14%) IIS
4 3 (2.14%) nginx
4 3 (2.14%) SharePoint Server
5 1 (0.71%) Apache
5 1 (0.71%) CMS
5 1 (0.71%) Confluence
5 1 (0.71%) Drupal
Applications
1 23 (16.43%) Microsoft Office
2 13 (9.29%) Microsoft Excel
3 1 (0.71%) Microsoft PowerPoint
3 1 (0.71%) Spreadsheet
Business Applications
1 11 (7.86%) NetSuite
2 9 (6.43%) Dynamics NAV
3 5 (3.57%) Exchequer
3 5 (3.57%) Shopify
4 2 (1.43%) Dynamics CRM
4 2 (1.43%) Salesforce CRM
5 1 (0.71%) Oracle Applications
5 1 (0.71%) Oracle EBS
Cloud Services
1 38 (27.14%) Microsoft 365
2 21 (15.00%) Azure
3 13 (9.29%) AWS
4 10 (7.14%) Power Platform
5 9 (6.43%) Azure DevOps
5 9 (6.43%) OneDrive
6 5 (3.57%) PowerApps
7 4 (2.86%) Power Automate
8 3 (2.14%) Dynamics 365
8 3 (2.14%) Entra ID
8 3 (2.14%) GCP
8 3 (2.14%) SaaS
9 2 (1.43%) Azure Monitor
9 2 (1.43%) GitHub
9 2 (1.43%) Mimecast
10 1 (0.71%) Google Workspace
10 1 (0.71%) Microsoft Purview
10 1 (0.71%) Nutanix
10 1 (0.71%) OCI
10 1 (0.71%) ShareGate
Communications & Networking
1 13 (9.29%) Firewall
2 10 (7.14%) LAN
3 9 (6.43%) WAN
4 7 (5.00%) DNS
5 6 (4.29%) TCP/IP
5 6 (4.29%) VoIP
6 5 (3.57%) VLAN
6 5 (3.57%) WebEx
7 4 (2.86%) VPN
8 3 (2.14%) Multicast
9 2 (1.43%) HTTP
9 2 (1.43%) SAN
9 2 (1.43%) VSAN
10 1 (0.71%) BGP
10 1 (0.71%) EIGRP
10 1 (0.71%) Internet
10 1 (0.71%) MPLS
10 1 (0.71%) OSPF
10 1 (0.71%) RTP
10 1 (0.71%) WLAN
Database & Business Intelligence
1 4 (2.86%) MySQL
1 4 (2.86%) SQL Server
2 2 (1.43%) Azure SQL Database
2 2 (1.43%) Power BI
3 1 (0.71%) Data Warehouse
3 1 (0.71%) Electronic Patient Records
3 1 (0.71%) Oracle Database
3 1 (0.71%) Oracle Exadata
3 1 (0.71%) Oracle Reports
3 1 (0.71%) Relational Database
3 1 (0.71%) SQL Server Integration Services
Development Applications
1 11 (7.86%) Git
2 6 (4.29%) JIRA
General
1 58 (41.43%) Social Skills
2 35 (25.00%) Finance
3 32 (22.86%) Analytical Skills
4 15 (10.71%) Organisational Skills
5 9 (6.43%) Banking
6 6 (4.29%) Telecoms
7 5 (3.57%) Law
8 4 (2.86%) Inclusion and Diversity
9 3 (2.14%) Documentation Skills
9 3 (2.14%) Portuguese Language
10 2 (1.43%) Back Office
10 2 (1.43%) Financial Institution
10 2 (1.43%) Legal
10 2 (1.43%) Retail
11 1 (0.71%) Advertising
11 1 (0.71%) French Language
11 1 (0.71%) General Ledger
11 1 (0.71%) German Language
11 1 (0.71%) Polish Language
11 1 (0.71%) Public Sector
Libraries, Frameworks & Software Standards
1 3 (2.14%) LEMP Stack
1 3 (2.14%) Node.js
2 2 (1.43%) Lightning Web Components
2 2 (1.43%) Microsoft Graph
2 2 (1.43%) WebSockets
3 1 (0.71%) FIX Protocol
3 1 (0.71%) FreeSWITCH
3 1 (0.71%) HTML
3 1 (0.71%) JSON
3 1 (0.71%) libvirt
3 1 (0.71%) Middleware
3 1 (0.71%) Oracle Fusion
3 1 (0.71%) Oracle GoldenGate
Miscellaneous
1 11 (7.86%) Data Centre
2 10 (7.14%) Management Information System
3 9 (6.43%) Self-Motivation
4 8 (5.71%) Onboarding
5 5 (3.57%) CCTV
6 4 (2.86%) Wiki
7 3 (2.14%) Product Ownership
8 2 (1.43%) CMDB
8 2 (1.43%) Cyber Security Posture
8 2 (1.43%) Cyber Threat
8 2 (1.43%) Cyberattack
8 2 (1.43%) Data Protection Act
8 2 (1.43%) Replication
9 1 (0.71%) Device Driver
9 1 (0.71%) Equities
9 1 (0.71%) Fixed Income
9 1 (0.71%) Foreign Exchange (FX)
9 1 (0.71%) Handset
9 1 (0.71%) Life Science
9 1 (0.71%) PACS
Operating Systems
1 37 (26.43%) Linux
2 36 (25.71%) Windows
3 18 (12.86%) Windows Server
4 12 (8.57%) Windows 10
5 10 (7.14%) CentOS
5 10 (7.14%) Red Hat Enterprise Linux
6 7 (5.00%) Unix
7 6 (4.29%) AIX
8 5 (3.57%) Android
9 4 (2.86%) Rocky
9 4 (2.86%) Solaris
10 2 (1.43%) Mac OS
10 2 (1.43%) Windows Server 2019
11 1 (0.71%) CoreOS
11 1 (0.71%) Debian
11 1 (0.71%) Ubuntu
11 1 (0.71%) Windows Server 2016
Processes & Methodologies
1 45 (32.14%) Problem-Solving
2 23 (16.43%) DevOps
3 19 (13.57%) ITIL
4 12 (8.57%) Disaster Recovery
4 12 (8.57%) Migration
4 12 (8.57%) Stakeholder Management
5 11 (7.86%) Cybersecurity
5 11 (7.86%) Supply Chain Management
6 10 (7.14%) CRM
7 9 (6.43%) CI/CD
7 9 (6.43%) Root Cause Analysis
8 8 (5.71%) Capacity Planning
8 8 (5.71%) Configuration Management
8 8 (5.71%) Data Migration
9 7 (5.00%) Data Protection
9 7 (5.00%) Problem Management
9 7 (5.00%) Time Management
10 6 (4.29%) Analytics
10 6 (4.29%) ITSM
10 6 (4.29%) Workflow
Programming Languages
1 18 (12.86%) PowerShell
2 15 (10.71%) SQL
3 13 (9.29%) Bash
4 12 (8.57%) Python
5 5 (3.57%) JavaScript
6 3 (2.14%) Perl
7 1 (0.71%) Clipper
7 1 (0.71%) PL/SQL
7 1 (0.71%) Shell Script
7 1 (0.71%) T-SQL
Qualifications
1 21 (15.00%) Degree
2 8 (5.71%) ITIL Certification
3 7 (5.00%) Cisco Certification
4 6 (4.29%) AWS Certification
4 6 (4.29%) IBM AIX Certification
5 5 (3.57%) Computer Science Degree
5 5 (3.57%) DBS Check
6 4 (2.86%) RHCE
6 4 (2.86%) RHCSA
7 3 (2.14%) Microsoft Certification
8 1 (0.71%) ACCA
8 1 (0.71%) CCNA
8 1 (0.71%) CCNP
8 1 (0.71%) CEH
8 1 (0.71%) CIMA
8 1 (0.71%) ICAEW
8 1 (0.71%) MCP
8 1 (0.71%) MCSA
8 1 (0.71%) MCSE
8 1 (0.71%) Postgraduate
Quality Assurance & Compliance
1 14 (10.00%) QA
2 6 (4.29%) ISO/IEC 27001
2 6 (4.29%) SLA
3 5 (3.57%) GDPR
4 4 (2.86%) SOC 2
5 2 (1.43%) ISO 9001
6 1 (0.71%) Data Quality
6 1 (0.71%) DICOM
6 1 (0.71%) HL7
System Software
1 24 (17.14%) VMware Infrastructure
2 22 (15.71%) Active Directory
3 6 (4.29%) vSphere
4 2 (1.43%) Postfix
4 2 (1.43%) VMware ESXi
5 1 (0.71%) Corosync
5 1 (0.71%) Kamailio
5 1 (0.71%) KVM
5 1 (0.71%) Virtual Machines
Systems Management
1 15 (10.71%) Ansible
2 14 (10.00%) Nagios
3 10 (7.14%) Microsoft Intune
4 7 (5.00%) SCCM
5 6 (4.29%) Terraform
6 5 (3.57%) PaperCut
7 4 (2.86%) Graylog
7 4 (2.86%) Opsgenie
8 3 (2.14%) Grafana
8 3 (2.14%) Proxmox
8 3 (2.14%) Puppet
8 3 (2.14%) Red Hat Satellite
9 2 (1.43%) Microsoft Clustering
9 2 (1.43%) Prometheus
9 2 (1.43%) ZABBIX
10 1 (0.71%) Icinga
10 1 (0.71%) Jamf Pro
10 1 (0.71%) Kubernetes
10 1 (0.71%) Pacemaker
10 1 (0.71%) Single Sign-On
Vendors
1 49 (35.00%) Microsoft
2 25 (17.86%) VMware
3 18 (12.86%) Salesforce
4 16 (11.43%) Red Hat
5 13 (9.29%) Cisco
6 7 (5.00%) Citrix
6 7 (5.00%) SolarWinds
6 7 (5.00%) Sophos
7 5 (3.57%) Apple
7 5 (3.57%) Dell KACE
7 5 (3.57%) HP
7 5 (3.57%) ServiceNow
8 4 (2.86%) IBM
8 4 (2.86%) Okta
8 4 (2.86%) Palo Alto
8 4 (2.86%) Xero
9 3 (2.14%) SAP
9 3 (2.14%) Veeam
9 3 (2.14%) Yardi
10 2 (1.43%) Proofpoint