ITSM Jobs in London

IT Service Management (ITSM)
England > London

The table below provides summary statistics for permanent job vacancies advertised in London requiring ITSM skills. It includes a benchmarking guide to the annual salaries offered in vacancies that cited ITSM over the 6 months leading up to 31 May 2025, comparing them to the same period in the previous two years.

6 months to
31 May 2025
Same period 2024 Same period 2023
Rank 141 175 228
Rank change year-on-year +34 +53 +148
Permanent jobs citing ITSM 308 442 515
As % of all permanent jobs advertised in London 2.41% 1.84% 1.60%
As % of the Processes & Methodologies category 2.50% 2.04% 1.68%
Number of salaries quoted 206 361 423
10th Percentile £32,500 £31,250 £35,000
25th Percentile £42,500 £41,500 £42,500
Median annual salary (50th Percentile) £65,000 £64,500 £62,000
Median % change year-on-year +0.78% +4.03% +13.76%
75th Percentile £75,000 £80,000 £86,250
90th Percentile £90,000 £95,000 £93,750
England median annual salary £46,000 £50,000 £52,000
% change year-on-year -8.00% -3.85% +4.52%

All Process and Methodology Skills
London

ITSM falls under the Processes and Methodologies category. For comparison with the information above, the following table provides summary statistics for all permanent job vacancies requiring process or methodology skills in London.

Permanent vacancies with a requirement for process or methodology skills 12,300 21,691 30,657
As % of all permanent jobs advertised in London 96.24% 90.27% 95.26%
Number of salaries quoted 6,989 15,892 22,392
10th Percentile £41,750 £37,500 £42,750
25th Percentile £55,500 £51,250 £55,000
Median annual salary (50th Percentile) £75,000 £70,000 £75,000
Median % change year-on-year +7.14% -6.67% +7.14%
75th Percentile £100,000 £95,000 £95,000
90th Percentile £123,750 £115,000 £116,250
England median annual salary £57,500 £55,000 £62,500
% change year-on-year +4.55% -12.00% +4.17%

ITSM
Job Vacancy Trend in London

Job postings citing ITSM as a proportion of all IT jobs advertised in London.
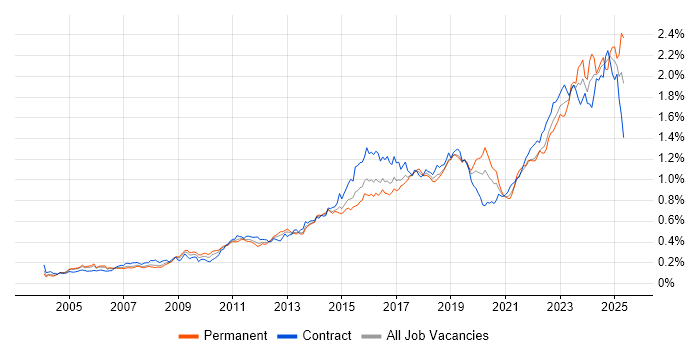
Job vacancy trend for ITSM in London

ITSM
Salary Trend in London

3-month moving average salary quoted in jobs citing ITSM in London.

Salary trend for ITSM in London

ITSM
Salary Histogram in London

Salary distribution for jobs citing ITSM in London over the 6 months to 31 May 2025.

Salary histogram for ITSM in London

ITSM
Job Locations in London

The table below looks at the demand and provides a guide to the median salaries quoted in IT jobs citing ITSM within the London region over the 6 months to 31 May 2025. The 'Rank Change' column provides an indication of the change in demand within each location based on the same 6 month period last year.

Location Rank Change
on Same Period
Last Year
Matching
Permanent
IT Job Ads
Median Salary
Past 6 Months
Median Salary
% Change
on Same Period
Last Year
Live
Jobs
Central London 0 72 £44,590 -31.40% 16
West London +25 17 £31,250 -51.92% 3
East London -2 16 £100,000 +198.51% 2
South London -8 7 £75,000 +74.42% 1
North London - 3 - - 1
ITSM
England

ITSM
Co-occurring Skills and Capabilities in London by Category

The follow tables expand on the table above by listing co-occurrences grouped by category. The same employment type, locality and period is covered with up to 20 co-occurrences shown in each of the following categories:

Application Platforms
1 25 (8.12%) Microsoft Exchange
2 6 (1.95%) SharePoint
3 4 (1.30%) Confluence
Applications
1 35 (11.36%) Microsoft Office
2 4 (1.30%) Chatbot
3 1 (0.32%) Camtasia
3 1 (0.32%) Final Cut Pro
3 1 (0.32%) Microsoft Excel
3 1 (0.32%) Microsoft PowerPoint
3 1 (0.32%) MS Visio
Business Applications
1 14 (4.55%) Remedy ITSM
2 1 (0.32%) Dynamics CRM
2 1 (0.32%) Elite 3E
2 1 (0.32%) Magento
Cloud Services
1 66 (21.43%) Azure
2 65 (21.10%) Microsoft 365
3 26 (8.44%) Entra ID
4 11 (3.57%) AWS
4 11 (3.57%) SaaS
5 10 (3.25%) Azure Monitor
5 10 (3.25%) Power Platform
6 7 (2.27%) Azure Data Factory
6 7 (2.27%) Azure Logic Apps
6 7 (2.27%) Dynamics 365
7 5 (1.62%) Nutanix
8 4 (1.30%) Amazon Bedrock
8 4 (1.30%) BlazeMeter
8 4 (1.30%) OneDrive
9 3 (0.97%) Cloud Computing
9 3 (0.97%) GitHub
10 2 (0.65%) Azure DevOps
10 2 (0.65%) GCP
10 2 (0.65%) Salesforce Service Cloud
10 2 (0.65%) Serverless
Communications & Networking
1 25 (8.12%) Broadband
2 22 (7.14%) DNS
3 18 (5.84%) VPN
4 9 (2.92%) DHCP
5 8 (2.60%) Network Security
5 8 (2.60%) VLAN
6 7 (2.27%) SAN
6 7 (2.27%) WAN
7 6 (1.95%) Firewall
7 6 (1.95%) LAN
8 5 (1.62%) VoIP
9 4 (1.30%) Cisco IOS
9 4 (1.30%) FTP
9 4 (1.30%) IPv4
9 4 (1.30%) NAS
9 4 (1.30%) PBX
9 4 (1.30%) SMTP
9 4 (1.30%) Structured Cabling
9 4 (1.30%) TCP/IP
10 3 (0.97%) Unified Communications
Database & Business Intelligence
1 15 (4.87%) SQL Server
2 9 (2.92%) DB2
2 9 (2.92%) Relational Database
2 9 (2.92%) SQL Server Integration Services
3 3 (0.97%) SQL Server Reporting Services
4 2 (0.65%) Power BI
5 1 (0.32%) Elasticsearch
5 1 (0.32%) MongoDB
Development Applications
1 10 (3.25%) JIRA
2 9 (2.92%) Visual Studio
3 5 (1.62%) Jenkins
4 4 (1.30%) Git
4 4 (1.30%) SQL Server Management Studio (SSMS)
5 2 (0.65%) Octopus Deploy
5 2 (0.65%) TeamCity
6 1 (0.32%) Bitbucket
General
1 144 (46.75%) Social Skills
2 83 (26.95%) Finance
3 67 (21.75%) Analytical Skills
4 65 (21.10%) Law
5 31 (10.06%) Games
6 25 (8.12%) Inclusion and Diversity
6 25 (8.12%) Public Sector
7 23 (7.47%) Marketing
8 22 (7.14%) Telecoms
9 19 (6.17%) Electronics
9 19 (6.17%) Manufacturing
10 16 (5.19%) Banking
11 11 (3.57%) Organisational Skills
12 8 (2.60%) Financial Institution
12 8 (2.60%) Front Office
12 8 (2.60%) Investment Banking
12 8 (2.60%) Legal
13 4 (1.30%) Presentation Skills
14 3 (0.97%) Advertising
15 2 (0.65%) Influencing Skills
Job Titles
1 87 (28.25%) Analyst
2 83 (26.95%) Senior
3 47 (15.26%) IT Support
4 45 (14.61%) Support Analyst
5 38 (12.34%) ServiceNow Manager
6 35 (11.36%) IT Manager
7 32 (10.39%) Architect
8 31 (10.06%) Senior Manager
8 31 (10.06%) ServiceNow Architect
9 30 (9.74%) Solutions Architect
10 29 (9.42%) Senior Architect
10 29 (9.42%) Senior Solutions Architect
10 29 (9.42%) Service Manager
11 28 (9.09%) Support Manager
12 26 (8.44%) Applications Support
12 26 (8.44%) Service Analyst
13 25 (8.12%) Engineering Manager
13 25 (8.12%) Senior Service Manager
14 24 (7.79%) IT Analyst
15 19 (6.17%) IT Support Manager
Libraries, Frameworks & Software Standards
1 12 (3.90%) .NET
2 10 (3.25%) SOAP
3 9 (2.92%) .NET Framework
3 9 (2.92%) ASP.NET
4 5 (1.62%) REST
5 4 (1.30%) CSS
5 4 (1.30%) HTML
5 4 (1.30%) LangChain
5 4 (1.30%) Web Services
5 4 (1.30%) XML
6 3 (0.97%) AngularJS
6 3 (0.97%) Elastic Stack
6 3 (0.97%) JSON
7 2 (0.65%) LDAP
7 2 (0.65%) Lightning Web Components
7 2 (0.65%) React
7 2 (0.65%) YAML
8 1 (0.32%) Ajax
8 1 (0.32%) EDI
8 1 (0.32%) FIX Protocol
Miscellaneous
1 50 (16.23%) Management Information System
2 35 (11.36%) Product Ownership
3 29 (9.42%) CMDB
4 25 (8.12%) Video\Live Streaming
5 11 (3.57%) Data Centre
6 9 (2.92%) Video Conferencing
7 8 (2.60%) Hedge funds
8 6 (1.95%) Foreign Exchange (FX)
8 6 (1.95%) Onboarding
8 6 (1.95%) Self-Motivation
9 5 (1.62%) Blackberry
10 4 (1.30%) Algorithms
10 4 (1.30%) Cloud Native
10 4 (1.30%) Mobile Games
11 3 (0.97%) Analytical Mindset
11 3 (0.97%) Clustering
11 3 (0.97%) Cyber Defence
11 3 (0.97%) Freedom of Information
11 3 (0.97%) Replication
12 2 (0.65%) NHS
Operating Systems
1 76 (24.68%) Windows
2 46 (14.94%) Windows 10
3 21 (6.82%) Windows Server
4 14 (4.55%) Mac OS
5 11 (3.57%) Android
6 10 (3.25%) Apple iOS
6 10 (3.25%) Windows Server 2012
7 9 (2.92%) Windows Server 2019
8 8 (2.60%) Unix
9 6 (1.95%) Linux
9 6 (1.95%) Windows Server 2016
10 3 (0.97%) Red Hat Enterprise Linux
Processes & Methodologies
1 153 (49.68%) ITIL
2 152 (49.35%) Service Management
3 122 (39.61%) Service Delivery
4 83 (26.95%) Problem-Solving
5 75 (24.35%) Roadmaps
6 71 (23.05%) Incident Management
7 70 (22.73%) Change Management
8 69 (22.40%) Computer Science
9 55 (17.86%) Continuous Improvement
10 47 (15.26%) Workflow
11 44 (14.29%) Problem Management
12 43 (13.96%) Customer Service
13 40 (12.99%) Artificial Intelligence
14 35 (11.36%) Business Strategy
14 35 (11.36%) Cybersecurity
15 34 (11.04%) User Experience
16 33 (10.71%) Thought Leadership
17 30 (9.74%) CAD
17 30 (9.74%) Digital Transformation Programme
18 29 (9.42%) Software Engineering
Programming Languages
1 24 (7.79%) SQL
2 23 (7.47%) PowerShell
3 17 (5.52%) PL/SQL
4 12 (3.90%) C#
4 12 (3.90%) JavaScript
4 12 (3.90%) Python
5 11 (3.57%) Java
6 9 (2.92%) T-SQL
6 9 (2.92%) VB.NET
7 5 (1.62%) Shell Script
8 4 (1.30%) C
8 4 (1.30%) C++
9 2 (0.65%) Apex Code
9 2 (0.65%) Ruby
10 1 (0.32%) Bash
10 1 (0.32%) Gremlin
10 1 (0.32%) SOQL
Qualifications
1 88 (28.57%) Degree
2 60 (19.48%) Computer Science Degree
3 30 (9.74%) PMI Certification
3 30 (9.74%) PMP
4 24 (7.79%) CISSP
5 18 (5.84%) ITIL Certification
6 11 (3.57%) Security Cleared
7 9 (2.92%) ITIL Foundation Certificate
8 7 (2.27%) Microsoft Certification
9 5 (1.62%) Cisco Certification
9 5 (1.62%) DV Cleared
9 5 (1.62%) Network+ Certification
10 4 (1.30%) CCNA
11 3 (0.97%) A+ Certification
12 2 (0.65%) Master's Degree
13 1 (0.32%) Azure Certification
13 1 (0.32%) CCNP
13 1 (0.32%) DBS Check
13 1 (0.32%) MOS
13 1 (0.32%) SC Cleared
Quality Assurance & Compliance
1 28 (9.09%) QA
2 27 (8.77%) SLA
3 19 (6.17%) Cyber Essentials
3 19 (6.17%) GDPR
4 15 (4.87%) Cyber Essentials PLUS
5 9 (2.92%) ISO/IEC 27001
6 3 (0.97%) ISO 22301
6 3 (0.97%) PMO
7 2 (0.65%) GRC
7 2 (0.65%) ISO 9001
7 2 (0.65%) PCI DSS
8 1 (0.32%) COBIT
8 1 (0.32%) NCSC
8 1 (0.32%) NIST
8 1 (0.32%) SOC 2
System Software
1 54 (17.53%) Active Directory
2 11 (3.57%) VMware Infrastructure
3 4 (1.30%) Hyper-V
3 4 (1.30%) Virtual Desktop
3 4 (1.30%) VMware ESXi
4 3 (0.97%) Microsoft Virtual Server
4 3 (0.97%) Virtual Servers
5 1 (0.32%) Virtual Machines
Systems Management
1 21 (6.82%) Microsoft Intune
2 19 (6.17%) SCCM
3 9 (2.92%) Progress Chef
4 7 (2.27%) Grafana
5 6 (1.95%) Ansible
6 4 (1.30%) Kubernetes
6 4 (1.30%) WSUS
7 3 (0.97%) Jamf Pro
7 3 (0.97%) Puppet
8 2 (0.65%) SCOM
9 1 (0.32%) FortiGate
9 1 (0.32%) HP UCMDB
9 1 (0.32%) ITRS Geneos
9 1 (0.32%) Plesk
9 1 (0.32%) Prometheus
9 1 (0.32%) Single Sign-On
9 1 (0.32%) Terraform
Vendors
1 145 (47.08%) ServiceNow
2 93 (30.19%) Microsoft
3 22 (7.14%) SAP
4 14 (4.55%) Remedy
4 14 (4.55%) VMware
5 13 (4.22%) Cisco
6 11 (3.57%) Oracle
7 10 (3.25%) Okta
8 9 (2.92%) Citrix
9 7 (2.27%) SolarWinds
9 7 (2.27%) Splunk
10 5 (1.62%) Dynatrace
11 4 (1.30%) OpenAI
11 4 (1.30%) Snow
11 4 (1.30%) Trayport
11 4 (1.30%) Veeam
12 3 (0.97%) Atlassian
12 3 (0.97%) HP
12 3 (0.97%) Meraki
12 3 (0.97%) SaltStack