Capacity Planning Jobs in London

Capacity Planning
England > London

The following table provides summary statistics for permanent job vacancies advertised in London with a requirement for Capacity Planning skills. Included is a benchmarking guide to the salaries offered in vacancies that have cited Capacity Planning over the 6 months to 12 May 2024 with a comparison to the same period in the previous 2 years.

6 months to
12 May 2024
Same period 2023 Same period 2022
Rank 418 510 615
Rank change year-on-year +92 +105 -113
Permanent jobs citing Capacity Planning 82 118 280
As % of all permanent jobs advertised in London 0.35% 0.34% 0.41%
As % of the Processes & Methodologies category 0.38% 0.36% 0.43%
Number of salaries quoted 65 67 138
10th Percentile £40,950 £46,250 £52,500
25th Percentile £50,000 £58,500 £58,242
Median annual salary (50th Percentile) £75,000 £70,000 £65,000
Median % change year-on-year +7.14% +7.69% -
75th Percentile £87,500 £86,875 £90,000
90th Percentile £97,500 £95,000 £100,000
England median annual salary £52,500 £60,000 £59,500
% change year-on-year -12.50% +0.84% +3.48%

All Process and Methodology Skills
London

Capacity Planning is in the Processes and Methodologies category. The following table is for comparison with the above and provides summary statistics for all permanent job vacancies advertised in London with a requirement for process or methodology skills.

Permanent vacancies with a requirement for process or methodology skills 21,570 32,778 65,546
As % of all permanent jobs advertised in London 91.16% 95.35% 96.97%
Number of salaries quoted 15,997 23,624 34,030
10th Percentile £37,500 £43,411 £42,500
25th Percentile £51,750 £55,000 £53,750
Median annual salary (50th Percentile) £70,073 £75,000 £70,000
Median % change year-on-year -6.57% +7.14% -
75th Percentile £95,000 £95,000 £92,500
90th Percentile £115,000 £115,000 £111,250
England median annual salary £55,000 £62,500 £60,000
% change year-on-year -12.00% +4.17% +9.09%

Capacity Planning
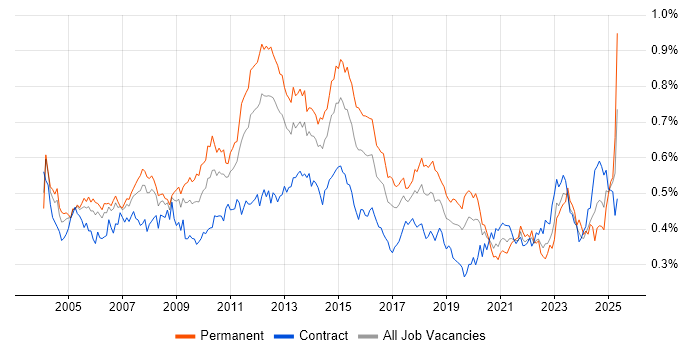
Job Vacancy Trend in London

Job postings citing Capacity Planning as a proportion of all IT jobs advertised in London.

Job vacancy trend for Capacity Planning in London

Capacity Planning
Salary Trend in London

3-month moving average salary quoted in jobs citing Capacity Planning in London.

Salary trend for Capacity Planning in London

Capacity Planning
Salary Histogram in London

Salary distribution for jobs citing Capacity Planning in London over the 6 months to 12 May 2024.

Salary histogram for Capacity Planning in London

Capacity Planning
Job Locations in London

The table below looks at the demand and provides a guide to the median salaries quoted in IT jobs citing Capacity Planning within the London region over the 6 months to 12 May 2024. The 'Rank Change' column provides an indication of the change in demand within each location based on the same 6 month period last year.

Location Rank Change
on Same Period
Last Year
Matching
Permanent
IT Job Ads
Median Salary
Past 6 Months
Median Salary
% Change
on Same Period
Last Year
Live
Jobs
Central London +48 15 £71,250 +1.79% 6
West London +3 1 £27,500 - 1
Capacity Planning
England

Capacity Planning
Co-occurring Skills and Capabilities in London by Category

The follow tables expand on the table above by listing co-occurrences grouped by category. The same employment type, locality and period is covered with up to 20 co-occurrences shown in each of the following categories:

Application Platforms
1 4 (4.88%) SAS
1 4 (4.88%) SharePoint
2 2 (2.44%) Apache
3 1 (1.22%) Confluence
Applications
1 7 (8.54%) Microsoft Excel
2 4 (4.88%) SPSS
3 1 (1.22%) Microsoft Office
3 1 (1.22%) Microsoft Project
Business Applications
1 7 (8.54%) Remedy ITSM
2 2 (2.44%) Dynamics CRM
2 2 (2.44%) SAP Business One
Cloud Services
1 40 (48.78%) Azure
2 17 (20.73%) AWS
3 13 (15.85%) GCP
4 11 (13.41%) Microsoft 365
5 10 (12.20%) Amazon S3
6 9 (10.98%) Entra ID
6 9 (10.98%) Power Platform
7 7 (8.54%) Azure Monitor
7 7 (8.54%) Azure Storage
8 3 (3.66%) SaaS
9 2 (2.44%) Azure DevOps
9 2 (2.44%) OCI
9 2 (2.44%) Power Automate
9 2 (2.44%) PowerApps
10 1 (1.22%) Azure AKS
10 1 (1.22%) ClickUp
10 1 (1.22%) IaaS
10 1 (1.22%) PaaS
10 1 (1.22%) Slack
Communications & Networking
1 26 (31.71%) DNS
2 23 (28.05%) Firewall
3 16 (19.51%) DHCP
4 15 (18.29%) TCP/IP
5 13 (15.85%) VPN
6 12 (14.63%) tcpdump
6 12 (14.63%) Wireless
7 11 (13.41%) Wi-Fi
8 10 (12.20%) Internet
8 10 (12.20%) SNMP
8 10 (12.20%) WAN
9 9 (10.98%) IPsec
9 9 (10.98%) IPv4
9 9 (10.98%) IPv6
9 9 (10.98%) LAN
10 3 (3.66%) Network Security
11 2 (2.44%) Intrusion Detection
11 2 (2.44%) VLAN
11 2 (2.44%) Wireshark
12 1 (1.22%) MPLS
Database & Business Intelligence
1 13 (15.85%) MySQL
2 10 (12.20%) Elasticsearch
2 10 (12.20%) MongoDB
3 7 (8.54%) Power BI
4 6 (7.32%) Tableau
5 5 (6.10%) SQL Server
6 4 (4.88%) Amazon QuickSight
7 2 (2.44%) Azure SQL Database
7 2 (2.44%) Data Mart
7 2 (2.44%) Data Mining
7 2 (2.44%) Data Warehouse
7 2 (2.44%) OLTP
7 2 (2.44%) Oracle Database
7 2 (2.44%) PostgreSQL
7 2 (2.44%) SQL Server Reporting Services
8 1 (1.22%) DB2
8 1 (1.22%) RDBMS
8 1 (1.22%) Relational Database
Development Applications
1 10 (12.20%) Jenkins
2 3 (3.66%) JIRA
3 2 (2.44%) Visual Studio
General
1 40 (48.78%) Analytical Skills
2 33 (40.24%) Social Skills
3 18 (21.95%) Finance
4 11 (13.41%) Telecoms
5 8 (9.76%) Manufacturing
6 7 (8.54%) Influencing Skills
6 7 (8.54%) Law
7 2 (2.44%) Legal
7 2 (2.44%) Presentation Skills
7 2 (2.44%) Retail
8 1 (1.22%) Inclusion and Diversity
8 1 (1.22%) Marketing
8 1 (1.22%) Organisational Skills
8 1 (1.22%) Police
Job Titles
1 15 (18.29%) Senior
2 13 (15.85%) Analyst
3 11 (13.41%) Engineering Manager
3 11 (13.41%) Linux Engineer
3 11 (13.41%) Senior Linux Engineer
4 10 (12.20%) DevOps Engineer
4 10 (12.20%) Network Engineer
4 10 (12.20%) Senior DevOps
4 10 (12.20%) Senior DevOps Engineer
5 9 (10.98%) Linux DevOps Engineer
5 9 (10.98%) Linux/Unix DevOps
6 8 (9.76%) Lead
7 6 (7.32%) Azure Engineer
7 6 (7.32%) Capacity Analyst
7 6 (7.32%) Capacity Planning Analyst
7 6 (7.32%) Cloud Engineer
7 6 (7.32%) Site Reliability Engineer
8 5 (6.10%) DBA
8 5 (6.10%) Infrastructure Manager
8 5 (6.10%) Oracle DBA
Libraries, Frameworks & Software Standards
1 10 (12.20%) Elastic Stack
1 10 (12.20%) YAML
2 4 (4.88%) Web Services
3 2 (2.44%) .NET
3 2 (2.44%) Keycloak
3 2 (2.44%) Middleware
4 1 (1.22%) ARM Templates
4 1 (1.22%) JSON
4 1 (1.22%) Next.js
4 1 (1.22%) React
4 1 (1.22%) Spring
4 1 (1.22%) Spring MVC
Miscellaneous
1 12 (14.63%) Onboarding
2 10 (12.20%) Clustering
3 9 (10.98%) PKI
4 7 (8.54%) Linux Command Line
4 7 (8.54%) Public Cloud
5 4 (4.88%) Algorithms
5 4 (4.88%) Data Centre
5 4 (4.88%) Management Information System
6 2 (2.44%) Analytical Mindset
6 2 (2.44%) Data Structures
6 2 (2.44%) Replication
6 2 (2.44%) Robotics
6 2 (2.44%) Security Posture
6 2 (2.44%) Team-Oriented Environment
6 2 (2.44%) Virtual Team
7 1 (1.22%) Client/Server
7 1 (1.22%) Mainframe
Operating Systems
1 21 (25.61%) Linux
2 19 (23.17%) Windows
3 2 (2.44%) CentOS
3 2 (2.44%) Ubuntu
4 1 (1.22%) Android
4 1 (1.22%) Apple iOS
4 1 (1.22%) Unix
4 1 (1.22%) VMS
4 1 (1.22%) zOS
Processes & Methodologies
1 34 (41.46%) Problem-Solving
2 28 (34.15%) Continuous Improvement
3 25 (30.49%) Disaster Recovery
4 24 (29.27%) High Availability
5 21 (25.61%) Infrastructure as Code
6 19 (23.17%) CI/CD
6 19 (23.17%) DevOps
7 18 (21.95%) Agile
7 18 (21.95%) Containerisation
8 17 (20.73%) Performance Tuning
9 16 (19.51%) Business Continuity
10 15 (18.29%) Incident Management
10 15 (18.29%) ITIL
10 15 (18.29%) Project Management
11 13 (15.85%) Trend Analysis
12 12 (14.63%) Continuous Deployment
12 12 (14.63%) Decision-Making
12 12 (14.63%) Economics
12 12 (14.63%) Load Balancing
12 12 (14.63%) Roadmaps
Programming Languages
1 21 (25.61%) Bash
1 21 (25.61%) PowerShell
2 19 (23.17%) SQL
3 14 (17.07%) Python
4 12 (14.63%) Perl
5 4 (4.88%) Shell Script
5 4 (4.88%) T-SQL
5 4 (4.88%) VBA
6 3 (3.66%) Java
7 2 (2.44%) PHP
7 2 (2.44%) PL/SQL
7 2 (2.44%) R
8 1 (1.22%) COBOL
8 1 (1.22%) REXX
8 1 (1.22%) TypeScript
Qualifications
1 23 (28.05%) Degree
2 9 (10.98%) Security Cleared
3 7 (8.54%) Azure Certification
4 4 (4.88%) Numerate Degree
5 3 (3.66%) Cisco Certification
6 2 (2.44%) CCNA
6 2 (2.44%) CCNP
6 2 (2.44%) ITIL Certification
6 2 (2.44%) Linux+ Certification
6 2 (2.44%) RHCE
6 2 (2.44%) SC Cleared
7 1 (1.22%) (ISC)2 CCSP
7 1 (1.22%) AWS Certification
7 1 (1.22%) CESG Certified Professional
7 1 (1.22%) CISSP
7 1 (1.22%) Computer Science Degree
7 1 (1.22%) CRISC
7 1 (1.22%) Microsoft Certification
7 1 (1.22%) PRINCE2 Certification
Quality Assurance & Compliance
1 4 (4.88%) Data Quality
2 3 (3.66%) QA
3 2 (2.44%) ISO/IEC 27001
3 2 (2.44%) PMO
4 1 (1.22%) GDPR
4 1 (1.22%) NCSC
4 1 (1.22%) NIST
4 1 (1.22%) P3O
4 1 (1.22%) SLA
System Software
1 17 (20.73%) Docker
2 11 (13.41%) Virtual Desktop
3 10 (12.20%) VMware ESXi
4 9 (10.98%) Active Directory
5 2 (2.44%) KVM
5 2 (2.44%) Oracle RAC
5 2 (2.44%) Virtual Machines
5 2 (2.44%) VMware Infrastructure
Systems Management
1 18 (21.95%) Ansible
2 15 (18.29%) Terraform
3 12 (14.63%) Grafana
3 12 (14.63%) Puppet
4 10 (12.20%) Graphite
4 10 (12.20%) HAProxy
4 10 (12.20%) Nagios
4 10 (12.20%) vCenter Server
5 9 (10.98%) Kubernetes
6 4 (4.88%) Data Guard
7 2 (2.44%) Oracle RMAN
7 2 (2.44%) Progress Chef
7 2 (2.44%) Prometheus
Vendors
1 18 (21.95%) Microsoft
2 9 (10.98%) Fortinet
2 9 (10.98%) SolarWinds
3 7 (8.54%) BMC
3 7 (8.54%) Remedy
4 5 (6.10%) Oracle
5 3 (3.66%) SAP
5 3 (3.66%) VMware
6 2 (2.44%) Dynatrace
6 2 (2.44%) Red Hat
6 2 (2.44%) SaltStack
6 2 (2.44%) Splunk
7 1 (1.22%) Cisco
7 1 (1.22%) Juniper
7 1 (1.22%) Ruckus Wireless