
Anthropic Claude Job Trends

Anthropic Claude
UK

The table below provides summary statistics and salary benchmarking for jobs requiring Anthropic Claude skills. It covers permanent job vacancies from the 6 months leading up to 9 October 2026, with comparisons to the same periods in the previous two years.

6 months to
9 Oct 2026
Same period 2025 Same period 2024
Rank 489 671 711
Rank change year-on-year +182 +40 -
Permanent jobs citing Anthropic Claude 345 9 57
As % of all permanent jobs in the UK 0.29% 0.018% 0.079%
As % of the Cloud Services category 1.29% 0.058% 0.24%
Number of salaries quoted 258 8 7
10th Percentile £50,000 £54,450 £46,250
25th Percentile £62,500 £80,625 £51,875
Median annual salary (50th Percentile) £87,500 £97,500 £60,000
Median % change year-on-year -10.26% +62.50% -
75th Percentile £119,688 £115,000 £62,500
90th Percentile £187,500 £139,750 -
UK excluding London median annual salary £75,000 - £60,000

All Cloud Computing Skills
UK

Anthropic Claude falls under the Cloud Services category. For comparison with the information above, the following table provides summary statistics for all permanent job vacancies requiring cloud computing skills.

Permanent vacancies with a requirement for cloud computing skills 26,705 15,573 23,302
As % of all permanent jobs advertised in the UK 22.65% 31.29% 32.12%
Number of salaries quoted 18,286 10,453 14,260
10th Percentile £31,250 £29,000 £35,000
25th Percentile £43,091 £38,500 £46,250
Median annual salary (50th Percentile) £62,500 £59,186 £65,000
Median % change year-on-year +5.60% -8.94% +4.00%
75th Percentile £83,750 £80,000 £82,500
90th Percentile £100,000 £100,000 £102,500
UK excluding London median annual salary £55,000 £50,000 £55,000
% change year-on-year +10.00% -9.09% -

Anthropic Claude
Job Vacancy Trend

Historical trend showing the proportion of permanent IT job postings citing Anthropic Claude relative to all permanent IT jobs advertised.
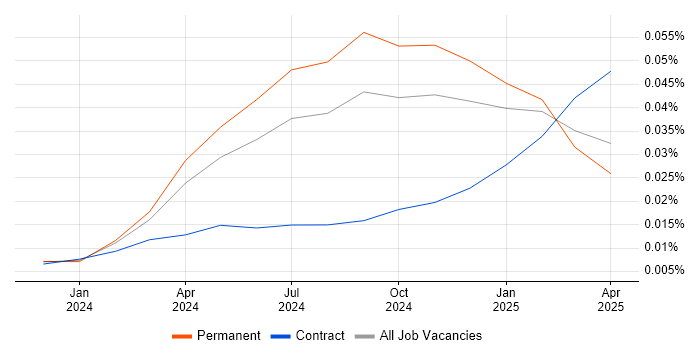
Anthropic Claude job vacancy trend in the UK

Anthropic Claude
Salary Trend

Salary distribution trend for jobs in the UK citing Anthropic Claude.
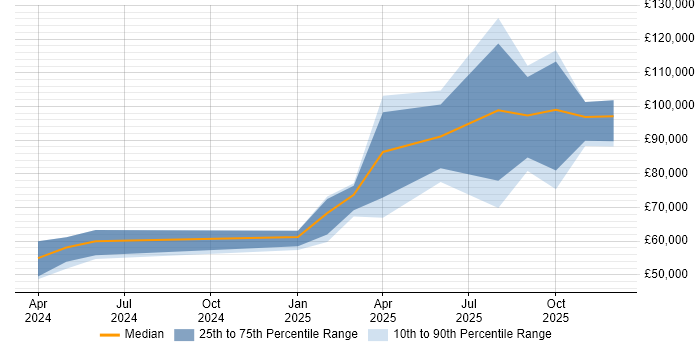
Salary distribution trend for jobs in the UK citing Anthropic Claude

Anthropic Claude
Salary Histogram

Salary distribution for jobs citing Anthropic Claude over the 6 months to 9 October 2026.

Salary histogram for Anthropic Claude in the UK

Anthropic Claude
Top 16 Job Locations

The table below looks at the demand and provides a guide to the median salaries quoted in IT jobs citing Anthropic Claude within the UK over the 6 months to 9 October 2026. The 'Rank Change' column provides an indication of the change in demand within each location based on the same 6 month period last year.

Location Rank Change
on Same Period
Last Year
Matching
Permanent
IT Job Ads
Median Salary
Past 6 Months
Median Salary
% Change
on Same Period
Last Year
Live
Jobs
England +170 331 £87,500 -10.26% 837
London +121 202 £105,000 +7.69% 604
Work from Home +119 156 £105,000 +46.85% 363
UK excluding London - 131 £75,000 - 280
South East - 42 £65,000 - 55
North of England - 41 £85,000 - 82
North West - 33 £85,000 - 42
South West - 20 £87,500 - 23
East of England - 13 £52,500 - 38
Midlands - 10 £65,000 - 20
West Midlands - 9 £65,000 - 12
Yorkshire - 6 £90,000 - 35
Scotland - 4 £105,000 - 40
North East - 2 £36,000 - 5
Northern Ireland - 1 - - 18
East Midlands - 1 - - 8

Anthropic Claude
Co-Occurring Skills & Capabilities by Category

The following tables expand on the one above by listing co-occurrences grouped by category. They cover the same employment type, locality and period, with up to 20 co-occurrences shown in each category:

Application Platforms
1 13 (3.77%) Confluence
2 12 (3.48%) SharePoint
3 2 (0.58%) Apache Solr
3 2 (0.58%) Camunda
3 2 (0.58%) Cloud Foundry
3 2 (0.58%) WordPress
4 1 (0.29%) Adobe Experience Manager
4 1 (0.29%) Apache Airflow
4 1 (0.29%) Apache Spark
4 1 (0.29%) CMS
4 1 (0.29%) Headless CMS
4 1 (0.29%) JBoss
4 1 (0.29%) WebLogic
Applications
1 4 (1.16%) Microsoft Office
2 2 (0.58%) Chatbot
2 2 (0.58%) Microsoft Excel
3 1 (0.29%) Notion
Business Applications
1 3 (0.87%) Magento
1 3 (0.87%) Shopify
2 2 (0.58%) Dynamics NAV
3 1 (0.29%) Elite 3E
3 1 (0.29%) Endur
Cloud Services
1 124 (35.94%) AWS
2 87 (25.22%) GitHub
3 66 (19.13%) GitHub Copilot
4 62 (17.97%) Azure
5 61 (17.68%) ChatGPT
6 53 (15.36%) Amazon Bedrock
7 44 (12.75%) Snowflake
8 36 (10.43%) Microsoft Copilot
9 34 (9.86%) GCP
9 34 (9.86%) SaaS
10 30 (8.70%) Zapier
11 23 (6.67%) Serverless
12 20 (5.80%) GitHub Actions
13 18 (5.22%) Amazon S3
14 17 (4.93%) AWS Lambda
14 17 (4.93%) Copilot Studio
15 15 (4.35%) Amazon EC2
15 15 (4.35%) Cloud Run
15 15 (4.35%) Firebase
15 15 (4.35%) Google Gemini
Communications & Networking
1 2 (0.58%) DNS
1 2 (0.58%) HTTP
1 2 (0.58%) TCP/IP
2 1 (0.29%) Firewall
2 1 (0.29%) Internet
2 1 (0.29%) LAN
2 1 (0.29%) MQTT
2 1 (0.29%) Network Security
2 1 (0.29%) SMS
2 1 (0.29%) VoIP
2 1 (0.29%) WAN
Database & Business Intelligence
1 20 (5.80%) Pinecone
2 18 (5.22%) PostgreSQL
3 16 (4.64%) Chroma
4 13 (3.77%) Amazon RDS
4 13 (3.77%) NoSQL
5 12 (3.48%) MySQL
6 10 (2.90%) SQL Server
7 9 (2.61%) MongoDB
8 8 (2.32%) DynamoDB
9 7 (2.03%) Relational Database
10 6 (1.74%) Power BI
11 4 (1.16%) Elasticsearch
11 4 (1.16%) MariaDB
11 4 (1.16%) Weaviate
12 3 (0.87%) Data Warehouse
12 3 (0.87%) Redis
12 3 (0.87%) Semantic Layer
13 2 (0.58%) CockroachDB
13 2 (0.58%) Looker
13 2 (0.58%) Metadata
Development Applications
1 153 (44.35%) Claude Code
2 15 (4.35%) Git
3 14 (4.06%) JIRA
4 8 (2.32%) GitLab
4 8 (2.32%) Jenkins
4 8 (2.32%) Selenium
5 5 (1.45%) Newman
5 5 (1.45%) Postman
5 5 (1.45%) REST Assured
6 4 (1.16%) Cucumber
6 4 (1.16%) Cypress.io
6 4 (1.16%) Gatling
6 4 (1.16%) JMeter
7 3 (0.87%) Maven
7 3 (0.87%) Xcode
8 2 (0.58%) JUnit
8 2 (0.58%) Mockito
8 2 (0.58%) SonarQube
8 2 (0.58%) Visual Studio
8 2 (0.58%) Visual Studio Code
General
1 131 (37.97%) Finance
2 94 (27.25%) Social Skills
3 59 (17.10%) Banking
4 32 (9.28%) Analytical Skills
5 24 (6.96%) Legal
6 22 (6.38%) Marketing
7 16 (4.64%) Law
8 14 (4.06%) Inclusion and Diversity
9 12 (3.48%) Legal Technology
10 11 (3.19%) Public Sector
11 9 (2.61%) Advertising
11 9 (2.61%) Financial Institution
12 7 (2.03%) Front Office
12 7 (2.03%) Retail
13 3 (0.87%) French Language
13 3 (0.87%) Organisational Skills
14 2 (0.58%) Influencing Skills
15 1 (0.29%) German Language
15 1 (0.29%) Health Technology
15 1 (0.29%) Presentation Skills
Job Titles
1 69 (20.00%) Senior
2 63 (18.26%) Architect
3 61 (17.68%) Software Engineer
4 52 (15.07%) Artificial Intelligence Engineer
4 52 (15.07%) Developer
5 48 (13.91%) Enterprise Architect
6 36 (10.43%) Finance Manager
7 35 (10.14%) Lead
8 23 (6.67%) Senior Developer
9 19 (5.51%) Full-Stack Engineer
10 18 (5.22%) Full-Stack Developer
11 16 (4.64%) GCP Engineer
11 16 (4.64%) GCP Software Engineer
11 16 (4.64%) Senior Software Engineer
12 13 (3.77%) Java Engineer
13 12 (3.48%) Analyst
13 12 (3.48%) Digital Architect
13 12 (3.48%) Enterprise Infrastructure Architect
13 12 (3.48%) Lead Software Engineer
14 11 (3.19%) Senior Full-Stack Developer
Libraries, Frameworks & Software Standards
1 46 (13.33%) LangChain
2 45 (13.04%) React
3 44 (12.75%) .NET
4 42 (12.17%) LangGraph
5 31 (8.99%) REST
6 26 (7.54%) Node.js
7 25 (7.25%) Terraform
8 22 (6.38%) Model Context Protocol
9 18 (5.22%) Next.js
9 18 (5.22%) pgvector
10 17 (4.93%) RESTful
11 15 (4.35%) Kafka
12 13 (3.77%) OAuth
12 13 (3.77%) Spring
12 13 (3.77%) Spring Boot
13 12 (3.48%) CrewAI
13 12 (3.48%) LlamaIndex
14 11 (3.19%) AngularJS
14 11 (3.19%) GraphQL
14 11 (3.19%) JWT
Miscellaneous
1 127 (36.81%) AI Agents
2 43 (12.46%) Hedge funds
3 29 (8.41%) Cloud Native
4 23 (6.67%) Product Ownership
5 19 (5.51%) Distributed Systems
6 18 (5.22%) Enterprise Software
6 18 (5.22%) Low-Code
7 11 (3.19%) Foreign Exchange (FX)
8 10 (2.90%) Analytical Mindset
8 10 (2.90%) Equities
8 10 (2.90%) Greenfield Project
9 8 (2.32%) Self-Motivation
10 7 (2.03%) Derivative
10 7 (2.03%) Equity Derivative
10 7 (2.03%) Fixed Income
11 6 (1.74%) Autonomous Agent
11 6 (1.74%) Onboarding
12 4 (1.16%) Data Fabric
12 4 (1.16%) Distributed Applications
12 4 (1.16%) IoT
Operating Systems
1 6 (1.74%) Windows
2 5 (1.45%) Apple iOS
3 3 (0.87%) Android
4 2 (0.58%) Linux
4 2 (0.58%) Windows 10
5 1 (0.29%) Mac OS
5 1 (0.29%) Windows Server
Processes & Methodologies
1 312 (90.43%) AI
2 124 (35.94%) Software Engineering
3 119 (34.49%) LLM
4 81 (23.48%) Roadmaps
5 78 (22.61%) CI/CD
6 67 (19.42%) Workflow
7 66 (19.13%) Machine Learning
8 59 (17.10%) Agile
9 57 (16.52%) Problem-Solving
10 54 (15.65%) Full-Stack Development
11 52 (15.07%) Asset Management
12 51 (14.78%) Data Science
13 50 (14.49%) Mentoring
14 47 (13.62%) Investment Management
14 47 (13.62%) Stakeholder Management
15 44 (12.75%) DevOps
16 42 (12.17%) Decision-Making
16 42 (12.17%) Generative AI
16 42 (12.17%) Retrieval-Augmented Generation
17 40 (11.59%) Code Quality
Programming Languages
1 86 (24.93%) Python
2 46 (13.33%) SQL
3 44 (12.75%) C#
4 41 (11.88%) Java
4 41 (11.88%) TypeScript
5 18 (5.22%) JavaScript
6 9 (2.61%) Go
7 5 (1.45%) Kotlin
7 5 (1.45%) Ruby
8 4 (1.16%) PHP
9 3 (0.87%) Bash
9 3 (0.87%) PowerShell
9 3 (0.87%) Swift
10 2 (0.58%) Kusto Query Language
10 2 (0.58%) Scala
10 2 (0.58%) Search Processing Language
11 1 (0.29%) R
11 1 (0.29%) T-SQL
Qualifications
1 38 (11.01%) Degree
2 22 (6.38%) Computer Science Degree
3 15 (4.35%) Microsoft Certified Professional
4 12 (3.48%) AWS Certification
5 11 (3.19%) Azure Certification
6 7 (2.03%) AWS Certified Developer
6 7 (2.03%) AWS Certified Solutions Architect
7 6 (1.74%) Security Cleared
8 4 (1.16%) Master's Degree
9 3 (0.87%) ACCA
9 3 (0.87%) Microsoft Certification
9 3 (0.87%) SC Cleared
9 3 (0.87%) TOGAF Certification
10 2 (0.58%) (ISC)2 CCSP
10 2 (0.58%) CASP
10 2 (0.58%) CCSP
10 2 (0.58%) Cisco Certification
10 2 (0.58%) CISSP
10 2 (0.58%) CompTIA CySA+
10 2 (0.58%) CompTIA Security+
Quality Assurance & Compliance
1 29 (8.41%) QA
2 13 (3.77%) NIST
3 12 (3.48%) Sarbanes-Oxley
4 11 (3.19%) Data Quality
5 7 (2.03%) ISO 20022
6 6 (1.74%) Accessibility
7 5 (1.45%) ISO/IEC 27001
8 4 (1.16%) EU AI Act
9 3 (0.87%) IFRS
10 2 (0.58%) ISO/IEC 42001
11 1 (0.29%) Cyber Essentials
11 1 (0.29%) GAAP
11 1 (0.29%) GDPR
11 1 (0.29%) WCAG
System Software
1 33 (9.57%) Docker
2 2 (0.58%) Active Directory
3 1 (0.29%) Hyper-V
3 1 (0.29%) Virtual Desktop
Systems Management
1 37 (10.72%) Kubernetes
2 5 (1.45%) Microsoft Intune
3 3 (0.87%) Single Sign-On
4 2 (0.58%) Argo
4 2 (0.58%) Grafana
4 2 (0.58%) kaniko
4 2 (0.58%) Prometheus
5 1 (0.29%) Istio
5 1 (0.29%) Kubeflow
Vendors
1 64 (18.55%) OpenAI
2 45 (13.04%) Databricks
3 39 (11.30%) Microsoft
4 20 (5.80%) Google
5 9 (2.61%) DocuSign
6 8 (2.32%) RedGate
6 8 (2.32%) Salesforce
7 6 (1.74%) MuleSoft
7 6 (1.74%) Oracle
8 5 (1.45%) Foundry
8 5 (1.45%) HubSpot
9 3 (0.87%) Ahrefs
9 3 (0.87%) New Relic
9 3 (0.87%) Splunk
9 3 (0.87%) Workday
10 2 (0.58%) Alteryx
10 2 (0.58%) Facebook
10 2 (0.58%) Instagram
10 2 (0.58%) Mistral
10 2 (0.58%) TikTok