Google
UK

The table below provides summary statistics for permanent job vacancies requiring knowledge or experience of Google products and/or services. It includes a benchmarking guide to the annual salaries offered in vacancies that cited Google over the 6 months leading up to 23 October 2024, comparing them to the same period in the previous two years.

The figures below represent the IT labour market in general and are not representative of salaries within Google.

6 months to
23 Oct 2024
Same period 2023 Same period 2022
Rank 95 119 76
Rank change year-on-year +24 -43 -8
Permanent jobs citing Google 1,962 1,654 6,466
As % of all permanent jobs advertised in the UK 2.59% 2.78% 4.60%
As % of the Vendors category 8.03% 6.64% 11.56%
Number of salaries quoted 747 1,306 2,461
10th Percentile £31,550 £33,125 £32,500
25th Percentile £40,566 £43,359 £45,000
Median annual salary (50th Percentile) £60,000 £65,000 £61,180
Median % change year-on-year -7.69% +6.24% -5.88%
75th Percentile £81,250 £86,250 £82,500
90th Percentile £112,150 £104,375 £107,000
UK excluding London median annual salary £50,000 £57,500 £52,500
% change year-on-year -13.04% +9.52% +5.00%

All Vendors
UK

Google falls under the Vendor Products and Services category. For comparison with the information above, the following table provides summary statistics for all permanent job vacancies requiring knowledge or experience of all vendor products and services.

Permanent vacancies with a requirement for knowledge or experience of vendor products and services 24,446 24,905 55,942
As % of all permanent jobs advertised in the UK 32.31% 41.89% 39.81%
Number of salaries quoted 12,032 17,966 30,925
10th Percentile £31,250 £29,500 £31,000
25th Percentile £41,250 £40,000 £41,250
Median annual salary (50th Percentile) £57,000 £56,392 £56,500
Median % change year-on-year +1.08% -0.19% +2.73%
75th Percentile £76,000 £73,750 £77,500
90th Percentile £93,975 £91,250 £93,750
UK excluding London median annual salary £50,000 £50,000 £50,000
% change year-on-year - - +5.26%

Google
Job Vacancy Trend

Job postings citing Google as a proportion of all IT jobs advertised.
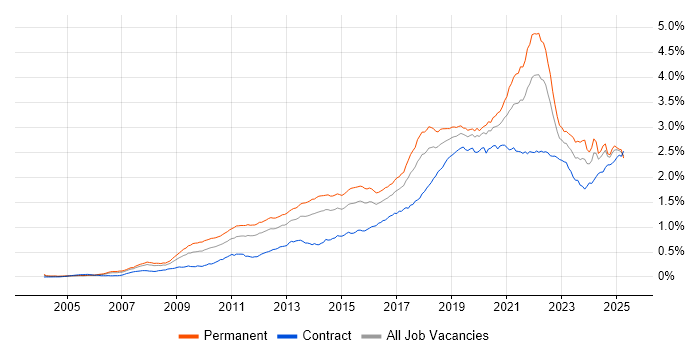
Job vacancy trend for Google in the UK

Google
Salary Trend

3-month moving average salary quoted in jobs citing Google.

Salary trend for Google in the UK

Google
Salary Histogram

Salary distribution for jobs citing Google over the 6 months to 23 October 2024.

Salary histogram for Google in the UK

Google
Top 18 Job Locations

The table below looks at the demand and provides a guide to the median salaries quoted in IT jobs citing Google within the UK over the 6 months to 23 October 2024. The 'Rank Change' column provides an indication of the change in demand within each location based on the same 6 month period last year.

Location Rank Change
on Same Period
Last Year
Matching
Permanent
IT Job Ads
Median Salary
Past 6 Months
Median Salary
% Change
on Same Period
Last Year
Live
Jobs
England +24 1,812 £62,500 -3.85% 1,285
Work from Home +38 1,034 £67,500 -4.36% 1,661
London +36 969 £75,000 -6.25% 265
UK excluding London +2 908 £50,000 -13.04% 1,045
North of England -45 205 £52,500 -19.23% 325
South West +3 186 £42,500 -16.64% 85
South East +56 185 £51,250 +2.50% 276
Midlands -7 147 £37,500 -31.82% 309
North West -16 140 £52,500 -16.00% 162
West Midlands -34 89 £36,000 -34.55% 142
Scotland -23 65 £50,000 -16.00% 12
East of England -21 64 £50,000 +42.86% 36
East Midlands +3 57 £47,500 -20.83% 167
Yorkshire -22 54 £45,000 -30.77% 132
Wales +50 35 £27,500 -21.43% 13
Northern Ireland +37 20 £69,308 +75.46% 6
North East -26 11 £69,308 +6.63% 32
Channel Islands - 1 £67,500 -

Google
Co-occurring Skills and Capabilities by Category

The follow tables expand on the table above by listing co-occurrences grouped by category. The same employment type, locality and period is covered with up to 20 co-occurrences shown in each of the following categories:

Application Platforms
1 84 (4.28%) Apache
2 65 (3.31%) Apache Airflow
3 57 (2.91%) Apache Spark
4 55 (2.80%) Confluence
5 51 (2.60%) WordPress
6 47 (2.40%) nginx
7 43 (2.19%) Microsoft Exchange
8 40 (2.04%) CMS
9 33 (1.68%) SharePoint
10 16 (0.82%) SharePoint 2010
10 16 (0.82%) SharePoint 2013
11 13 (0.66%) Apache Solr
12 8 (0.41%) Drupal
13 5 (0.25%) Luigi
14 4 (0.20%) Headless CMS
14 4 (0.20%) Oracle Application Server
15 3 (0.15%) SAS
15 3 (0.15%) Sitecore CMS
16 2 (0.10%) OpenStack
17 1 (0.051%) Adobe Experience Manager
Applications
1 93 (4.74%) Microsoft Excel
2 77 (3.92%) Microsoft Office
3 33 (1.68%) Microsoft PowerPoint
4 18 (0.92%) Photoshop
5 16 (0.82%) Adobe Creative Suite
6 10 (0.51%) Adobe XD
6 10 (0.51%) Spreadsheet
7 9 (0.46%) Adobe Illustrator
7 9 (0.46%) Elementor
8 6 (0.31%) InDesign
9 3 (0.15%) Acrobat
9 3 (0.15%) Adobe Premiere
10 2 (0.10%) Chatbot
10 2 (0.10%) Sketch
11 1 (0.051%) CapCut
11 1 (0.051%) Microsoft Project
11 1 (0.051%) MS Visio
11 1 (0.051%) Notion
11 1 (0.051%) Revit
11 1 (0.051%) UserZoom
Business Applications
1 14 (0.71%) Shopify
2 6 (0.31%) Magento
3 2 (0.10%) Dynamics CRM
3 2 (0.10%) PlanetPress Connect
4 1 (0.051%) Avolution ABACUS
4 1 (0.051%) iTrent
4 1 (0.051%) Payment Gateway
4 1 (0.051%) Remedy ITSM
4 1 (0.051%) Sprinklr
4 1 (0.051%) Workfront
Cloud Services
1 1,336 (68.09%) GCP
2 629 (32.06%) AWS
3 564 (28.75%) Azure
4 158 (8.05%) Google Analytics
5 139 (7.08%) Google Workspace
6 137 (6.98%) Microsoft 365
7 112 (5.71%) Cloud Computing
8 100 (5.10%) SaaS
9 76 (3.87%) GitHub
10 70 (3.57%) Power Platform
11 49 (2.50%) Google Ads
12 48 (2.45%) AWS CloudFormation
13 47 (2.40%) PaaS
14 44 (2.24%) Google Sheets
15 41 (2.09%) Snowflake
16 37 (1.89%) Google Tag Manager
16 37 (1.89%) Serverless
17 36 (1.83%) Amazon ECS
18 34 (1.73%) dbt
19 33 (1.68%) Google Data Studio
Communications & Networking
1 603 (30.73%) Broadband
2 100 (5.10%) Firewall
3 78 (3.98%) TCP/IP
4 69 (3.52%) DNS
5 51 (2.60%) LAN
6 50 (2.55%) DHCP
7 44 (2.24%) MQTT
7 44 (2.24%) WAN
8 37 (1.89%) HTTP
8 37 (1.89%) Internet
9 36 (1.83%) VPN
10 35 (1.78%) Wireshark
11 32 (1.63%) VLAN
12 24 (1.22%) WLAN
13 22 (1.12%) BGP
14 19 (0.97%) Modbus
14 19 (0.97%) OSPF
15 17 (0.87%) Wireless
16 15 (0.76%) Network Security
16 15 (0.76%) SSL
Database & Business Intelligence
1 491 (25.03%) Data Hub
2 152 (7.75%) BigQuery
3 106 (5.40%) PostgreSQL
4 100 (5.10%) Data Warehouse
5 95 (4.84%) Tableau
6 83 (4.23%) MySQL
7 69 (3.52%) Power BI
8 68 (3.47%) NoSQL
9 59 (3.01%) SQL Server
10 56 (2.85%) Looker
11 54 (2.75%) Big Data
11 54 (2.75%) Redis
12 53 (2.70%) Data Lake
13 44 (2.24%) MongoDB
14 40 (2.04%) Elasticsearch
15 37 (1.89%) Apache Ignite
16 28 (1.43%) Amazon RDS
16 28 (1.43%) Data Mart
16 28 (1.43%) Semantic Layer
17 23 (1.17%) Relational Database
Development Applications
1 130 (6.63%) Git
2 78 (3.98%) Jenkins
3 37 (1.89%) JIRA
4 34 (1.73%) Fiddler
5 29 (1.48%) GitLab
6 23 (1.17%) Cypress.io
7 19 (0.97%) MSI
8 18 (0.92%) Visual Studio Code
9 17 (0.87%) PHPUnit
10 16 (0.82%) Bitbucket
11 14 (0.71%) Spinnaker
12 12 (0.61%) Gradle
13 11 (0.56%) Maven
14 9 (0.46%) Sonatype Nexus
15 8 (0.41%) Selenium
15 8 (0.41%) TeamCity
16 6 (0.31%) Artifactory
16 6 (0.31%) webpack
17 5 (0.25%) JUnit
17 5 (0.25%) SonarQube
General
1 1,003 (51.12%) Social Skills
2 491 (25.03%) Influencing Skills
3 253 (12.90%) Marketing
4 242 (12.33%) Finance
5 230 (11.72%) Analytical Skills
6 207 (10.55%) Retail
7 130 (6.63%) Inclusion and Diversity
8 116 (5.91%) Advertising
9 72 (3.67%) Banking
10 50 (2.55%) Organisational Skills
11 43 (2.19%) Manufacturing
12 39 (1.99%) Games
13 38 (1.94%) Pharmaceutical
14 36 (1.83%) Legal
15 32 (1.63%) Law
15 32 (1.63%) Presentation Skills
16 30 (1.53%) Front Office
17 25 (1.27%) Public Sector
18 20 (1.02%) Automotive
19 17 (0.87%) Agriculture
Job Titles
1 753 (38.38%) Senior
2 664 (33.84%) Analyst
3 501 (25.54%) Senior Analyst
4 389 (19.83%) IT Analyst
5 381 (19.42%) Audit Analyst
6 225 (11.47%) Developer
7 159 (8.10%) Software Engineer
8 131 (6.68%) Lead
9 119 (6.07%) Architect
10 66 (3.36%) Data Engineer
11 62 (3.16%) Support Engineer
12 58 (2.96%) Data Analyst
13 54 (2.75%) Python Engineer
13 54 (2.75%) Senior Software Engineer
14 49 (2.50%) IT Support
14 49 (2.50%) Senior Developer
15 48 (2.45%) Cloud Engineer
15 48 (2.45%) IT Engineer
16 47 (2.40%) Python Developer
17 45 (2.29%) Lead Software Engineer
Libraries, Frameworks & Software Standards
1 230 (11.72%) HTML
2 215 (10.96%) CSS
3 164 (8.36%) React
4 107 (5.45%) REST
5 88 (4.49%) Node.js
6 82 (4.18%) XML
7 74 (3.77%) AngularJS
8 64 (3.26%) .NET
9 55 (2.80%) JSON
10 53 (2.70%) RESTful
11 52 (2.65%) Kafka
12 43 (2.19%) CSS3
13 41 (2.09%) gRPC
13 41 (2.09%) Web Services
14 40 (2.04%) GraphQL
15 39 (1.99%) Django
16 35 (1.78%) .NET Core
16 35 (1.78%) Material-UI
16 35 (1.78%) Redux
17 33 (1.68%) Vue
Miscellaneous
1 121 (6.17%) Social Media
2 90 (4.59%) Management Information System
3 77 (3.92%) Distributed Systems
4 72 (3.67%) Onboarding
5 71 (3.62%) Self-Motivation
6 66 (3.36%) Cloud Native
6 66 (3.36%) Public Cloud
7 65 (3.31%) Mobile App
8 50 (2.55%) IoT
9 45 (2.29%) Cyber Threat
10 39 (1.99%) Product Ownership
11 38 (1.94%) Algorithms
12 36 (1.83%) Blog
13 30 (1.53%) Fixed Income
13 30 (1.53%) Hedge funds
14 29 (1.48%) Data Centre
14 29 (1.48%) Smartphone
15 24 (1.22%) Digital Media
15 24 (1.22%) Equities
16 17 (0.87%) Data Structures
Operating Systems
1 186 (9.48%) Windows
2 157 (8.00%) Linux
3 85 (4.33%) Windows Server
4 59 (3.01%) Android
5 46 (2.34%) Windows 10
6 41 (2.09%) Ubuntu
7 39 (1.99%) Unix
8 35 (1.78%) Apple iOS
9 29 (1.48%) Mac OS
10 28 (1.43%) Windows Server 2016
11 25 (1.27%) Windows Server 2019
12 22 (1.12%) Mac OS X
13 16 (0.82%) Red Hat Enterprise Linux
14 14 (0.71%) CentOS
15 9 (0.46%) Windows Server 2012
16 8 (0.41%) Debian
17 5 (0.25%) Oracle Linux
17 5 (0.25%) Solaris
17 5 (0.25%) VMS
18 4 (0.20%) Kali Linux
Processes & Methodologies
1 804 (40.98%) Problem-Solving
2 761 (38.79%) Analytics
3 581 (29.61%) Continuous Improvement
4 549 (27.98%) Data Governance
5 546 (27.83%) Customer Experience
6 514 (26.20%) Data Management
7 513 (26.15%) Data Transformation
8 447 (22.78%) Data Analysis
9 382 (19.47%) IT Audit
10 346 (17.64%) Agile
11 269 (13.71%) Software Engineering
12 253 (12.90%) DevOps
13 234 (11.93%) CI/CD
14 169 (8.61%) Mentoring
15 166 (8.46%) Computer Science
16 156 (7.95%) Microservices
17 140 (7.14%) Machine Learning
18 134 (6.83%) Roadmaps
19 133 (6.78%) Infrastructure as Code
20 132 (6.73%) Artificial Intelligence
Programming Languages
1 435 (22.17%) Python
2 327 (16.67%) SQL
3 263 (13.40%) JavaScript
4 207 (10.55%) Java
5 100 (5.10%) TypeScript
6 94 (4.79%) PHP
7 81 (4.13%) Bash
8 74 (3.77%) Scala
9 67 (3.41%) Go
9 67 (3.41%) PowerShell
10 56 (2.85%) C#
11 52 (2.65%) R
12 47 (2.40%) Kotlin
13 34 (1.73%) C++
14 24 (1.22%) Rust
15 20 (1.02%) C
16 14 (0.71%) Objective-C
17 12 (0.61%) XAML
18 11 (0.56%) Ruby
19 8 (0.41%) Perl
Qualifications
1 481 (24.52%) CISA
2 297 (15.14%) Degree
3 101 (5.15%) Computer Science Degree
4 98 (4.99%) Security Cleared
5 82 (4.18%) SC Cleared
6 78 (3.98%) Microsoft Certification
7 70 (3.57%) DBS Check
8 45 (2.29%) Azure Certification
9 44 (2.24%) Master's Degree
10 39 (1.99%) AWS Certification
11 38 (1.94%) MCSE
12 26 (1.33%) HND
13 23 (1.17%) MCITP
14 20 (1.02%) AWS Certified Solutions Architect
15 19 (0.97%) HNC
16 15 (0.76%) A+ Certification
16 15 (0.76%) Network+ Certification
17 14 (0.71%) PhD
17 14 (0.71%) PMI Certification
18 13 (0.66%) PMP
Quality Assurance & Compliance
1 484 (24.67%) Sarbanes-Oxley
2 103 (5.25%) QA
3 53 (2.70%) Data Quality
4 45 (2.29%) Accessibility
5 32 (1.63%) GDPR
6 25 (1.27%) ISO/IEC 27001
7 18 (0.92%) PCI DSS
8 10 (0.51%) Cyber Essentials
8 10 (0.51%) HIPAA
9 8 (0.41%) COBIT
9 8 (0.41%) SLA
10 7 (0.36%) GLP
10 7 (0.36%) NIST
11 6 (0.31%) Cyber Essentials PLUS
12 5 (0.25%) ISO 9001
13 4 (0.20%) PMO
13 4 (0.20%) SOC 2
14 3 (0.15%) Actionable Recommendations
14 3 (0.15%) GxP
15 2 (0.10%) IFRS
System Software
1 206 (10.50%) Docker
2 119 (6.07%) Active Directory
3 67 (3.41%) VMware Infrastructure
4 56 (2.85%) Hyper-V
5 31 (1.58%) Virtual Machines
6 25 (1.27%) XenDesktop
7 24 (1.22%) XenApp
8 10 (0.51%) VMware NSX
9 7 (0.36%) Firmware
9 7 (0.36%) vSphere
10 5 (0.25%) HDFS
10 5 (0.25%) KVM
10 5 (0.25%) VMware Workstation
11 2 (0.10%) Virtual Desktop
11 2 (0.10%) VMware Server
12 1 (0.051%) Ceph
12 1 (0.051%) Embedded Firmware
12 1 (0.051%) Gluster
12 1 (0.051%) Lustre
12 1 (0.051%) VMware ESXi
Systems Management
1 187 (9.53%) Kubernetes
2 182 (9.28%) Terraform
3 95 (4.84%) Ansible
4 33 (1.68%) Microsoft Intune
5 30 (1.53%) Puppet
6 29 (1.48%) SCCM
7 21 (1.07%) Prometheus
8 19 (0.97%) Grafana
8 19 (0.97%) Istio
9 16 (0.82%) Argo
9 16 (0.82%) Single Sign-On
10 15 (0.76%) Progress Chef
11 14 (0.71%) Nagios
12 12 (0.61%) Jamf Pro
13 10 (0.51%) FortiGate
14 9 (0.46%) CASB
15 8 (0.41%) cPanel
16 4 (0.20%) Nessus
16 4 (0.20%) Nmap
16 4 (0.20%) Proxmox
Vendors
1 420 (21.41%) Microsoft
2 92 (4.69%) Apple
3 86 (4.38%) VMware
4 68 (3.47%) Cisco
5 49 (2.50%) Splunk
6 48 (2.45%) Adobe
7 44 (2.24%) Databricks
8 41 (2.09%) Dell
9 34 (1.73%) Salesforce
10 33 (1.68%) Oracle
11 29 (1.48%) Citrix
11 29 (1.48%) HP
12 24 (1.22%) SAP
13 21 (1.07%) Facebook
13 21 (1.07%) Symantec
14 20 (1.02%) Fortinet
15 19 (0.97%) Okta
15 19 (0.97%) Ubiquiti
16 18 (0.92%) Dynatrace
16 18 (0.92%) Screaming Frog