Low-Code
UK
The table below looks at the prevalence of the term Low-Code in permanent job vacancies. Included is a benchmarking guide to the salaries offered in vacancies that cited Low-Code over the 6 months leading up to 21 May 2025, comparing them to the same period in the previous two years.
| 6 months to 21 May 2025 |
Same period 2024 | Same period 2023 | |
|---|---|---|---|
| Rank | 631 | 628 | 676 |
| Rank change year-on-year | -3 | +48 | +80 |
| Permanent jobs citing Low-Code | 87 | 265 | 310 |
| As % of all permanent jobs advertised in the UK | 0.16% | 0.27% | 0.31% |
| As % of the Miscellaneous category | 0.42% | 0.75% | 0.72% |
| Number of salaries quoted | 63 | 211 | 214 |
| 10th Percentile | £43,750 | £32,625 | £35,713 |
| 25th Percentile | £52,500 | £44,768 | £52,000 |
| Median annual salary (50th Percentile) | £65,000 | £60,000 | £70,000 |
| Median % change year-on-year | +8.33% | -14.29% | +27.27% |
| 75th Percentile | £82,875 | £75,000 | £92,188 |
| 90th Percentile | £107,000 | £95,000 | £102,500 |
| UK excluding London median annual salary | £68,750 | £57,500 | £50,000 |
| % change year-on-year | +19.57% | +15.00% | +11.11% |
All Generic Skills
UK
Low-Code falls under the General and Transferable Skills category. For comparison with the information above, the following table provides summary statistics for all permanent job vacancies requiring generic IT skills.
| Permanent vacancies with a requirement for generic IT skills | 20,720 | 35,284 | 43,140 |
| As % of all permanent jobs advertised in the UK | 37.08% | 35.31% | 43.37% |
| Number of salaries quoted | 9,777 | 23,033 | 23,186 |
| 10th Percentile | £31,250 | £28,000 | £35,483 |
| 25th Percentile | £42,500 | £38,000 | £46,250 |
| Median annual salary (50th Percentile) | £60,000 | £55,000 | £65,000 |
| Median % change year-on-year | +9.09% | -15.38% | +4.00% |
| 75th Percentile | £78,750 | £75,000 | £86,250 |
| 90th Percentile | £110,000 | £97,500 | £109,865 |
| UK excluding London median annual salary | £54,793 | £50,000 | £55,000 |
| % change year-on-year | +9.59% | -9.09% | +4.76% |
Low-Code
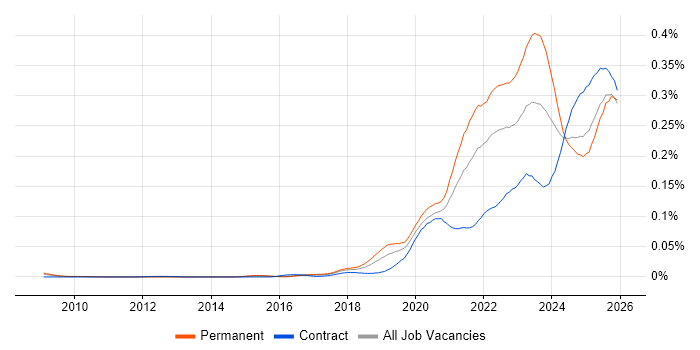
Job Vacancy Trend
Job postings citing Low-Code as a proportion of all IT jobs advertised.

Low-Code
Salary Trend
3-month moving average salary quoted in jobs citing Low-Code.
Low-Code
Salary Histogram
Salary distribution for jobs citing Low-Code over the 6 months to 21 May 2025.
Low-Code
Top 15 Job Locations
The table below looks at the demand and provides a guide to the median salaries quoted in IT jobs citing Low-Code within the UK over the 6 months to 21 May 2025. The 'Rank Change' column provides an indication of the change in demand within each location based on the same 6 month period last year.
| Location | Rank Change on Same Period Last Year |
Matching Permanent IT Job Ads |
Median Salary Past 6 Months |
Median Salary % Change on Same Period Last Year |
Live Jobs |
|---|---|---|---|---|---|
| England | +1 | 76 | £67,500 | +12.50% | 243 |
| London | +104 | 39 | £70,000 | -10.83% | 130 |
| UK excluding London | +18 | 36 | £68,750 | +19.57% | 174 |
| Work from Home | +17 | 35 | £61,250 | +2.08% | 163 |
| Midlands | +28 | 11 | £66,250 | +10.42% | 26 |
| North of England | +5 | 10 | £77,250 | +34.35% | 50 |
| West Midlands | +26 | 9 | £65,000 | +8.33% | 16 |
| South East | +41 | 6 | £54,750 | +15.26% | 43 |
| Yorkshire | +54 | 5 | £76,000 | +49.75% | 13 |
| North West | -16 | 5 | £110,000 | +15.79% | 32 |
| Scotland | +118 | 4 | £47,500 | -2.56% | 21 |
| South West | +107 | 2 | £80,000 | +45.45% | 12 |
| East Midlands | +35 | 2 | £82,500 | +40.43% | 9 |
| East of England | +26 | 2 | £71,500 | +24.35% | 12 |
| Wales | +40 | 1 | £50,000 | -28.57% | 2 |
Low-Code
Co-occurring Skills and Capabilities by Category
The follow tables expand on the table above by listing co-occurrences grouped by category. The same employment type, locality and period is covered with up to 20 co-occurrences shown in each of the following categories:
|
|
||||||||||||||||||||||||||||||||||||||||||||||||||||||||||||||||||||||||||||||||||||||||||||||||||||||||||||||||||||||||||||||
|
|
||||||||||||||||||||||||||||||||||||||||||||||||||||||||||||||||||||||||||||||||||||||||||||||||||||||||||||||||||||||||||||||
|
|
||||||||||||||||||||||||||||||||||||||||||||||||||||||||||||||||||||||||||||||||||||||||||||||||||||||||||||||||||||||||||||||
|
|
||||||||||||||||||||||||||||||||||||||||||||||||||||||||||||||||||||||||||||||||||||||||||||||||||||||||||||||||||||||||||||||
|
|
||||||||||||||||||||||||||||||||||||||||||||||||||||||||||||||||||||||||||||||||||||||||||||||||||||||||||||||||||||||||||||||
|
|
||||||||||||||||||||||||||||||||||||||||||||||||||||||||||||||||||||||||||||||||||||||||||||||||||||||||||||||||||||||||||||||
|
|
||||||||||||||||||||||||||||||||||||||||||||||||||||||||||||||||||||||||||||||||||||||||||||||||||||||||||||||||||||||||||||||
|
|
||||||||||||||||||||||||||||||||||||||||||||||||||||||||||||||||||||||||||||||||||||||||||||||||||||||||||||||||||||||||||||||
|
|
||||||||||||||||||||||||||||||||||||||||||||||||||||||||||||||||||||||||||||||||||||||||||||||||||||||||||||||||||||||||||||||
|
|||||||||||||||||||||||||||||||||||||||||||||||||||||||||||||||||||||||||||||||||||||||||||||||||||||||||||||||||||||||||||||||
