Microsoft Certified Professional (MCP)
UK

The following table provides summary statistics for permanent job vacancies with a requirement for MCP qualifications. Included is a benchmarking guide to the salaries offered over the 6 months to 30 November 2023 with a comparison to the same period in the previous 2 years.

6 months to
30 Nov 2023
Same period 2022 Same period 2021
Rank 608 891 774
Rank change year-on-year +283 -117 -188
Permanent jobs citing MCP 119 200 335
As % of all permanent jobs advertised in the UK 0.22% 0.16% 0.26%
As % of the Qualifications category 0.68% 0.54% 1.04%
Number of salaries quoted 102 185 222
10th Percentile £28,550 £24,600 £21,250
25th Percentile £32,550 £28,500 £25,906
Median annual salary (50th Percentile) £37,500 £35,000 £32,000
Median % change year-on-year +7.14% +9.38% -8.57%
75th Percentile £53,438 £50,000 £44,688
90th Percentile £67,200 £57,500 £57,460
UK excluding London median annual salary £37,500 £35,000 £30,000
% change year-on-year +7.14% +16.67% -13.22%

All Academic and Professional Certifications
UK

MCP is in the Academic Qualifications and Professional Certifications category. The following table is for comparison with the above and provides summary statistics for all permanent job vacancies with a requirement for academic qualifications or professional certifications.

Permanent vacancies requiring academic qualifications or professional certifications 17,523 37,320 32,078
As % of all permanent jobs advertised in the UK 32.54% 29.53% 24.78%
Number of salaries quoted 10,978 17,212 17,882
10th Percentile £31,250 £31,250 £31,250
25th Percentile £42,102 £41,250 £40,853
Median annual salary (50th Percentile) £57,500 £57,000 £55,000
Median % change year-on-year +0.88% +3.64% -
75th Percentile £75,000 £76,250 £72,500
90th Percentile £92,500 £93,750 £90,000
UK excluding London median annual salary £52,500 £50,000 £49,590
% change year-on-year +5.00% +0.83% +1.20%

MCP
Job Vacancy Trend

Job postings citing MCP as a proportion of all IT jobs advertised.
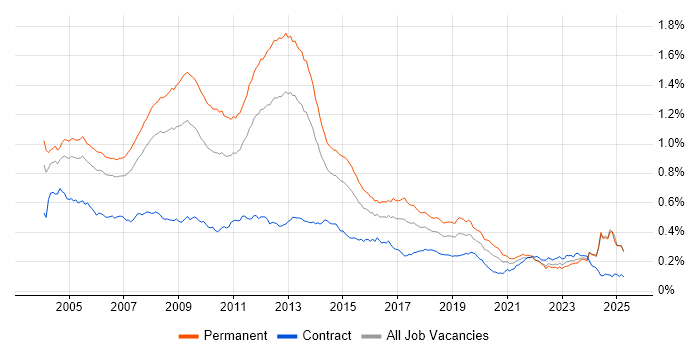
Job vacancy trend for MCP in the UK

MCP
Salary Trend

3-month moving average salary quoted in jobs citing MCP.

Salary trend for MCP in the UK

MCP
Salary Histogram

Salary distribution for jobs citing MCP over the 6 months to 30 November 2023.

Salary histogram for MCP in the UK

MCP
Top 16 Job Locations

The table below looks at the demand and provides a guide to the median salaries quoted in IT jobs citing MCP within the UK over the 6 months to 30 November 2023. The 'Rank Change' column provides an indication of the change in demand within each location based on the same 6 month period last year.

Location Rank Change
on Same Period
Last Year
Matching
Permanent
IT Job Ads
Median Salary
Past 6 Months
Median Salary
% Change
on Same Period
Last Year
Live
Jobs
England +246 109 £37,500 +7.14% 71
UK excluding London +184 81 £37,500 +7.14% 63
Work from Home +278 44 £47,500 +28.38% 28
London +259 34 £36,500 -14.12% 12
South West +91 26 £37,500 +7.14% 8
North of England +143 15 £31,500 +3.28% 12
Midlands +127 15 £37,500 -11.76% 10
South East +105 14 £55,013 +57.18% 15
Yorkshire +89 10 £32,000 +26.66% 6
West Midlands +129 8 £35,745 -18.30% 4
East Midlands +57 7 £52,500 +23.53% 6
North West +96 5 £31,000 -2.92% 3
East of England +123 4 £42,250 +20.71% 17
Wales +15 4 £35,250 +8.46%
Isle of Man - 2 £72,500 -
Northern Ireland +37 1 £35,000 -6.67% 1

MCP
Co-occurring Skills and Capabilities by Category

The follow tables expand on the table above by listing co-occurrences grouped by category. The same employment type, locality and period is covered with up to 20 co-occurrences shown in each of the following categories:

Application Platforms
1 28 (23.53%) SharePoint
2 9 (7.56%) MS Exchange
3 6 (5.04%) Apache
4 5 (4.20%) IIS
5 2 (1.68%) Skype for Business
6 1 (0.84%) nginx
Applications
1 14 (11.76%) Microsoft Office
2 5 (4.20%) Microsoft Excel
3 4 (3.36%) Microsoft PowerPoint
Business Applications
1 3 (2.52%) Payment Gateway
2 1 (0.84%) Dynamics NAV
2 1 (0.84%) Fidessa
2 1 (0.84%) PlanetPress Connect
Cloud Services
1 72 (60.50%) Microsoft 365
2 57 (47.90%) Azure
3 16 (13.45%) Nutanix
4 12 (10.08%) OneDrive
5 10 (8.40%) Entra ID
6 9 (7.56%) AWS
7 8 (6.72%) Rubrik
8 7 (5.88%) WhatsApp
9 4 (3.36%) PaaS
9 4 (3.36%) SaaS
10 1 (0.84%) Cloud Computing
10 1 (0.84%) Google Workspace
10 1 (0.84%) Power Automate
10 1 (0.84%) Power Platform
10 1 (0.84%) PowerApps
Communications & Networking
1 43 (36.13%) Firewall
2 34 (28.57%) WAN
3 31 (26.05%) Wi-Fi
4 30 (25.21%) DNS
5 22 (18.49%) DHCP
5 22 (18.49%) TCP/IP
6 20 (16.81%) LAN
7 14 (11.76%) Cisco ASA
7 14 (11.76%) SD-WAN
8 10 (8.40%) VPN
8 10 (8.40%) Wireless
9 8 (6.72%) Remote Desktop
10 7 (5.88%) Network Security
11 5 (4.20%) BGP
11 5 (4.20%) OSPF
11 5 (4.20%) RIP
12 3 (2.52%) Internet
13 2 (1.68%) Ethernet
13 2 (1.68%) Skype
13 2 (1.68%) VoIP
Database & Business Intelligence
1 10 (8.40%) SQL Server
2 4 (3.36%) RDBMS
2 4 (3.36%) Relational Database
3 1 (0.84%) Data Warehouse
Development Applications
1 2 (1.68%) Git
2 1 (0.84%) Visual Studio
General
1 39 (32.77%) Social Skills
2 21 (17.65%) Finance
3 15 (12.61%) Public Sector
4 12 (10.08%) Legal
5 8 (6.72%) Analytical Skills
5 8 (6.72%) Inclusion and Diversity
6 4 (3.36%) Law
7 3 (2.52%) Manufacturing
8 2 (1.68%) Advertising
8 2 (1.68%) Banking
8 2 (1.68%) Documentation Skills
8 2 (1.68%) Military
8 2 (1.68%) Organisational Skills
9 1 (0.84%) Fire and Rescue
9 1 (0.84%) Games
9 1 (0.84%) Local Government
9 1 (0.84%) Presentation Skills
Job Titles
1 24 (20.17%) Infrastructure Engineer
2 23 (19.33%) Support Engineer
3 16 (13.45%) Analyst
4 15 (12.61%) Senior
5 14 (11.76%) 3rd Line Engineer
6 12 (10.08%) 2nd Line Support
6 12 (10.08%) IT Engineer
6 12 (10.08%) Support Analyst
7 9 (7.56%) 2nd Line Engineer
7 9 (7.56%) Software Support Engineer
8 8 (6.72%) 3rd Line Infrastructure Engineer
8 8 (6.72%) Consultant
8 8 (6.72%) IT Support
9 7 (5.88%) 3rd Line Support
9 7 (5.88%) IT Technician
10 6 (5.04%) 2nd Line Support Engineer
10 6 (5.04%) 3rd Line Support Engineer
10 6 (5.04%) IT Infrastructure Engineer
10 6 (5.04%) IT Support Engineer
10 6 (5.04%) Support Consultant
Libraries, Frameworks & Software Standards
1 6 (5.04%) Apache NiFi
1 6 (5.04%) Kafka
2 3 (2.52%) .NET
2 3 (2.52%) CSS
2 3 (2.52%) HTML
2 3 (2.52%) Middleware
3 1 (0.84%) .NET Core
3 1 (0.84%) .NET Framework
3 1 (0.84%) ASP.NET
3 1 (0.84%) ASP.NET Core
3 1 (0.84%) ASP.NET MVC
3 1 (0.84%) ASP.NET Web API
3 1 (0.84%) FIX Protocol
3 1 (0.84%) RabbitMQ
3 1 (0.84%) WCF
3 1 (0.84%) XSLT
Miscellaneous
1 19 (15.97%) Data Centre
2 11 (9.24%) Self-Motivation
3 8 (6.72%) Management Information System
4 6 (5.04%) Driving Licence
4 6 (5.04%) Onboarding
5 2 (1.68%) Replication
6 1 (0.84%) Enterprise Software
6 1 (0.84%) Eurex
6 1 (0.84%) iPad
6 1 (0.84%) iPhone
6 1 (0.84%) SCADA
6 1 (0.84%) Smartphone
6 1 (0.84%) Virtual Team
Operating Systems
1 76 (63.87%) Windows
2 38 (31.93%) Windows Server
3 29 (24.37%) Windows 10
4 18 (15.13%) Windows Server 2019
5 14 (11.76%) Linux
5 14 (11.76%) Windows 7
6 11 (9.24%) Windows Server 2012
7 10 (8.40%) Windows Server 2016
8 8 (6.72%) Windows Server 2008
9 7 (5.88%) Windows 8
10 6 (5.04%) Windows Server 2003
11 3 (2.52%) Mac OS
11 3 (2.52%) Unix
12 2 (1.68%) Android
12 2 (1.68%) Apple iOS
12 2 (1.68%) Mac OS X
13 1 (0.84%) Solaris
13 1 (0.84%) Ubuntu
13 1 (0.84%) Windows XP
Processes & Methodologies
1 40 (33.61%) ITIL
2 34 (28.57%) Customer Service
3 26 (21.85%) Problem-Solving
4 24 (20.17%) Infrastructure Engineering
5 14 (11.76%) Budget Management
6 12 (10.08%) Asset Management
7 11 (9.24%) Disaster Recovery
8 10 (8.40%) Network Management
9 9 (7.56%) Service Delivery
10 8 (6.72%) Cybersecurity
10 8 (6.72%) Problem Management
11 7 (5.88%) Containerisation
11 7 (5.88%) CRM
11 7 (5.88%) IT Strategy
12 6 (5.04%) Decision-Making
12 6 (5.04%) Information Security
12 6 (5.04%) Open Source
12 6 (5.04%) Root Cause Analysis
13 5 (4.20%) Data Analysis
13 5 (4.20%) Project Management
Programming Languages
1 14 (11.76%) PowerShell
2 13 (10.92%) SQL
3 3 (2.52%) C#
3 3 (2.52%) PHP
3 3 (2.52%) Shell Script
4 1 (0.84%) Python
4 1 (0.84%) VB
4 1 (0.84%) VB.NET
Qualifications
1 93 (78.15%) Microsoft Certification
2 53 (44.54%) MCSE
3 30 (25.21%) CCNA
3 30 (25.21%) Cisco Certification
3 30 (25.21%) Degree
4 23 (19.33%) MCSA
5 22 (18.49%) CCNP
6 16 (13.45%) Security Cleared
7 14 (11.76%) A+ Certification
8 13 (10.92%) DV Cleared
9 11 (9.24%) MCTS
10 10 (8.40%) SC Cleared
11 4 (3.36%) CISM
11 4 (3.36%) CISSP
11 4 (3.36%) CRISC
11 4 (3.36%) Network+ Certification
12 3 (2.52%) MCITP
12 3 (2.52%) VMware Certified Professional (VCP)
13 2 (1.68%) CCENT
13 2 (1.68%) ECDL
Quality Assurance & Compliance
1 20 (16.81%) SLA
2 13 (10.92%) Cyber Essentials
3 7 (5.88%) GDPR
4 2 (1.68%) Data Quality
System Software
1 67 (56.30%) Active Directory
2 15 (12.61%) VMware Infrastructure
3 12 (10.08%) vSphere
4 10 (8.40%) Hyper-V
5 8 (6.72%) VMware ESXi
6 7 (5.88%) Docker
7 6 (5.04%) Firmware
8 5 (4.20%) VMware NSX
9 1 (0.84%) BitLocker
9 1 (0.84%) Terminal Services
9 1 (0.84%) Virtual Machines
Systems Management
1 27 (22.69%) Microsoft Intune
2 25 (21.01%) SCCM
3 13 (10.92%) FortiGate
4 7 (5.88%) Kubernetes
4 7 (5.88%) WSUS
5 6 (5.04%) Ansible
5 6 (5.04%) Consul
5 6 (5.04%) Terraform
6 4 (3.36%) QRadar
7 2 (1.68%) Demisto
7 2 (1.68%) Jamf Pro
7 2 (1.68%) vCenter Server
8 1 (0.84%) Avamar
8 1 (0.84%) Failover Clustering
8 1 (0.84%) Microsoft Clustering
Vendors
1 99 (83.19%) Microsoft
2 35 (29.41%) VMware
3 25 (21.01%) Cisco
4 16 (13.45%) Citrix
5 14 (11.76%) Meraki
6 13 (10.92%) CheckPoint
7 9 (7.56%) HP
8 8 (6.72%) Avaya
8 8 (6.72%) Dell
9 7 (5.88%) Apple
9 7 (5.88%) Veeam
10 6 (5.04%) F5
10 6 (5.04%) Google
10 6 (5.04%) Infoblox
10 6 (5.04%) Juniper
10 6 (5.04%) Mellanox
10 6 (5.04%) Palo Alto
10 6 (5.04%) Ubiquiti
11 5 (4.20%) Aruba
12 4 (3.36%) Oracle