Automation Engineer
UK
The median Automation Engineer salary in the UK is £67,500 per year, according to job vacancies posted during the 6 months leading to 1 May 2025.
The table below provides salary benchmarking and summary statistics, comparing them to the same period in the previous two years.
| 6 months to 1 May 2025 |
Same period 2024 | Same period 2023 | |
|---|---|---|---|
| Rank | 501 | 635 | 694 |
| Rank change year-on-year | +134 | +59 | +4 |
| Permanent jobs requiring an Automation Engineer | 193 | 266 | 298 |
| As % of all permanent jobs advertised in the UK | 0.37% | 0.27% | 0.29% |
| As % of the Job Titles category | 0.41% | 0.29% | 0.31% |
| Number of salaries quoted | 107 | 146 | 220 |
| 10th Percentile | £47,000 | £24,000 | £43,750 |
| 25th Percentile | £53,750 | £31,250 | £47,500 |
| Median annual salary (50th Percentile) | £67,500 | £50,000 | £57,500 |
| Median % change year-on-year | +35.00% | -13.04% | - |
| 75th Percentile | £90,000 | £67,500 | £74,136 |
| 90th Percentile | £97,500 | £77,500 | £97,500 |
| UK excluding London median annual salary | £55,000 | £45,000 | £50,000 |
| % change year-on-year | +22.22% | -10.00% | -4.76% |
All Permanent IT Job Vacancies
UK
For comparison with the information above, the following table provides summary statistics for all permanent IT job vacancies. Most job vacancies include a discernible job title that can be normalized. As such, the figures in the second row provide an indication of the number of permanent jobs in our overall sample.
| Permanent vacancies in the UK with a recognized job title | 46,902 | 93,183 | 95,132 |
| % of permanent jobs with a recognized job title | 90.12% | 94.62% | 91.53% |
| Number of salaries quoted | 27,275 | 66,883 | 59,840 |
| 10th Percentile | £30,000 | £28,500 | £32,500 |
| 25th Percentile | £42,000 | £38,500 | £45,000 |
| Median annual salary (50th Percentile) | £57,500 | £52,777 | £60,000 |
| Median % change year-on-year | +8.95% | -12.04% | - |
| 75th Percentile | £75,000 | £71,250 | £81,250 |
| 90th Percentile | £97,500 | £90,000 | £100,000 |
| UK excluding London median annual salary | £52,000 | £50,000 | £52,500 |
| % change year-on-year | +4.00% | -4.76% | +5.00% |
Automation Engineer
Job Vacancy Trend
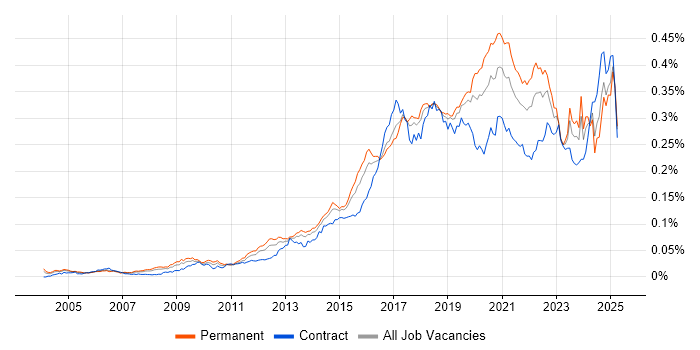
Job postings that featured Automation Engineer in the job title as a proportion of all IT jobs advertised.

Automation Engineer
Salary Trend
3-month moving average salary quoted in jobs citing Automation Engineer.
Automation Engineer
Salary Histogram
Salary distribution for jobs citing Automation Engineer over the 6 months to 1 May 2025.
Automation Engineer
Top 15 Job Locations
The table below looks at the demand and provides a guide to the median salaries quoted in IT jobs citing Automation Engineer within the UK over the 6 months to 1 May 2025. The 'Rank Change' column provides an indication of the change in demand within each location based on the same 6 month period last year.
| Location | Rank Change on Same Period Last Year |
Matching Permanent IT Job Ads |
Median Salary Past 6 Months |
Median Salary % Change on Same Period Last Year |
Live Jobs |
|---|---|---|---|---|---|
| England | +223 | 185 | £67,500 | +35.00% | 208 |
| UK excluding London | +165 | 127 | £55,000 | +22.22% | 193 |
| London | +132 | 64 | £90,000 | +20.00% | 54 |
| North of England | +108 | 41 | £80,000 | +150.00% | 45 |
| Yorkshire | +109 | 39 | £58,750 | -26.56% | 22 |
| Work from Home | +190 | 38 | £71,991 | -4.01% | 94 |
| Midlands | +92 | 35 | £65,000 | +62.50% | 33 |
| West Midlands | +52 | 21 | £67,500 | +80.00% | 13 |
| East of England | +73 | 20 | £55,000 | +22.22% | 28 |
| East Midlands | +58 | 14 | £52,000 | +4.00% | 20 |
| South West | +108 | 13 | £52,500 | +75.00% | 20 |
| South East | +91 | 12 | £70,000 | +40.00% | 39 |
| Northern Ireland | +33 | 5 | - | - | 4 |
| North West | +22 | 2 | £90,000 | +275.00% | 20 |
| Wales | -23 | 1 | - | - | 9 |
Automation Engineer Skill Set
Top 30 Co-occurring Skills and Capabilities
For the 6 months to 1 May 2025, Automation Engineer job roles required the following skills and capabilities in order of popularity. The figures indicate the absolute number co-occurrences and as a proportion of all permanent job ads featuring Automation Engineer in the job title.
|
|
Automation Engineer Skill Set
Co-occurring Skills and Capabilities by Category
The follow tables expand on the table above by listing co-occurrences grouped by category. The same employment type, locality and period is covered with up to 20 co-occurrences shown in each of the following categories:
|
|
||||||||||||||||||||||||||||||||||||||||||||||||||||||||||||||||||||||||||||||||||||||||||||||||||||||||||||||||||||||||||||||
|
|
||||||||||||||||||||||||||||||||||||||||||||||||||||||||||||||||||||||||||||||||||||||||||||||||||||||||||||||||||||||||||||||
|
|
||||||||||||||||||||||||||||||||||||||||||||||||||||||||||||||||||||||||||||||||||||||||||||||||||||||||||||||||||||||||||||||
|
|
||||||||||||||||||||||||||||||||||||||||||||||||||||||||||||||||||||||||||||||||||||||||||||||||||||||||||||||||||||||||||||||
|
|
||||||||||||||||||||||||||||||||||||||||||||||||||||||||||||||||||||||||||||||||||||||||||||||||||||||||||||||||||||||||||||||
|
|
||||||||||||||||||||||||||||||||||||||||||||||||||||||||||||||||||||||||||||||||||||||||||||||||||||||||||||||||||||||||||||||
|
|
||||||||||||||||||||||||||||||||||||||||||||||||||||||||||||||||||||||||||||||||||||||||||||||||||||||||||||||||||||||||||||||
|
|
||||||||||||||||||||||||||||||||||||||||||||||||||||||||||||||||||||||||||||||||||||||||||||||||||||||||||||||||||||||||||||||
|
|||||||||||||||||||||||||||||||||||||||||||||||||||||||||||||||||||||||||||||||||||||||||||||||||||||||||||||||||||||||||||||||
