Extract, Transform and Load (ETL)
UK

The following table provides summary statistics for permanent job vacancies with a requirement for ETL skills. Included is a benchmarking guide to the salaries offered in vacancies that have cited ETL over the 6 months to 30 November 2023 with a comparison to the same period in the previous 2 years.

6 months to
30 Nov 2023
Same period 2022 Same period 2021
Rank 120 125 124
Rank change year-on-year +5 -1 +2
Permanent jobs citing ETL 1,468 3,591 3,855
As % of all permanent jobs advertised in the UK 2.73% 2.84% 2.98%
As % of the Processes & Methodologies category 2.90% 2.97% 3.12%
Number of salaries quoted 1,158 2,576 2,822
10th Percentile £41,240 £42,500 £40,000
25th Percentile £48,750 £51,000 £46,250
Median annual salary (50th Percentile) £62,500 £65,000 £60,000
Median % change year-on-year -3.85% +8.33% +9.09%
75th Percentile £84,056 £82,970 £77,500
90th Percentile £100,000 £96,250 £91,250
UK excluding London median annual salary £55,000 £55,000 £50,000
% change year-on-year - +10.00% +5.26%

All Process and Methodology Skills
UK

ETL is in the Processes and Methodologies category. The following table is for comparison with the above and provides summary statistics for all permanent job vacancies with a requirement for process or methodology skills.

Permanent vacancies with a requirement for process or methodology skills 50,664 120,987 123,563
As % of all permanent jobs advertised in the UK 94.08% 95.74% 95.44%
Number of salaries quoted 36,731 73,454 82,144
10th Percentile £32,500 £34,347 £32,500
25th Percentile £43,750 £45,000 £42,500
Median annual salary (50th Percentile) £60,000 £60,000 £59,500
Median % change year-on-year - +0.84% +8.18%
75th Percentile £80,000 £81,250 £77,500
90th Percentile £98,750 £100,000 £95,000
UK excluding London median annual salary £52,500 £53,000 £50,000
% change year-on-year -0.94% +6.00% +4.17%

ETL
Job Vacancy Trend

Job postings citing ETL as a proportion of all IT jobs advertised.
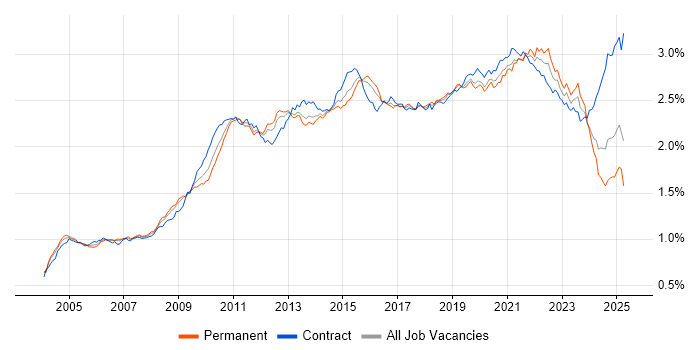
Job vacancy trend for ETL in the UK

ETL
Salary Trend

3-month moving average salary quoted in jobs citing ETL.

Salary trend for ETL in the UK

ETL
Salary Histogram

Salary distribution for jobs citing ETL over the 6 months to 30 November 2023.

Salary histogram for ETL in the UK

ETL
Top 17 Job Locations

The table below looks at the demand and provides a guide to the median salaries quoted in IT jobs citing ETL within the UK over the 6 months to 30 November 2023. The 'Rank Change' column provides an indication of the change in demand within each location based on the same 6 month period last year.

Location Rank Change
on Same Period
Last Year
Matching
Permanent
IT Job Ads
Median Salary
Past 6 Months
Median Salary
% Change
on Same Period
Last Year
Live
Jobs
England +10 1,356 £65,000 - 572
UK excluding London 0 714 £55,000 - 303
Work from Home 0 668 £60,000 -7.69% 287
London -2 653 £75,000 +7.14% 301
North of England +40 242 £55,000 +4.76% 98
North West +45 149 £55,000 +4.76% 59
Midlands +21 143 £50,000 -7.71% 47
South East -8 126 £60,000 - 85
South West -19 84 £69,447 +26.27% 29
Yorkshire +22 77 £55,000 -21.43% 24
West Midlands +26 75 £53,500 -2.73% 30
East Midlands +25 68 £50,000 - 17
Scotland +24 52 £48,779 -11.31% 14
East of England +79 38 £70,000 +33.33% 21
Wales -19 24 £44,710 -16.04% 10
North East +29 16 £55,000 +10.00% 15
Northern Ireland +34 5 £40,000 -17.95% 2

ETL
Co-occurring Skills and Capabilities by Category

The follow tables expand on the table above by listing co-occurrences grouped by category. The same employment type, locality and period is covered with up to 20 co-occurrences shown in each of the following categories:

Application Platforms
1 136 (9.26%) Apache Spark
2 83 (5.65%) Apache
3 70 (4.77%) Apache Airflow
4 34 (2.32%) SharePoint
5 32 (2.18%) SAS
6 24 (1.63%) Confluence
7 8 (0.54%) Luigi
8 6 (0.41%) IIS
9 5 (0.34%) Ethereum
9 5 (0.34%) Jupyter
10 4 (0.27%) CMS
10 4 (0.27%) JBoss
10 4 (0.27%) MS Exchange
10 4 (0.27%) Tomcat
10 4 (0.27%) WebSphere
11 2 (0.14%) Adobe Experience Manager
11 2 (0.14%) Appian
11 2 (0.14%) Oracle SOA Suite
11 2 (0.14%) Oracle Workflow
12 1 (0.068%) Apache Solr
Applications
1 84 (5.72%) Microsoft Excel
2 27 (1.84%) Microsoft Office
3 12 (0.82%) MS Visio
4 10 (0.68%) Spreadsheet
5 7 (0.48%) Microsoft PowerPoint
6 6 (0.41%) Microsoft Project
7 4 (0.27%) Trello
8 2 (0.14%) 3ds Max
8 2 (0.14%) Blender
8 2 (0.14%) CINEMA 4D
8 2 (0.14%) MicroStation
9 1 (0.068%) SPSS
Business Applications
1 24 (1.63%) Dynamics CRM
2 7 (0.48%) Shopify
3 5 (0.34%) NetSuite
3 5 (0.34%) Oracle EBS
3 5 (0.34%) Unit4 Business World
4 4 (0.27%) Dynamics NAV
4 4 (0.27%) SAP Business One
4 4 (0.27%) SAP S/4HANA
5 3 (0.20%) Oracle Receivables
6 2 (0.14%) Distributed Ledger
6 2 (0.14%) Elite 3E
6 2 (0.14%) Magento
6 2 (0.14%) SAP ERP
7 1 (0.068%) Adobe Campaign
7 1 (0.068%) Dynamics AX
7 1 (0.068%) iTrent
7 1 (0.068%) Oracle Financials
7 1 (0.068%) Salesforce CRM
7 1 (0.068%) SAP HCM
7 1 (0.068%) SAP IBP
Cloud Services
1 658 (44.82%) Azure
2 479 (32.63%) Power Platform
3 391 (26.63%) AWS
4 237 (16.14%) GCP
5 212 (14.44%) Azure Data Factory
6 117 (7.97%) Azure DevOps
7 102 (6.95%) Snowflake
8 88 (5.99%) Azure Synapse Analytics
9 84 (5.72%) Serverless
10 82 (5.59%) GitHub
11 70 (4.77%) Amazon S3
12 61 (4.16%) AWS Lambda
13 48 (3.27%) GitHub Actions
14 47 (3.20%) Vertex AI
15 46 (3.13%) Microsoft 365
16 42 (2.86%) PowerApps
17 40 (2.72%) dbt
18 31 (2.11%) Power Automate
19 30 (2.04%) Dynamics 365
20 28 (1.91%) Amazon Kinesis
Communications & Networking
1 8 (0.54%) Network Security
2 7 (0.48%) DNS
3 6 (0.41%) HTTP
3 6 (0.41%) SSH
3 6 (0.41%) WAN
4 5 (0.34%) Internet
4 5 (0.34%) iSCSI
4 5 (0.34%) SMS
5 4 (0.27%) Firewall
5 4 (0.27%) SMTP
5 4 (0.27%) TCP/IP
6 3 (0.20%) DHCP
6 3 (0.20%) DMZ
6 3 (0.20%) FTP
6 3 (0.20%) VPN
7 1 (0.068%) LAN
Database & Business Intelligence
1 518 (35.29%) Data Warehouse
2 455 (30.99%) Power BI
3 295 (20.10%) SQL Server
4 254 (17.30%) SQL Server Integration Services
5 248 (16.89%) Data Lake
6 177 (12.06%) Tableau
7 164 (11.17%) Big Data
8 146 (9.95%) Relational Database
9 143 (9.74%) NoSQL
10 127 (8.65%) SQL Server Reporting Services
11 98 (6.68%) Amazon Redshift
12 92 (6.27%) PostgreSQL
13 86 (5.86%) Azure SQL Database
14 85 (5.79%) BigQuery
15 82 (5.59%) MySQL
16 78 (5.31%) SQL Server Analysis Services
17 70 (4.77%) Hadoop
18 64 (4.36%) Looker
19 56 (3.81%) Amazon QuickSight
20 51 (3.47%) Bigtable
Development Applications
1 76 (5.18%) Jenkins
2 55 (3.75%) JIRA
3 51 (3.47%) Git
4 21 (1.43%) SQL Server Management Studio (SSMS)
5 15 (1.02%) ERwin
6 13 (0.89%) Visual Studio
7 11 (0.75%) Cucumber
8 9 (0.61%) Oracle Forms
9 8 (0.54%) Selenium
10 7 (0.48%) Bitbucket
10 7 (0.48%) JUnit
10 7 (0.48%) SonarQube
10 7 (0.48%) SpecFlow
11 6 (0.41%) Android Studio
11 6 (0.41%) ScalaTest
11 6 (0.41%) WebDriver
11 6 (0.41%) Xcode
12 5 (0.34%) GitLab
12 5 (0.34%) NUnit
12 5 (0.34%) Team Foundation Server
General
1 422 (28.75%) Finance
2 290 (19.75%) Social Skills
3 230 (15.67%) Analytical Skills
4 125 (8.51%) Banking
5 68 (4.63%) Marketing
6 60 (4.09%) Law
7 57 (3.88%) Inclusion and Diversity
7 57 (3.88%) Retail
8 54 (3.68%) Public Sector
9 35 (2.38%) Presentation Skills
10 32 (2.18%) Financial Institution
11 30 (2.04%) Legal
12 29 (1.98%) Publishing
13 28 (1.91%) Manufacturing
14 14 (0.95%) Investment Banking
14 14 (0.95%) Telecoms
15 13 (0.89%) Advertising
16 12 (0.82%) Influencing Skills
17 10 (0.68%) Front Office
18 9 (0.61%) Tech for Good
Job Titles
1 581 (39.58%) Data Engineer
2 227 (15.46%) Developer
3 217 (14.78%) Senior
4 180 (12.26%) Analyst
5 170 (11.58%) Architect
6 153 (10.42%) Lead
7 134 (9.13%) Senior Data Engineer
8 108 (7.36%) Data Architect
9 100 (6.81%) Business Intelligence Developer
10 95 (6.47%) Data Analyst
11 73 (4.97%) Solutions Architect
12 64 (4.36%) Lead Data Engineer
13 57 (3.88%) Azure Engineer
14 48 (3.27%) Power BI Developer
15 47 (3.20%) Azure Data Engineer
16 39 (2.66%) Consultant
17 37 (2.52%) Python Engineer
18 36 (2.45%) SQL Developer
19 34 (2.32%) Python Data Engineer
20 32 (2.18%) Software Engineer
Libraries, Frameworks & Software Standards
1 104 (7.08%) Kafka
2 97 (6.61%) PySpark
3 69 (4.70%) REST
4 63 (4.29%) JSON
5 60 (4.09%) .NET
6 49 (3.34%) XML
7 40 (2.72%) SOAP
8 27 (1.84%) Middleware
8 27 (1.84%) Web Services
9 26 (1.77%) Pandas
10 22 (1.50%) React
11 19 (1.29%) CSS
11 19 (1.29%) Spring
12 18 (1.23%) PyTorch
12 18 (1.23%) RESTful
12 18 (1.23%) TensorFlow
13 15 (1.02%) Flask
13 15 (1.02%) Hibernate
13 15 (1.02%) Node.js
13 15 (1.02%) NumPy
Miscellaneous
1 65 (4.43%) Replication
2 55 (3.75%) Data Structures
2 55 (3.75%) Public Cloud
3 52 (3.54%) Enterprise Software
4 50 (3.41%) Management Information System
5 48 (3.27%) Algorithms
5 48 (3.27%) Onboarding
6 35 (2.38%) Greenfield Project
6 35 (2.38%) Self-Motivation
7 33 (2.25%) Cloud Native
8 31 (2.11%) Reinsurance
9 27 (1.84%) Distributed Systems
10 26 (1.77%) Product Ownership
11 21 (1.43%) Low-Code
12 18 (1.23%) Legacy Systems
13 17 (1.16%) Renewable Energy
14 12 (0.82%) Clustering
14 12 (0.82%) IoT
15 11 (0.75%) Reference Data
16 10 (0.68%) Team-Oriented Environment
Operating Systems
1 30 (2.04%) Linux
1 30 (2.04%) Windows
2 6 (0.41%) Android
2 6 (0.41%) Apple iOS
2 6 (0.41%) CentOS
2 6 (0.41%) Red Hat Enterprise Linux
2 6 (0.41%) Unix
3 4 (0.27%) Windows Server
4 1 (0.068%) Windows 10
Processes & Methodologies
1 625 (42.57%) Business Intelligence
2 533 (36.31%) Analytics
2 533 (36.31%) Data Modelling
3 395 (26.91%) Data Pipeline
4 371 (25.27%) Agile
5 333 (22.68%) Visualisation
6 316 (21.53%) Data Engineering
7 250 (17.03%) Data Integration
8 237 (16.14%) DevOps
9 234 (15.94%) Machine Learning
10 217 (14.78%) Problem-Solving
11 206 (14.03%) Data Visualisation
12 202 (13.76%) CI/CD
13 200 (13.62%) Data Management
14 183 (12.47%) Data Science
15 177 (12.06%) Data Analysis
16 154 (10.49%) Data Architecture
16 154 (10.49%) Migration
17 150 (10.22%) Decision-Making
18 146 (9.95%) Artificial Intelligence
Programming Languages
1 994 (67.71%) SQL
2 539 (36.72%) Python
3 173 (11.78%) T-SQL
4 95 (6.47%) C#
5 88 (5.99%) PL/SQL
6 77 (5.25%) Java
7 63 (4.29%) Data Analysis Expressions
8 54 (3.68%) R
9 47 (3.20%) JavaScript
10 46 (3.13%) Scala
11 44 (3.00%) PowerShell
12 29 (1.98%) Bash
13 28 (1.91%) Go
14 23 (1.57%) C++
15 22 (1.50%) TypeScript
16 15 (1.02%) MATLAB
17 9 (0.61%) VBA
18 8 (0.54%) Kusto Query Language
19 7 (0.48%) VB
20 6 (0.41%) Ruby
Qualifications
1 211 (14.37%) Degree
2 84 (5.72%) Security Cleared
3 81 (5.52%) Computer Science Degree
4 77 (5.25%) SC Cleared
5 49 (3.34%) Master's Degree
6 40 (2.72%) Azure Certification
7 35 (2.38%) Microsoft Certification
8 11 (0.75%) BPSS Clearance
9 10 (0.68%) MCSE
10 8 (0.54%) DV Cleared
10 8 (0.54%) PMI Certification
11 7 (0.48%) ISEB
12 6 (0.41%) AWS Certification
12 6 (0.41%) ISTQB
12 6 (0.41%) MCSA
12 6 (0.41%) PhD
13 3 (0.20%) ACCA
13 3 (0.20%) MCITP
13 3 (0.20%) MCTS
13 3 (0.20%) PRINCE2 Practitioner
Quality Assurance & Compliance
1 239 (16.28%) Data Quality
2 74 (5.04%) QA
3 40 (2.72%) GDPR
4 15 (1.02%) PMO
5 6 (0.41%) GAAP
6 5 (0.34%) Accessibility
7 2 (0.14%) Actionable Recommendations
7 2 (0.14%) HIPAA
7 2 (0.14%) SLA
8 1 (0.068%) Cyber Essentials
8 1 (0.068%) EMIR
8 1 (0.068%) MiFID
8 1 (0.068%) PCI DSS
System Software
1 64 (4.36%) Docker
2 18 (1.23%) Active Directory
3 7 (0.48%) HDFS
4 4 (0.27%) Hyper-V
5 3 (0.20%) Squid
5 3 (0.20%) VMware Infrastructure
6 2 (0.14%) Virtual Machines
Systems Management
1 76 (5.18%) Terraform
2 67 (4.56%) Kubernetes
3 7 (0.48%) Microsoft Clustering
4 6 (0.41%) Oozie
5 5 (0.34%) HP ALM
5 5 (0.34%) Progress Chef
5 5 (0.34%) Puppet
6 3 (0.20%) Ansible
6 3 (0.20%) Kibana
7 2 (0.14%) Active Directory Federation Services
7 2 (0.14%) Grafana
7 2 (0.14%) Prometheus
8 1 (0.068%) logstash
8 1 (0.068%) Rancher
Vendors
1 306 (20.84%) Microsoft
2 179 (12.19%) Databricks
3 124 (8.45%) Google
4 96 (6.54%) Oracle
5 70 (4.77%) SAP
6 54 (3.68%) Informatica
7 34 (2.32%) Salesforce
8 26 (1.77%) IBM
8 26 (1.77%) Talend
9 24 (1.63%) Alteryx
10 12 (0.82%) MuleSoft
11 10 (0.68%) Intapp
12 9 (0.61%) MicroStrategy
12 9 (0.61%) Splunk
13 8 (0.54%) ServiceNow
14 7 (0.48%) Workday
15 6 (0.41%) OpenText
15 6 (0.41%) Red Hat
15 6 (0.41%) Remedy
15 6 (0.41%) Siebel