Enterprise Application Software
UK

The table below looks at the prevalence of the term Enterprise Software in permanent job vacancies. Included is a benchmarking guide to the salaries offered in vacancies that have cited Enterprise Software over the 6 months to 10 December 2023 with a comparison to the same period over the previous 2 years.

6 months to
10 Dec 2023
Same period 2022 Same period 2021
Rank 319 282 259
Rank change year-on-year -37 -23 +18
Permanent jobs citing Enterprise Software 505 1,593 1,789
As % of all permanent jobs advertised in the UK 0.97% 1.30% 1.41%
As % of the Miscellaneous category 2.62% 3.04% 3.21%
Number of salaries quoted 433 1,040 1,166
10th Percentile £45,000 £41,250 £37,500
25th Percentile £56,250 £52,500 £48,974
Median annual salary (50th Percentile) £70,000 £65,000 £65,000
Median % change year-on-year +7.69% - +4.00%
75th Percentile £90,000 £87,625 £82,500
90th Percentile £102,200 £108,750 £99,375
UK excluding London median annual salary £60,000 £62,500 £55,000
% change year-on-year -4.00% +13.64% +10.00%

All Generic Skills
UK

Enterprise Software is in the General and Transferable Skills category. The following table is for comparison with the above and provides summary statistics for all permanent job vacancies with a requirement for generic IT skills.

Permanent vacancies with a requirement for generic IT skills 19,243 52,473 55,657
As % of all permanent jobs advertised in the UK 36.81% 42.93% 43.80%
Number of salaries quoted 14,017 29,568 33,811
10th Percentile £32,756 £34,996 £33,750
25th Percentile £45,000 £46,250 £45,000
Median annual salary (50th Percentile) £62,500 £64,750 £60,000
Median % change year-on-year -3.47% +7.92% -
75th Percentile £83,750 £85,000 £82,500
90th Percentile £107,500 £105,000 £100,000
UK excluding London median annual salary £55,000 £55,000 £50,000
% change year-on-year - +10.00% -

Enterprise Software
Job Vacancy Trend

Job postings citing Enterprise Software as a proportion of all IT jobs advertised.
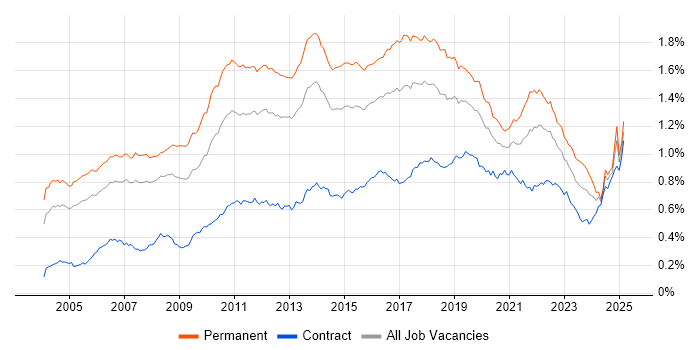
Job vacancy trend for Enterprise Software in the UK

Enterprise Software
Salary Trend

3-month moving average salary quoted in jobs citing Enterprise Software.

Salary trend for Enterprise Software in the UK

Enterprise Software
Salary Histogram

Salary distribution for jobs citing Enterprise Software over the 6 months to 10 December 2023.

Salary histogram for Enterprise Software in the UK

Enterprise Software
Top 16 Job Locations

The table below looks at the demand and provides a guide to the median salaries quoted in IT jobs citing Enterprise Software within the UK over the 6 months to 10 December 2023. The 'Rank Change' column provides an indication of the change in demand within each location based on the same 6 month period last year.

Location Rank Change
on Same Period
Last Year
Matching
Permanent
IT Job Ads
Median Salary
Past 6 Months
Median Salary
% Change
on Same Period
Last Year
Live
Jobs
England -39 430 £72,500 +11.54% 223
UK excluding London +3 238 £60,000 -4.00% 142
London -47 205 £85,000 +13.33% 103
Work from Home -31 178 £65,000 -7.14% 108
North of England +77 71 £65,000 +4.00% 24
South East +32 60 £55,000 -12.00% 42
North West +92 55 £65,000 +30.00% 16
Midlands +68 33 £65,000 +8.33% 31
West Midlands +109 30 £65,000 +6.12% 28
Scotland +3 24 £45,000 -30.77% 12
East of England +104 16 £57,500 -4.17% 10
Yorkshire +52 16 £60,468 -6.97% 7
Wales +18 14 £70,000 +48.26% 10
South West +60 13 £55,000 -6.38% 12
Northern Ireland -6 7 £62,500 -3.85% 2
East Midlands +12 3 £55,000 -7.56% 3

Enterprise Software
Co-occurring Skills and Capabilities by Category

The follow tables expand on the table above by listing co-occurrences grouped by category. The same employment type, locality and period is covered with up to 20 co-occurrences shown in each of the following categories:

Application Platforms
1 51 (10.10%) Confluence
2 26 (5.15%) SharePoint
3 15 (2.97%) Apache
3 15 (2.97%) IIS
4 13 (2.57%) MS Exchange
5 12 (2.38%) WebSphere
6 8 (1.58%) CMS
6 8 (1.58%) Oracle Workflow
7 7 (1.39%) Tomcat
8 6 (1.19%) Oracle SOA Suite
9 4 (0.79%) Apache Spark
9 4 (0.79%) ArcGIS
9 4 (0.79%) ArcSDE
9 4 (0.79%) Camunda
9 4 (0.79%) Headless CMS
9 4 (0.79%) SAS
10 2 (0.40%) Adobe Experience Manager
10 2 (0.40%) Appian
11 1 (0.20%) BizTalk Server
11 1 (0.20%) Umbraco
Applications
1 24 (4.75%) Microsoft Office
2 15 (2.97%) Microsoft Excel
3 9 (1.78%) AutoCAD
3 9 (1.78%) PTC Creo
3 9 (1.78%) SOLIDWORKS
4 8 (1.58%) Microsoft PowerPoint
5 4 (0.79%) Autodesk Inventor
6 1 (0.20%) Microsoft Project
6 1 (0.20%) Sketch
Business Applications
1 12 (2.38%) Dynamics CRM
2 8 (1.58%) Infor M3
3 6 (1.19%) Sage X3
4 3 (0.59%) SAP Oil and Gas
5 2 (0.40%) Dynamics GP
5 2 (0.40%) NetSuite
5 2 (0.40%) Orchard Housing
5 2 (0.40%) Salesforce CRM
5 2 (0.40%) SAP S/4HANA
5 2 (0.40%) Siebel CRM
6 1 (0.20%) Carpe Diem
6 1 (0.20%) Distributed Ledger
6 1 (0.20%) Dynamics AX
6 1 (0.20%) Elite 3E
6 1 (0.20%) Oracle EBS
6 1 (0.20%) SAP BPC
6 1 (0.20%) SAP CRM
Cloud Services
1 209 (41.39%) Azure
2 92 (18.22%) AWS
3 75 (14.85%) Microsoft 365
4 71 (14.06%) SaaS
5 60 (11.88%) Power Platform
6 58 (11.49%) Azure DevOps
7 48 (9.50%) IaaS
8 47 (9.31%) PaaS
9 35 (6.93%) GCP
10 33 (6.53%) Entra ID
11 29 (5.74%) FinancialForce
12 23 (4.55%) Azure Logic Apps
12 23 (4.55%) GitHub
13 22 (4.36%) Serverless
14 18 (3.56%) PowerApps
15 17 (3.37%) Power Automate
16 16 (3.17%) Amazon S3
17 14 (2.77%) Azure Functions
18 11 (2.18%) Azure Data Factory
19 8 (1.58%) Dynamics 365
Communications & Networking
1 21 (4.16%) DNS
2 14 (2.77%) DHCP
3 9 (1.78%) Firewall
4 6 (1.19%) SSL
5 5 (0.99%) Network Security
5 5 (0.99%) SAN
6 3 (0.59%) Cisco ASA
7 1 (0.20%) ADSL
7 1 (0.20%) FTP
7 1 (0.20%) Internet
7 1 (0.20%) Intrusion Detection
7 1 (0.20%) IPv4
7 1 (0.20%) iSCSI
7 1 (0.20%) MPLS
7 1 (0.20%) NAS
7 1 (0.20%) Reverse Proxy
7 1 (0.20%) VLAN
7 1 (0.20%) VoIP
7 1 (0.20%) WAN
Database & Business Intelligence
1 108 (21.39%) SQL Server
2 57 (11.29%) Data Warehouse
3 48 (9.50%) Power BI
4 16 (3.17%) Relational Database
5 14 (2.77%) Amazon RDS
6 13 (2.57%) Big Data
7 12 (2.38%) Amazon Redshift
7 12 (2.38%) SAP HANA
8 11 (2.18%) Azure SQL Database
9 9 (1.78%) Amazon Athena
9 9 (1.78%) Amazon QuickSight
9 9 (1.78%) BusinessObjects
9 9 (1.78%) Data Lake
9 9 (1.78%) DynamoDB
9 9 (1.78%) SQL Server Reporting Services
10 8 (1.58%) SQL Server Integration Services
11 7 (1.39%) Elasticsearch
11 7 (1.39%) Microsoft Analysis Services
11 7 (1.39%) Oracle Database
12 5 (0.99%) Flink
Development Applications
1 53 (10.50%) JIRA
2 34 (6.73%) Jenkins
3 26 (5.15%) Git
4 20 (3.96%) Team Foundation Server
5 15 (2.97%) Bitbucket
6 14 (2.77%) Visual Studio
7 12 (2.38%) Gradle
8 10 (1.98%) Chocolatey
9 9 (1.78%) Cypress.io
9 9 (1.78%) Selenium
10 8 (1.58%) Maven
10 8 (1.58%) ScriptRunner
10 8 (1.58%) Subversion
10 8 (1.58%) TeamCity
11 7 (1.39%) IntelliJ
11 7 (1.39%) JetBrains Rider
11 7 (1.39%) JUnit
11 7 (1.39%) Mockito
12 5 (0.99%) Sonatype Nexus
12 5 (0.99%) WebDriver
General
1 154 (30.50%) Finance
2 114 (22.57%) Social Skills
3 43 (8.51%) Manufacturing
4 39 (7.72%) Analytical Skills
5 27 (5.35%) Inclusion and Diversity
5 27 (5.35%) Law
6 25 (4.95%) Public Sector
7 24 (4.75%) Marketing
8 23 (4.55%) Retail
9 19 (3.76%) Publishing
10 12 (2.38%) Banking
10 12 (2.38%) Legal
11 11 (2.18%) Presentation Skills
12 10 (1.98%) Advertising
12 10 (1.98%) Back Office
13 5 (0.99%) Billing
13 5 (0.99%) Front Office
13 5 (0.99%) Influencing Skills
14 4 (0.79%) Organisational Skills
15 3 (0.59%) Telecoms
Job Titles
1 94 (18.61%) Architect
1 94 (18.61%) Developer
2 85 (16.83%) Senior
3 70 (13.86%) Solutions Architect
4 55 (10.89%) Analyst
5 31 (6.14%) Lead
6 26 (5.15%) Infrastructure Engineer
7 23 (4.55%) Senior Developer
8 22 (4.36%) Java Developer
9 19 (3.76%) Data Architect
10 17 (3.37%) .NET Developer
11 15 (2.97%) Applications Support
11 15 (2.97%) Automation Engineer
12 14 (2.77%) Administrator
12 14 (2.77%) Data Analyst
13 12 (2.38%) Cloud Engineer
13 12 (2.38%) Consultant
13 12 (2.38%) Senior Architect
14 11 (2.18%) AWS Engineer
14 11 (2.18%) Systems Engineer
Libraries, Frameworks & Software Standards
1 86 (17.03%) .NET
1 86 (17.03%) REST
2 64 (12.67%) Spring
3 45 (8.91%) CSS
4 43 (8.51%) HTML
4 43 (8.51%) SOAP
5 42 (8.32%) JSON
6 37 (7.33%) XML
7 34 (6.73%) React
8 31 (6.14%) Hibernate
9 30 (5.94%) ASP.NET
10 28 (5.54%) JDBC
10 28 (5.54%) Struts
11 27 (5.35%) Spring Boot
12 26 (5.15%) .NET Framework
13 25 (4.95%) Middleware
14 24 (4.75%) .NET Core
14 24 (4.75%) AngularJS
15 21 (4.16%) Entity Framework
16 19 (3.76%) Web Services
Miscellaneous
1 34 (6.73%) Product Ownership
2 26 (5.15%) Public Cloud
3 25 (4.95%) Management Information System
4 17 (3.37%) Distributed Systems
4 17 (3.37%) Low-Code
4 17 (3.37%) Self-Motivation
5 16 (3.17%) Reinsurance
6 12 (2.38%) Data Centre
7 11 (2.18%) Enterprise Cloud
7 11 (2.18%) Virtual Team
8 10 (1.98%) Cloud Native
8 10 (1.98%) Renewable Energy
9 9 (1.78%) Operational Technology
10 7 (1.39%) Cyberattack
10 7 (1.39%) Greenfield Project
10 7 (1.39%) Hedge funds
10 7 (1.39%) Mobile App
10 7 (1.39%) Team-Oriented Environment
11 6 (1.19%) Onboarding
12 5 (0.99%) Clustering
Operating Systems
1 50 (9.90%) Windows
2 33 (6.53%) Windows Server
3 23 (4.55%) Linux
4 9 (1.78%) Windows 10
5 8 (1.58%) Windows Server 2012
6 3 (0.59%) Android
6 3 (0.59%) Apple iOS
6 3 (0.59%) Red Hat Enterprise Linux
6 3 (0.59%) Ubuntu
6 3 (0.59%) Unix
7 2 (0.40%) CentOS
8 1 (0.20%) Mac OS
8 1 (0.20%) VMS
Processes & Methodologies
1 199 (39.41%) Agile
2 133 (26.34%) DevOps
3 94 (18.61%) Roadmaps
4 86 (17.03%) ITIL
5 83 (16.44%) Project Delivery
6 82 (16.24%) Migration
7 78 (15.45%) Scrum
8 76 (15.05%) ERP
9 75 (14.85%) Problem-Solving
9 75 (14.85%) Software Engineering
10 74 (14.65%) Microservices
11 71 (14.06%) Business Intelligence
12 58 (11.49%) CRM
12 58 (11.49%) Technical Architecture
13 57 (11.29%) Analytics
14 48 (9.50%) ETL
15 46 (9.11%) Data Modelling
16 43 (8.51%) Data Governance
16 43 (8.51%) UML
17 42 (8.32%) Workflow
Programming Languages
1 145 (28.71%) SQL
2 80 (15.84%) JavaScript
3 77 (15.25%) C#
4 58 (11.49%) Java
5 50 (9.90%) PowerShell
6 43 (8.51%) Python
7 33 (6.53%) TypeScript
8 30 (5.94%) PL/SQL
9 24 (4.75%) T-SQL
10 13 (2.57%) Bash
11 9 (1.78%) MATLAB
12 6 (1.19%) Go
13 4 (0.79%) Data Analysis Expressions
13 4 (0.79%) Perl
13 4 (0.79%) U-SQL
14 3 (0.59%) XPath
14 3 (0.59%) XQuery
15 2 (0.40%) C
15 2 (0.40%) Groovy
15 2 (0.40%) PHP
Qualifications
1 61 (12.08%) Degree
2 31 (6.14%) Microsoft Certification
3 19 (3.76%) Azure Certification
4 16 (3.17%) Security Cleared
5 15 (2.97%) MCSA
6 14 (2.77%) Master's Degree
7 11 (2.18%) Computer Science Degree
8 10 (1.98%) MCSE
9 9 (1.78%) ITIL Certification
10 8 (1.58%) AWS Certification
10 8 (1.58%) AWS Certified Solutions Architect
10 8 (1.58%) TOGAF Certification
11 7 (1.39%) CISSP
12 5 (0.99%) SC Cleared
13 4 (0.79%) CEH
13 4 (0.79%) SANS
14 3 (0.59%) ITIL Foundation Certificate
14 3 (0.59%) OCP
14 3 (0.59%) Oracle Certification
14 3 (0.59%) SAP Certification
Quality Assurance & Compliance
1 30 (5.94%) NIST
2 23 (4.55%) Data Quality
3 18 (3.56%) QA
4 10 (1.98%) PMO
5 6 (1.19%) Accessibility
6 5 (0.99%) Cyber Essentials
6 5 (0.99%) Cyber Essentials PLUS
7 4 (0.79%) ISO/IEC 27001
8 2 (0.40%) Sarbanes-Oxley
8 2 (0.40%) SLA
8 2 (0.40%) Software Quality Assurance
9 1 (0.20%) COBIT
9 1 (0.20%) GDPR
9 1 (0.20%) ISO 9001
9 1 (0.20%) PCI DSS
9 1 (0.20%) WCAG
System Software
1 57 (11.29%) Active Directory
2 33 (6.53%) Docker
3 7 (1.39%) VMware Infrastructure
4 6 (1.19%) DFS Replication
5 2 (0.40%) XenApp
6 1 (0.20%) Apache ZooKeeper
6 1 (0.20%) Citrix Hypervisor
6 1 (0.20%) Hyper-V
6 1 (0.20%) KVM
6 1 (0.20%) QEMU
6 1 (0.20%) Virtual Machines
6 1 (0.20%) VMware ESXi
6 1 (0.20%) vSphere
Systems Management
1 29 (5.74%) Kubernetes
2 21 (4.16%) Terraform
3 17 (3.37%) Ansible
4 15 (2.97%) SCCM
5 12 (2.38%) Microsoft Intune
6 11 (2.18%) SCOM
7 10 (1.98%) Active Directory Federation Services
8 6 (1.19%) Single Sign-On
9 5 (0.99%) Failover Clustering
9 5 (0.99%) Packer
10 4 (0.79%) Progress Chef
10 4 (0.79%) Puppet
10 4 (0.79%) Salt
11 3 (0.59%) FortiGate
12 2 (0.40%) Grafana
12 2 (0.40%) Kibana
13 1 (0.20%) CASB
13 1 (0.20%) HAProxy
13 1 (0.20%) Prometheus
13 1 (0.20%) Red Hat Satellite
Vendors
1 169 (33.47%) Microsoft
2 57 (11.29%) Salesforce
3 54 (10.69%) SAP
4 43 (8.51%) Atlassian
5 35 (6.93%) Sage
6 33 (6.53%) Oracle
7 30 (5.94%) HubSpot
8 29 (5.74%) Pardot
9 18 (3.56%) TOWER Software
10 16 (3.17%) IBM
11 15 (2.97%) iManage
12 14 (2.77%) Informatica
13 11 (2.18%) Red Hat
14 9 (1.78%) Databricks
14 9 (1.78%) MathWorks
14 9 (1.78%) MuleSoft
14 9 (1.78%) PTC
14 9 (1.78%) VMware
15 7 (1.39%) Cisco
15 7 (1.39%) Xamarin