Open Source
UK

The following table provides summary statistics for permanent job vacancies with a requirement for Open Source skills. Included is a benchmarking guide to the salaries offered in vacancies that have cited Open Source over the 6 months to 28 November 2023 with a comparison to the same period in the previous 2 years.

6 months to
28 Nov 2023
Same period 2022 Same period 2021
Rank 246 185 150
Rank change year-on-year -61 -35 -16
Permanent jobs citing Open Source 730 2,617 3,339
As % of all permanent jobs advertised in the UK 1.34% 2.09% 2.60%
As % of the Processes & Methodologies category 1.43% 2.18% 2.73%
Number of salaries quoted 514 1,260 1,494
10th Percentile £41,625 £42,500 £42,500
25th Percentile £52,293 £54,731 £50,000
Median annual salary (50th Percentile) £70,000 £70,000 £69,250
Median % change year-on-year - +1.08% +6.54%
75th Percentile £83,750 £93,750 £86,250
90th Percentile £104,250 £107,500 £101,250
UK excluding London median annual salary £62,500 £62,500 £57,500
% change year-on-year - +8.70% +9.52%

All Process and Methodology Skills
UK

Open Source is in the Processes and Methodologies category. The following table is for comparison with the above and provides summary statistics for all permanent job vacancies with a requirement for process or methodology skills.

Permanent vacancies with a requirement for process or methodology skills 51,121 120,104 122,523
As % of all permanent jobs advertised in the UK 94.09% 95.72% 95.43%
Number of salaries quoted 36,956 73,203 81,032
10th Percentile £32,500 £34,313 £32,500
25th Percentile £43,750 £45,000 £42,500
Median annual salary (50th Percentile) £60,000 £60,000 £59,000
Median % change year-on-year - +1.69% +7.27%
75th Percentile £80,000 £81,250 £77,500
90th Percentile £98,750 £100,000 £95,000
UK excluding London median annual salary £52,500 £53,000 £50,000
% change year-on-year -0.94% +6.00% +4.17%

Open Source
Job Vacancy Trend

Job postings citing Open Source as a proportion of all IT jobs advertised.
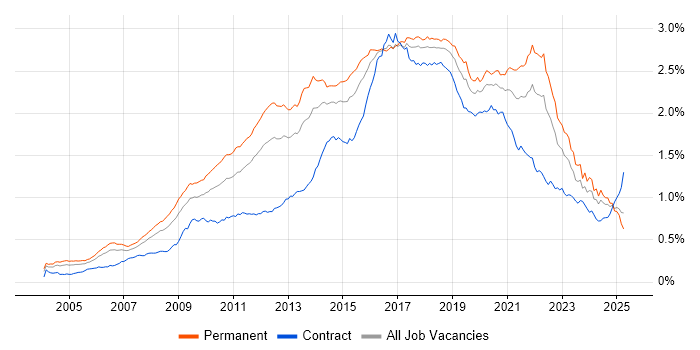
Job vacancy trend for Open Source in the UK

Open Source
Salary Trend

3-month moving average salary quoted in jobs citing Open Source.

Salary trend for Open Source in the UK

Open Source
Salary Histogram

Salary distribution for jobs citing Open Source over the 6 months to 28 November 2023.

Salary histogram for Open Source in the UK

Open Source
Top 18 Job Locations

The table below looks at the demand and provides a guide to the median salaries quoted in IT jobs citing Open Source within the UK over the 6 months to 28 November 2023. The 'Rank Change' column provides an indication of the change in demand within each location based on the same 6 month period last year.

Location Rank Change
on Same Period
Last Year
Matching
Permanent
IT Job Ads
Median Salary
Past 6 Months
Median Salary
% Change
on Same Period
Last Year
Live
Jobs
England -63 598 £70,000 -0.71% 340
Work from Home -32 418 £67,568 -3.47% 191
UK excluding London +11 414 £62,500 - 201
London -112 234 £80,000 +2.38% 179
South West +62 106 £62,500 -3.85% 24
North of England +6 102 £65,000 +1.96% 49
South East +17 75 £48,000 -12.73% 50
North West +7 66 £63,750 -1.92% 28
Scotland +29 47 £70,576 +41.15% 14
Midlands +30 35 £61,250 -12.50% 16
Yorkshire +72 27 £75,554 +20.89% 16
East of England +73 20 £57,500 -4.17% 36
Wales +10 20 £67,759 +8.41% 10
East Midlands +23 18 £49,990 -25.94% 5
West Midlands +34 17 £67,250 -3.93% 11
Northern Ireland +39 12 £65,000 -2.99% 3
North East +26 9 £65,000 -13.33% 5
Channel Islands - 1 £55,000 -

Open Source
Co-occurring Skills and Capabilities by Category

The follow tables expand on the table above by listing co-occurrences grouped by category. The same employment type, locality and period is covered with up to 20 co-occurrences shown in each of the following categories:

Application Platforms
1 29 (3.97%) Tomcat
2 26 (3.56%) Confluence
3 24 (3.29%) Apache
3 24 (3.29%) Jetty
4 20 (2.74%) Apache Spark
5 14 (1.92%) SharePoint
6 11 (1.51%) nginx
7 8 (1.10%) OpenStack
8 5 (0.68%) Drupal
8 5 (0.68%) Oracle SOA Suite
9 4 (0.55%) Apache Airflow
9 4 (0.55%) JBoss
10 3 (0.41%) Apache Solr
10 3 (0.41%) Red Hat Fuse
11 2 (0.27%) Apache Pig
11 2 (0.27%) CMS
11 2 (0.27%) Headless CMS
12 1 (0.14%) GeoServer
12 1 (0.14%) WildFly
12 1 (0.14%) WordPress
Applications
1 4 (0.55%) LibreOffice
2 3 (0.41%) MS Visio
3 2 (0.27%) Campfire
3 2 (0.27%) CATIA
3 2 (0.27%) Chatbot
3 2 (0.27%) Microsoft Office
4 1 (0.14%) Microsoft Excel
4 1 (0.14%) Spreadsheet
Business Applications
1 3 (0.41%) Dynamics CRM
1 3 (0.41%) Magento
2 1 (0.14%) Adobe Campaign
2 1 (0.14%) Endur
2 1 (0.14%) FastStats
2 1 (0.14%) SAP S/4HANA
Cloud Services
1 274 (37.53%) AWS
2 198 (27.12%) Azure
3 139 (19.04%) Serverless
4 70 (9.59%) GCP
5 68 (9.32%) Cloud Computing
6 53 (7.26%) AWS CloudFormation
7 49 (6.71%) SaaS
8 48 (6.58%) GitHub
9 42 (5.75%) AWS Lambda
10 40 (5.48%) PaaS
11 38 (5.21%) Amazon ECS
12 35 (4.79%) OpenShift
13 30 (4.11%) dbt
14 27 (3.70%) Azure DevOps
15 25 (3.42%) Amazon EKS
16 24 (3.29%) IaaS
17 22 (3.01%) Amazon EC2
18 20 (2.74%) Amazon S3
19 18 (2.47%) Azure Monitor
20 16 (2.19%) Pulumi
Communications & Networking
1 40 (5.48%) TCP/IP
2 36 (4.93%) Internet
3 29 (3.97%) HTTP
4 26 (3.56%) WAN
5 23 (3.15%) SSL
6 19 (2.60%) SMTP
6 19 (2.60%) VPN
7 17 (2.33%) DNS
7 17 (2.33%) LAN
8 15 (2.05%) Firewall
9 13 (1.78%) Network Security
10 12 (1.64%) Modbus
11 8 (1.10%) SAN
12 7 (0.96%) BGP
12 7 (0.96%) MPLS
12 7 (0.96%) Unified Communications
12 7 (0.96%) Wi-Fi
13 6 (0.82%) Cisco ISE
13 6 (0.82%) Cisco Nexus
13 6 (0.82%) DMZ
Database & Business Intelligence
1 89 (12.19%) Big Data
2 83 (11.37%) PostgreSQL
3 74 (10.14%) Relational Database
4 71 (9.73%) Oracle Database
5 64 (8.77%) RDBMS
6 45 (6.16%) NoSQL
7 41 (5.62%) Redis
8 40 (5.48%) Hadoop
9 35 (4.79%) Elasticsearch
9 35 (4.79%) MySQL
10 22 (3.01%) MongoDB
11 21 (2.88%) SQL Server
12 18 (2.47%) Amazon RDS
13 17 (2.33%) Geospatial Data
14 14 (1.92%) Amazon Redshift
15 11 (1.51%) Apache Hive
16 10 (1.37%) Data Warehouse
17 6 (0.82%) BigQuery
17 6 (0.82%) DynamoDB
17 6 (0.82%) Oracle Reports
Development Applications
1 141 (19.32%) Git
2 112 (15.34%) Jenkins
3 69 (9.45%) GitLab
4 36 (4.93%) JIRA
4 36 (4.93%) Selenium
5 29 (3.97%) Cucumber
6 26 (3.56%) JUnit
7 20 (2.74%) Maven
7 20 (2.74%) TeamCity
8 14 (1.92%) Octopus Deploy
9 13 (1.78%) Robot Framework
10 12 (1.64%) JDeveloper
10 12 (1.64%) WebDriver
11 10 (1.37%) Artifactory
12 9 (1.23%) REST Assured
13 8 (1.10%) Cypress.io
13 8 (1.10%) Mocha
13 8 (1.10%) Serenity BDD
14 7 (0.96%) Gradle
14 7 (0.96%) NUnit
General
1 164 (22.47%) Finance
2 152 (20.82%) Social Skills
3 91 (12.47%) Inclusion and Diversity
4 86 (11.78%) Banking
5 66 (9.04%) Retail
6 51 (6.99%) Police
7 42 (5.75%) Public Sector
8 38 (5.21%) Presentation Skills
9 37 (5.07%) Legal
10 32 (4.38%) Analytical Skills
11 25 (3.42%) Retail Banking
12 16 (2.19%) Marketing
13 14 (1.92%) Financial Institution
14 12 (1.64%) Automotive
14 12 (1.64%) Games
15 10 (1.37%) Front Office
15 10 (1.37%) Telecoms
16 8 (1.10%) Influencing Skills
17 7 (0.96%) Law
17 7 (0.96%) Manufacturing
Job Titles
1 140 (19.18%) Software Engineer
2 123 (16.85%) Senior
3 119 (16.30%) Developer
4 92 (12.60%) Architect
5 67 (9.18%) DevOps Engineer
6 65 (8.90%) Solutions Architect
7 63 (8.63%) Ruby Engineer
8 38 (5.21%) AWS Engineer
9 37 (5.07%) Lead
10 35 (4.79%) Consultant
11 30 (4.11%) Java Developer
12 28 (3.84%) AWS DevOps
13 26 (3.56%) Technical Architect
14 25 (3.42%) AWS DevOps Engineer
15 20 (2.74%) Python Engineer
15 20 (2.74%) Senior Developer
15 20 (2.74%) Site Reliability Engineer
16 19 (2.60%) Analyst
16 19 (2.60%) Senior Software Engineer
17 18 (2.47%) Python Developer
Libraries, Frameworks & Software Standards
1 111 (15.21%) Node.js
1 111 (15.21%) React
2 91 (12.47%) Spring
3 75 (10.27%) HTML
4 74 (10.14%) CSS
5 72 (9.86%) Kafka
6 55 (7.53%) REST
7 54 (7.40%) .NET
7 54 (7.40%) Spring Boot
8 47 (6.44%) Django
9 44 (6.03%) JSON
10 38 (5.21%) RESTful
11 36 (4.93%) XML
12 33 (4.52%) Web Services
13 32 (4.38%) jQuery
14 25 (3.42%) HTML5
15 23 (3.15%) AngularJS
16 21 (2.88%) OAuth
16 21 (2.88%) PyTorch
17 20 (2.74%) SAML
Miscellaneous
1 50 (6.85%) Algorithms
2 47 (6.44%) Cloud Native
3 45 (6.16%) Public Cloud
4 44 (6.03%) Distributed Systems
5 36 (4.93%) Private Cloud
6 30 (4.11%) Blockchain
7 29 (3.97%) Online Banking
8 28 (3.84%) Self-Motivation
9 27 (3.70%) Data Centre
10 25 (3.42%) Product Ownership
11 22 (3.01%) Robotics
12 20 (2.74%) Mobile App
13 19 (2.60%) Blog
13 19 (2.60%) Cyber Threat
13 19 (2.60%) Onboarding
14 16 (2.19%) Greenfield Project
15 14 (1.92%) Tandem
16 13 (1.78%) SWIFT Messaging Network
17 12 (1.64%) CAN bus
17 12 (1.64%) SCADA
Operating Systems
1 168 (23.01%) Linux
2 73 (10.00%) Unix
3 54 (7.40%) Windows
4 30 (4.11%) Red Hat Enterprise Linux
5 28 (3.84%) Android
6 24 (3.29%) CentOS
7 15 (2.05%) VMS
8 11 (1.51%) Ubuntu
9 10 (1.37%) Apple iOS
10 9 (1.23%) Windows Server
11 8 (1.10%) Mac OS
12 6 (0.82%) Debian
13 4 (0.55%) Windows Server 2012
14 3 (0.41%) Windows 10
14 3 (0.41%) Windows Server 2016
14 3 (0.41%) Windows Server 2019
15 2 (0.27%) OpenBSD
16 1 (0.14%) Windows Server 2008
Processes & Methodologies
1 349 (47.81%) Agile
2 307 (42.05%) DevOps
3 250 (34.25%) Software Engineering
4 219 (30.00%) Microservices
5 194 (26.58%) CI/CD
6 180 (24.66%) Continuous Integration
7 157 (21.51%) Problem-Solving
8 124 (16.99%) Containerisation
9 114 (15.62%) Technical Leadership
10 104 (14.25%) Actionable Insight
11 94 (12.88%) Scrum
12 91 (12.47%) Unit Testing
13 89 (12.19%) Clean Code
14 85 (11.64%) Design Patterns
15 83 (11.37%) Code Quality
16 77 (10.55%) Mentoring
17 71 (9.73%) Machine Learning
18 69 (9.45%) Artificial Intelligence
19 68 (9.32%) TDD
20 62 (8.49%) SDLC
Programming Languages
1 369 (50.55%) Python
2 321 (43.97%) Java
3 216 (29.59%) JavaScript
4 134 (18.36%) Go
5 120 (16.44%) Bash
6 109 (14.93%) Ruby
7 94 (12.88%) SQL
8 86 (11.78%) C#
9 70 (9.59%) Perl
10 46 (6.30%) C++
11 39 (5.34%) PowerShell
12 36 (4.93%) C
13 35 (4.79%) TypeScript
14 20 (2.74%) PHP
15 14 (1.92%) Fortran
16 9 (1.23%) Kotlin
16 9 (1.23%) Scala
16 9 (1.23%) Shell Script
17 8 (1.10%) R
17 8 (1.10%) Rust
Qualifications
1 297 (40.68%) Security Cleared
2 224 (30.68%) SC Cleared
3 90 (12.33%) Degree
4 52 (7.12%) DV Cleared
5 39 (5.34%) BPSS Clearance
6 18 (2.47%) CREST Certified
7 17 (2.33%) AWS Certification
7 17 (2.33%) Master's Degree
7 17 (2.33%) PhD
8 16 (2.19%) GIAC
9 14 (1.92%) Computer Science Degree
10 13 (1.78%) Microsoft Certification
11 11 (1.51%) Azure Certification
11 11 (1.51%) Cisco Certification
12 9 (1.23%) CCNA
13 8 (1.10%) CCNP
14 7 (0.96%) AWS Certified Solutions Architect
15 6 (0.82%) MCP
15 6 (0.82%) MCSE
16 4 (0.55%) GCFA
Quality Assurance & Compliance
1 97 (13.29%) QA
2 16 (2.19%) NIST
3 13 (1.78%) NIST 800
3 13 (1.78%) SEPA
4 12 (1.64%) ISO/IEC 27001
5 10 (1.37%) Accessibility
6 7 (0.96%) NCSC
7 6 (0.82%) GAAP
8 5 (0.68%) Cyber Essentials
9 4 (0.55%) Data Quality
10 3 (0.41%) Cyber Essentials PLUS
10 3 (0.41%) GDPR
10 3 (0.41%) WCAG
11 2 (0.27%) Government Security Classifications
11 2 (0.27%) ISO/IEC 27005
12 1 (0.14%) HMG Security Policy Framework
12 1 (0.14%) ISO/IEC 20000
12 1 (0.14%) ISO/IEC 27002 (supersedes ISO/IEC 17799)
12 1 (0.14%) JTAG
12 1 (0.14%) PCI DSS
System Software
1 142 (19.45%) Docker
2 16 (2.19%) Active Directory
3 15 (2.05%) VMware Infrastructure
4 14 (1.92%) Virtual Machines
5 9 (1.23%) HDFS
6 7 (0.96%) Hyper-V
7 6 (0.82%) vSphere
8 5 (0.68%) Citrix Hypervisor
9 4 (0.55%) Postfix
10 3 (0.41%) LXC
11 2 (0.27%) Ceph
11 2 (0.27%) Firmware
11 2 (0.27%) Kamailio
11 2 (0.27%) Virtual Desktop
11 2 (0.27%) Virtual Servers
11 2 (0.27%) VMware ESXi
12 1 (0.14%) Apache Flume
12 1 (0.14%) Gluster
12 1 (0.14%) KVM
12 1 (0.14%) Shibboleth
Systems Management
1 220 (30.14%) Kubernetes
2 125 (17.12%) Terraform
3 55 (7.53%) Ansible
4 26 (3.56%) Puppet
5 20 (2.74%) Grafana
6 15 (2.05%) Progress Chef
7 12 (1.64%) Nagios
8 11 (1.51%) Single Sign-On
9 9 (1.23%) ZABBIX
10 8 (1.10%) Consul
10 8 (1.10%) Kibana
10 8 (1.10%) Prometheus
11 7 (0.96%) Packer
11 7 (0.96%) Red Hat Spacewalk
12 6 (0.82%) Argo
12 6 (0.82%) Cacti
12 6 (0.82%) CSIRT
12 6 (0.82%) Oozie
13 3 (0.41%) Oracle RMAN
14 2 (0.27%) MIIS
Vendors
1 82 (11.23%) Oracle
2 75 (10.27%) Microsoft
3 63 (8.63%) Google
4 33 (4.52%) Red Hat
5 19 (2.60%) Cisco
5 19 (2.60%) VMware
6 13 (1.78%) Palo Alto
7 12 (1.64%) ESRI
8 11 (1.51%) Juniper
8 11 (1.51%) Splunk
9 7 (0.96%) F5
9 7 (0.96%) Intel
10 6 (0.82%) CheckPoint
10 6 (0.82%) IBM
10 6 (0.82%) Infoblox
10 6 (0.82%) Mellanox
10 6 (0.82%) SolarWinds
11 5 (0.68%) Confluent
11 5 (0.68%) New Relic
11 5 (0.68%) SAP