API Integration Jobs

API Integration
UK

The table below provides summary statistics for permanent job vacancies requiring API Integration skills. It includes a benchmarking guide to the annual salaries offered in vacancies that cited API Integration over the 6 months leading up to 30 April 2025, comparing them to the same period in the previous two years.

6 months to
30 Apr 2025
Same period 2024 Same period 2023
Rank 345 528 680
Rank change year-on-year +183 +152 -177
Permanent jobs citing API Integration 402 399 321
As % of all permanent jobs advertised in the UK 0.77% 0.41% 0.31%
As % of the Processes & Methodologies category 0.83% 0.47% 0.32%
Number of salaries quoted 347 346 239
10th Percentile £40,000 £31,750 £42,250
25th Percentile £50,000 £45,000 £49,375
Median annual salary (50th Percentile) £75,000 £55,000 £65,000
Median % change year-on-year +36.36% -15.38% -13.33%
75th Percentile £93,750 £73,750 £82,500
90th Percentile £100,000 £85,000 £95,500
UK excluding London median annual salary £77,000 £50,000 £52,500
% change year-on-year +54.00% -4.76% -38.24%

All Process and Methodology Skills
UK

API Integration falls under the Processes and Methodologies category. For comparison with the information above, the following table provides summary statistics for all permanent job vacancies requiring process or methodology skills.

Permanent vacancies with a requirement for process or methodology skills 48,641 84,574 99,457
As % of all permanent jobs advertised in the UK 93.26% 86.00% 95.63%
Number of salaries quoted 26,531 59,798 58,397
10th Percentile £30,580 £29,000 £34,000
25th Percentile £42,500 £40,000 £45,000
Median annual salary (50th Percentile) £57,500 £55,000 £61,500
Median % change year-on-year +4.55% -10.57% +2.50%
75th Percentile £76,250 £72,500 £82,500
90th Percentile £98,750 £92,500 £100,000
UK excluding London median annual salary £52,500 £50,000 £55,000
% change year-on-year +5.00% -9.09% +4.76%

API Integration
Job Vacancy Trend

Job postings citing API Integration as a proportion of all IT jobs advertised.
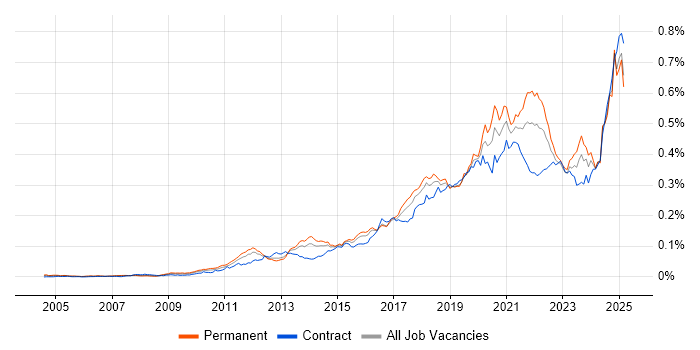
Job vacancy trend for API Integration in the UK

API Integration
Salary Trend

3-month moving average salary quoted in jobs citing API Integration.

Salary trend for API Integration in the UK

API Integration
Salary Histogram

Salary distribution for jobs citing API Integration over the 6 months to 30 April 2025.

Salary histogram for API Integration in the UK

API Integration
Top 17 Job Locations

The table below looks at the demand and provides a guide to the median salaries quoted in IT jobs citing API Integration within the UK over the 6 months to 30 April 2025. The 'Rank Change' column provides an indication of the change in demand within each location based on the same 6 month period last year.

Location Rank Change
on Same Period
Last Year
Matching
Permanent
IT Job Ads
Median Salary
Past 6 Months
Median Salary
% Change
on Same Period
Last Year
Live
Jobs
England +162 366 £75,000 +30.43% 238
UK excluding London +195 252 £77,000 +54.00% 117
Work from Home +140 130 £60,000 -7.69% 141
London +99 125 £69,750 -3.79% 126
South East +125 71 £82,500 +50.00% 22
North of England +68 58 £57,500 +27.78% 43
Midlands +69 51 £60,000 +20.00% 20
West Midlands +53 35 £57,500 +9.52% 6
South West +127 32 £51,779 -1.37% 15
North West +16 29 £57,500 +9.52% 26
East of England +52 26 £77,000 +116.90% 7
Yorkshire +72 25 £77,000 +92.50% 12
East Midlands +55 16 £77,000 +71.11% 14
Scotland +122 10 £45,000 -29.41% 3
North East +51 4 £63,500 +95.38% 5
Northern Ireland +37 3 £100,000 +128.57% 2
Wales +38 1 £52,500 -4.55% 6

API Integration
Co-occurring Skills and Capabilities by Category

The follow tables expand on the table above by listing co-occurrences grouped by category. The same employment type, locality and period is covered with up to 20 co-occurrences shown in each of the following categories:

Application Platforms
1 9 (2.24%) Confluence
2 6 (1.49%) SharePoint
3 4 (1.00%) CMS
4 3 (0.75%) OpenEdge
5 2 (0.50%) Umbraco
6 1 (0.25%) Apache
6 1 (0.25%) Apache Airflow
6 1 (0.25%) Headless CMS
6 1 (0.25%) IIS
6 1 (0.25%) Microsoft Exchange
Applications
1 4 (1.00%) Microsoft Excel
1 4 (1.00%) MS Visio
2 2 (0.50%) Adobe XD
2 2 (0.50%) Microsoft Office
3 1 (0.25%) Microsoft PowerPoint
3 1 (0.25%) Microsoft Project
Business Applications
1 27 (6.72%) NetSuite
2 13 (3.23%) Postilion
3 12 (2.99%) Oracle EBS
4 8 (1.99%) Dynamics CRM
5 3 (0.75%) Shopify
6 2 (0.50%) Payment Gateway
7 1 (0.25%) Elite 3E
7 1 (0.25%) Endur
7 1 (0.25%) Magento
7 1 (0.25%) SAP Hybris
Cloud Services
1 140 (34.83%) AWS
2 104 (25.87%) Azure
3 62 (15.42%) Azure DevOps
4 40 (9.95%) Azure Service Bus
5 36 (8.96%) Azure Cosmos DB
6 35 (8.71%) SonarCloud
7 26 (6.47%) SaaS
7 26 (6.47%) Serverless
8 22 (5.47%) Power Platform
9 21 (5.22%) GitHub
9 21 (5.22%) Microsoft 365
10 17 (4.23%) Cloud Computing
11 11 (2.74%) Azure Logic Apps
11 11 (2.74%) Datadog
12 10 (2.49%) Snowflake
13 9 (2.24%) Power Automate
13 9 (2.24%) PowerApps
14 7 (1.74%) GCP
15 6 (1.49%) AWS CloudFormation
15 6 (1.49%) Entra ID
Communications & Networking
1 28 (6.97%) HTTP
2 13 (3.23%) ATM
3 7 (1.74%) SSL
3 7 (1.74%) VPN
4 4 (1.00%) HTTPS
5 3 (0.75%) Firewall
5 3 (0.75%) Network Security
6 2 (0.50%) Internet
6 2 (0.50%) TCP/IP
7 1 (0.25%) BGP
7 1 (0.25%) DNS
7 1 (0.25%) Ethernet
7 1 (0.25%) Modbus
7 1 (0.25%) MQTT
7 1 (0.25%) SNMP
7 1 (0.25%) SWIFTNet
7 1 (0.25%) VLAN
7 1 (0.25%) Wireless
Database & Business Intelligence
1 43 (10.70%) SQL Server
2 35 (8.71%) Elasticsearch
3 17 (4.23%) MongoDB
4 16 (3.98%) Power BI
5 11 (2.74%) PostgreSQL
6 8 (1.99%) Amazon QuickSight
6 8 (1.99%) MySQL
7 7 (1.74%) Tableau
8 6 (1.49%) NoSQL
8 6 (1.49%) SQL Server Integration Services
9 5 (1.24%) Electronic Patient Records
9 5 (1.24%) FileMaker
9 5 (1.24%) SQL Server Reporting Services
10 4 (1.00%) GIS
11 3 (0.75%) Azure SQL Database
11 3 (0.75%) Data Lake
11 3 (0.75%) Data Warehouse
11 3 (0.75%) Relational Database
12 2 (0.50%) Power Query
13 1 (0.25%) Amazon Aurora
Development Applications
1 90 (22.39%) Git
2 43 (10.70%) Visual Studio
3 36 (8.96%) MSBuild
3 36 (8.96%) Octopus Deploy
4 35 (8.71%) Team Foundation Server
5 33 (8.21%) JIRA
6 10 (2.49%) NUnit
6 10 (2.49%) PowerBuilder
7 8 (1.99%) JUnit
8 7 (1.74%) Postman
9 6 (1.49%) Mocha
10 5 (1.24%) Bitbucket
10 5 (1.24%) Selenium
11 4 (1.00%) webpack
11 4 (1.00%) WiX
12 3 (0.75%) Atlassian Bamboo
12 3 (0.75%) Cypress.io
12 3 (0.75%) Jenkins
13 2 (0.50%) git-flow
13 2 (0.50%) Xcode
General
1 94 (23.38%) Social Skills
2 73 (18.16%) Finance
3 47 (11.69%) Banking
4 43 (10.70%) Retail
5 39 (9.70%) Analytical Skills
6 18 (4.48%) Inclusion and Diversity
6 18 (4.48%) Legal
7 14 (3.48%) Public Sector
8 11 (2.74%) Documentation Skills
8 11 (2.74%) Manufacturing
9 10 (2.49%) Aerospace
9 10 (2.49%) Investment Banking
10 9 (2.24%) Front Office
10 9 (2.24%) Retail Banking
11 8 (1.99%) Electronics
12 7 (1.74%) Advertising
12 7 (1.74%) Agriculture
13 6 (1.49%) Health Technology
14 5 (1.24%) Marketing
15 4 (1.00%) Law
Job Titles
1 98 (24.38%) Developer
2 82 (20.40%) Machine Learning Engineer
3 59 (14.68%) Architect
4 52 (12.94%) Lead
5 37 (9.20%) Senior
6 36 (8.96%) Technical Architect
7 23 (5.72%) Consultant
8 22 (5.47%) Senior Developer
9 21 (5.22%) NetSuite Consultant
9 21 (5.22%) Solutions Architect
9 21 (5.22%) Technical Consultant
10 19 (4.73%) .NET Developer
11 17 (4.23%) Analyst
11 17 (4.23%) C# Developer
11 17 (4.23%) Graduate
12 16 (3.98%) Software Engineer
13 15 (3.73%) Payments Architect
13 15 (3.73%) Payments Solutions Architect
13 15 (3.73%) Systems Engineer
13 15 (3.73%) Technical Leader
Libraries, Frameworks & Software Standards
1 98 (24.38%) .NET
2 90 (22.39%) REST
3 85 (21.14%) HTML
4 66 (16.42%) CSS
5 65 (16.17%) XML
6 57 (14.18%) SOAP
7 56 (13.93%) React
8 55 (13.68%) JSON
9 46 (11.44%) ASP.NET
9 46 (11.44%) RESTful
10 39 (9.70%) Bootstrap
11 35 (8.71%) gRPC
12 30 (7.46%) GraphQL
13 22 (5.47%) Kafka
13 22 (5.47%) Node.js
13 22 (5.47%) Web Services
14 21 (5.22%) .NET Framework
14 21 (5.22%) Restlet
15 17 (4.23%) AngularJS
16 15 (3.73%) Jest
Miscellaneous
1 25 (6.22%) Product Ownership
2 23 (5.72%) Legacy Systems
3 21 (5.22%) Mobile App
4 17 (4.23%) Hackathon
4 17 (4.23%) Learning Management System
5 15 (3.73%) Cloud Native
6 13 (3.23%) IBM Mainframe
6 13 (3.23%) Mainframe
7 10 (2.49%) Greenfield Project
7 10 (2.49%) Reinsurance
8 9 (2.24%) NHS
9 8 (1.99%) Onboarding
9 8 (1.99%) Robotics
9 8 (1.99%) SCADA
10 7 (1.74%) Data Structures
11 6 (1.49%) CMDB
11 6 (1.49%) Management Information System
11 6 (1.49%) Security Operations Centre
11 6 (1.49%) Security Posture
11 6 (1.49%) Self-Motivation
Operating Systems
1 13 (3.23%) Linux
1 13 (3.23%) zOS
2 6 (1.49%) Windows
3 4 (1.00%) Android
3 4 (1.00%) Apple iOS
3 4 (1.00%) Mac OS
3 4 (1.00%) Windows 10
4 3 (0.75%) Solaris
5 2 (0.50%) Unix
5 2 (0.50%) Windows Server
6 1 (0.25%) Windows Server 2008
6 1 (0.25%) Windows Server 2019
Processes & Methodologies
1 133 (33.08%) Problem-Solving
2 120 (29.85%) DevOps
3 116 (28.86%) Artificial Intelligence
4 94 (23.38%) Agile
5 91 (22.64%) Decision-Making
6 90 (22.39%) Task Automation
7 89 (22.14%) Workflow
8 88 (21.89%) Microservices
9 86 (21.39%) Machine Learning
10 82 (20.40%) Generative AI
10 82 (20.40%) LLM
11 72 (17.91%) API Development
12 65 (16.17%) CI/CD
13 48 (11.94%) Code Quality
13 48 (11.94%) Software Engineering
14 47 (11.69%) Design Patterns
15 43 (10.70%) MVC
16 40 (9.95%) Performance Optimisation
17 39 (9.70%) Event-Driven
18 38 (9.45%) Event-Driven Architecture
Programming Languages
1 147 (36.57%) Python
2 136 (33.83%) JavaScript
3 123 (30.60%) C#
4 100 (24.88%) SQL
5 39 (9.70%) Java
6 20 (4.98%) Kotlin
7 18 (4.48%) TypeScript
8 15 (3.73%) PowerShell
9 10 (2.49%) PHP
10 8 (1.99%) Bash
10 8 (1.99%) C
10 8 (1.99%) R
11 7 (1.74%) Apex Code
12 6 (1.49%) T-SQL
13 4 (1.00%) C++
14 3 (0.75%) OpenEdge ABL
14 3 (0.75%) Perl
14 3 (0.75%) Progress 4GL
14 3 (0.75%) Ruby
14 3 (0.75%) VB
Qualifications
1 64 (15.92%) Degree
2 34 (8.46%) Computer Science Degree
3 26 (6.47%) Security Cleared
4 25 (6.22%) SC Cleared
5 22 (5.47%) Master's Degree
6 17 (4.23%) PhD
7 9 (2.24%) Numerate Degree
8 8 (1.99%) Azure Certification
9 4 (1.00%) CISSP
10 3 (0.75%) AWS Certification
10 3 (0.75%) AWS Certified Solutions Architect
10 3 (0.75%) TOGAF Certification
11 2 (0.50%) A+ Certification
11 2 (0.50%) CEH
11 2 (0.50%) CISM
11 2 (0.50%) CompTIA Security+
11 2 (0.50%) GIAC
11 2 (0.50%) ISSAP
11 2 (0.50%) Microsoft Certification
11 2 (0.50%) SANS
Quality Assurance & Compliance
1 42 (10.45%) GDPR
2 10 (2.49%) Def Stans
2 10 (2.49%) SLA
3 6 (1.49%) Accessibility
3 6 (1.49%) QA
4 5 (1.24%) HL7
4 5 (1.24%) SNOMED CT
5 3 (0.75%) ISO/IEC 27001
5 3 (0.75%) NIST
5 3 (0.75%) Sarbanes-Oxley
5 3 (0.75%) WCAG
6 2 (0.50%) COBIT
6 2 (0.50%) Cyber Essentials
6 2 (0.50%) Cyber Essentials PLUS
6 2 (0.50%) Data Quality
6 2 (0.50%) PCI DSS
6 2 (0.50%) SOC 2
7 1 (0.25%) Government Security Classifications
7 1 (0.25%) ISO 20022
7 1 (0.25%) RMADS
System Software
1 62 (15.42%) Docker
2 6 (1.49%) Active Directory
Systems Management
1 29 (7.21%) Kubernetes
2 11 (2.74%) Grafana
2 11 (2.74%) Prometheus
3 8 (1.99%) Terraform
4 7 (1.74%) Ansible
5 4 (1.00%) Microsoft Intune
6 2 (0.50%) Graylog
6 2 (0.50%) Progress Chef
6 2 (0.50%) Puppet
7 1 (0.25%) Red Hat Satellite
7 1 (0.25%) SCCM
7 1 (0.25%) WMI
7 1 (0.25%) WSUS
Vendors
1 79 (19.65%) Microsoft
2 33 (8.21%) IBM
3 26 (6.47%) Google
4 18 (4.48%) Oracle
5 12 (2.99%) Databricks
5 12 (2.99%) Salesforce
6 11 (2.74%) VMware
7 8 (1.99%) Okta
7 8 (1.99%) ServiceNow
8 7 (1.74%) MuleSoft
9 6 (1.49%) Splunk
10 5 (1.24%) SAP
11 3 (0.75%) Progress
11 3 (0.75%) Red Hat
11 3 (0.75%) Sage
12 2 (0.50%) Adobe
12 2 (0.50%) Snow
13 1 (0.25%) Intapp
13 1 (0.25%) Ping Identity
13 1 (0.25%) UiPath