Power Automate Jobs

Microsoft Power Automate (Formerly Microsoft Flow)
UK

The table below provides summary statistics for permanent job vacancies requiring Power Automate skills. It includes a benchmarking guide to the annual salaries offered in vacancies that cited Power Automate over the 6 months leading up to 26 April 2025, comparing them to the same period in the previous two years.

6 months to
26 Apr 2025
Same period 2024 Same period 2023
Rank 309 326 544
Rank change year-on-year +17 +218 +191
Permanent jobs citing Power Automate 459 876 531
As % of all permanent jobs advertised in the UK 0.89% 0.89% 0.50%
As % of the Cloud Services category 3.03% 2.48% 1.17%
Number of salaries quoted 362 667 439
10th Percentile £38,125 £36,365 £36,125
25th Percentile £47,000 £43,750 £47,500
Median annual salary (50th Percentile) £57,500 £55,000 £57,500
Median % change year-on-year +4.55% -4.35% +4.55%
75th Percentile £72,500 £67,500 £70,625
90th Percentile £87,375 £80,000 £80,000
UK excluding London median annual salary £52,500 £52,500 £50,000
% change year-on-year - +5.00% +20.48%

All Cloud Skills
UK

Power Automate falls under the Cloud Services category. For comparison with the information above, the following table provides summary statistics for all permanent job vacancies requiring cloud computing skills.

Permanent vacancies with a requirement for cloud computing skills 15,150 35,329 45,391
As % of all permanent jobs advertised in the UK 29.36% 35.99% 43.16%
Number of salaries quoted 11,082 26,785 29,604
10th Percentile £31,250 £30,000 £35,000
25th Percentile £45,000 £41,250 £46,250
Median annual salary (50th Percentile) £61,644 £57,500 £65,000
Median % change year-on-year +7.21% -11.54% +4.00%
75th Percentile £83,750 £77,500 £85,000
90th Percentile £103,750 £96,250 £102,500
UK excluding London median annual salary £55,000 £50,000 £55,000
% change year-on-year +10.00% -9.09% +4.76%

Power Automate
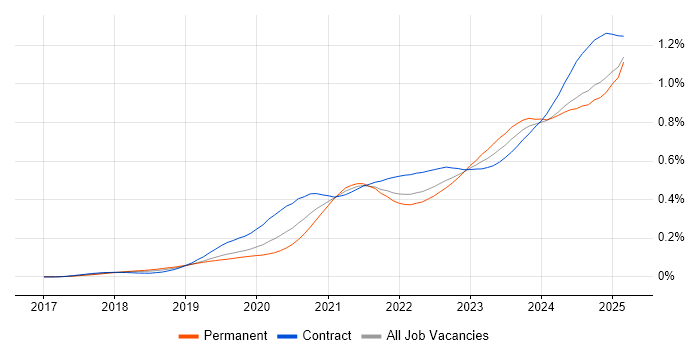
Job Vacancy Trend

Job postings citing Power Automate as a proportion of all IT jobs advertised.

Job vacancy trend for Power Automate in the UK

Power Automate
Salary Trend

3-month moving average salary quoted in jobs citing Power Automate.

Salary trend for Power Automate in the UK

Power Automate
Salary Histogram

Salary distribution for jobs citing Power Automate over the 6 months to 26 April 2025.

Salary histogram for Power Automate in the UK

Power Automate
Top 16 Job Locations

The table below looks at the demand and provides a guide to the median salaries quoted in IT jobs citing Power Automate within the UK over the 6 months to 26 April 2025. The 'Rank Change' column provides an indication of the change in demand within each location based on the same 6 month period last year.

Location Rank Change
on Same Period
Last Year
Matching
Permanent
IT Job Ads
Median Salary
Past 6 Months
Median Salary
% Change
on Same Period
Last Year
Live
Jobs
England -13 419 £57,500 +4.55% 305
UK excluding London +36 263 £52,500 - 166
Work from Home +52 209 £55,000 - 201
London +33 161 £70,000 +12.00% 164
South East +79 78 £57,500 +4.55% 35
Midlands +46 65 £52,500 -4.55% 35
West Midlands +42 58 £51,925 -5.59% 25
North of England -21 48 £52,500 +10.53% 53
South West +55 33 £57,500 +9.52% 11
Yorkshire +38 27 £55,000 +4.76% 10
East of England +40 26 £50,000 - 19
North West -20 20 £52,500 +10.53% 31
Scotland +116 9 £50,445 +18.69% 8
East Midlands +55 7 £55,000 +4.76% 9
Wales +32 4 £49,000 -6.55% 3
North East +35 1 £60,000 +21.21% 12

Power Automate
Co-occurring Skills and Capabilities by Category

The follow tables expand on the table above by listing co-occurrences grouped by category. The same employment type, locality and period is covered with up to 20 co-occurrences shown in each of the following categories:

Application Platforms
1 182 (39.65%) SharePoint
2 33 (7.19%) Microsoft Exchange
3 4 (0.87%) SharePoint Server
4 3 (0.65%) IIS
4 3 (0.65%) Tomcat
5 1 (0.22%) CMS
5 1 (0.22%) Confluence
5 1 (0.22%) Umbraco
Applications
1 33 (7.19%) Microsoft Office
2 24 (5.23%) Microsoft Excel
3 7 (1.53%) Chatbot
4 3 (0.65%) Microsoft PowerPoint
4 3 (0.65%) MS Visio
5 2 (0.44%) Trello
Business Applications
1 105 (22.88%) Dynamics CRM
2 6 (1.31%) Elite 3E
3 4 (0.87%) Salesforce CRM
4 3 (0.65%) Dynamics AX
5 2 (0.44%) Dynamics GP
5 2 (0.44%) Dynamics NAV
5 2 (0.44%) Sparx Enterprise Architect
6 1 (0.22%) Aladdin
6 1 (0.22%) Bloomberg AIM
6 1 (0.22%) Carpe Diem
6 1 (0.22%) thinkFolio
Cloud Services
1 377 (82.14%) Power Platform
2 306 (66.67%) PowerApps
3 269 (58.61%) Azure
4 175 (38.13%) Dynamics 365
5 129 (28.10%) Microsoft 365
6 66 (14.38%) Azure Logic Apps
7 57 (12.42%) Azure DevOps
8 39 (8.50%) Entra ID
9 35 (7.63%) Serverless
10 34 (7.41%) Azure Functions
11 33 (7.19%) Azure Data Factory
12 30 (6.54%) OneDrive
13 19 (4.14%) Microsoft Copilot
14 18 (3.92%) GitHub
15 17 (3.70%) Azure Service Bus
16 16 (3.49%) Snowflake
17 13 (2.83%) PaaS
18 11 (2.40%) IaaS
18 11 (2.40%) SaaS
19 10 (2.18%) AWS
Communications & Networking
1 16 (3.49%) DNS
2 15 (3.27%) DHCP
2 15 (3.27%) Firewall
2 15 (3.27%) TCP/IP
3 9 (1.96%) Intranet
4 3 (0.65%) DMARC
4 3 (0.65%) SSL
4 3 (0.65%) Wi-Fi
5 2 (0.44%) ADSL
5 2 (0.44%) Internet
5 2 (0.44%) VPN
6 1 (0.22%) SD-WAN
6 1 (0.22%) WAN
Database & Business Intelligence
1 211 (45.97%) Power BI
2 69 (15.03%) SQL Server
3 46 (10.02%) SQL Server Reporting Services
4 37 (8.06%) Data Warehouse
5 31 (6.75%) Data Lake
6 27 (5.88%) SQL Server Integration Services
7 26 (5.66%) Big Data
7 26 (5.66%) Tableau
8 13 (2.83%) Power Query
9 10 (2.18%) Star Schema
10 6 (1.31%) Azure SQL Database
10 6 (1.31%) Metadata
11 4 (0.87%) FileMaker
11 4 (0.87%) Microsoft Analysis Services
11 4 (0.87%) PostgreSQL
11 4 (0.87%) Relational Database
11 4 (0.87%) SQL Server Analysis Services
12 3 (0.65%) BusinessObjects
12 3 (0.65%) Metadata Repository
12 3 (0.65%) Spark SQL
Development Applications
1 23 (5.01%) JIRA
2 15 (3.27%) Git
3 10 (2.18%) SQL Server Management Studio (SSMS)
4 8 (1.74%) Postman
5 7 (1.53%) Selenium
6 5 (1.09%) Visual Studio
7 4 (0.87%) Visual Studio Code
8 3 (0.65%) Cypress.io
8 3 (0.65%) JMeter
8 3 (0.65%) Mocha
8 3 (0.65%) MSTest
8 3 (0.65%) NUnit
8 3 (0.65%) SoapUI
8 3 (0.65%) SpecFlow
9 2 (0.44%) ERwin
9 2 (0.44%) Jenkins
10 1 (0.22%) gulp
10 1 (0.22%) RStudio
10 1 (0.22%) Yeoman
General
1 134 (29.19%) Social Skills
2 66 (14.38%) Finance
3 52 (11.33%) Law
4 43 (9.37%) Analytical Skills
5 42 (9.15%) Inclusion and Diversity
6 32 (6.97%) Legal
7 24 (5.23%) Marketing
7 24 (5.23%) Retail
8 23 (5.01%) Public Sector
9 9 (1.96%) Banking
9 9 (1.96%) Documentation Skills
9 9 (1.96%) Local Government
10 8 (1.74%) Police
11 6 (1.31%) Advertising
11 6 (1.31%) Presentation Skills
12 5 (1.09%) Organisational Skills
13 3 (0.65%) Czech Language
13 3 (0.65%) Games
13 3 (0.65%) Influencing Skills
13 3 (0.65%) Manufacturing
Job Titles
1 209 (45.53%) Developer
2 84 (18.30%) Power Platform Developer
3 65 (14.16%) Lead
4 48 (10.46%) Senior
5 42 (9.15%) Dynamics 365 Developer
6 34 (7.41%) Senior Developer
7 31 (6.75%) Architect
7 31 (6.75%) CRM Developer
8 27 (5.88%) Analyst
8 27 (5.88%) Consultant
9 22 (4.79%) Microsoft Developer
10 19 (4.14%) Dynamics 365 CRM Developer
11 17 (3.70%) SharePoint Developer
12 16 (3.49%) Business Developer
12 16 (3.49%) Dynamics CRM Developer
12 16 (3.49%) IT Support
13 15 (3.27%) Business Intelligence Developer
13 15 (3.27%) Dynamics 365 Consultant
13 15 (3.27%) Lead Developer
13 15 (3.27%) Solutions Architect
Libraries, Frameworks & Software Standards
1 103 (22.44%) .NET
2 48 (10.46%) HTML
3 43 (9.37%) CSS
4 32 (6.97%) XML
5 27 (5.88%) JSON
6 24 (5.23%) ASP.NET
7 23 (5.01%) HTML5 Canvas
8 21 (4.58%) ASP.NET Web API
8 21 (4.58%) REST
9 19 (4.14%) React
9 19 (4.14%) Web Services
10 18 (3.92%) .NET Framework
11 17 (3.70%) SPFx
12 16 (3.49%) PySpark
13 15 (3.27%) SOAP
14 11 (2.40%) AngularJS
14 11 (2.40%) RESTful
15 9 (1.96%) HTML5
16 8 (1.74%) .NET Core
17 7 (1.53%) WCF
Miscellaneous
1 33 (7.19%) Management Information System
2 25 (5.45%) Low-Code
3 12 (2.61%) Product Ownership
4 10 (2.18%) Cyber Threat
4 10 (2.18%) Legacy Applications
5 9 (1.96%) Cloud Native
5 9 (1.96%) Data Structures
5 9 (1.96%) Enterprise Software
6 8 (1.74%) Legacy Systems
6 8 (1.74%) Onboarding
6 8 (1.74%) Self-Motivation
7 7 (1.53%) Client/Server
7 7 (1.53%) Robotics
8 6 (1.31%) Mobile App
9 5 (1.09%) Social Media
10 2 (0.44%) IoT
10 2 (0.44%) Tandem
10 2 (0.44%) Team-Oriented Environment
11 1 (0.22%) Data Fabric
11 1 (0.22%) Security Posture
Operating Systems
1 23 (5.01%) Windows
2 12 (2.61%) Windows Server
3 3 (0.65%) Linux
3 3 (0.65%) Unix
4 1 (0.22%) Windows 10
Processes & Methodologies
1 204 (44.44%) Business Intelligence
2 131 (28.54%) Problem-Solving
3 125 (27.23%) CRM
4 87 (18.95%) DevOps
5 76 (16.56%) Agile
5 76 (16.56%) Customer Service
6 68 (14.81%) Analytics
7 67 (14.60%) Project Management
8 53 (11.55%) Mentoring
9 51 (11.11%) Data Integration
10 47 (10.24%) Data Engineering
11 46 (10.02%) Artificial Intelligence
12 45 (9.80%) ETL
13 44 (9.59%) Data Analysis
13 44 (9.59%) Data Governance
14 42 (9.15%) Data Management
15 41 (8.93%) Service Management
16 40 (8.71%) CI/CD
16 40 (8.71%) Data Modelling
17 38 (8.28%) Stakeholder Management
Programming Languages
1 147 (32.03%) SQL
2 145 (31.59%) C#
3 134 (29.19%) JavaScript
4 91 (19.83%) PowerShell
5 39 (8.50%) Python
6 32 (6.97%) TypeScript
7 22 (4.79%) Java
8 19 (4.14%) T-SQL
9 11 (2.40%) Data Analysis Expressions
10 10 (2.18%) VB.NET
11 8 (1.74%) VBA
12 3 (0.65%) Bicep
12 3 (0.65%) R
12 3 (0.65%) VB
12 3 (0.65%) VBScript
13 1 (0.22%) Apex Code
13 1 (0.22%) Formula Language
13 1 (0.22%) Groovy
13 1 (0.22%) X++
Qualifications
1 81 (17.65%) Degree
2 54 (11.76%) Microsoft Certification
3 24 (5.23%) Security Cleared
4 20 (4.36%) SC Cleared
5 11 (2.40%) Computer Science Degree
6 8 (1.74%) Azure Certification
7 4 (0.87%) DBS Check
7 4 (0.87%) DV Cleared
7 4 (0.87%) HND
8 3 (0.65%) ISTQB
8 3 (0.65%) ISTQB Foundation Certification
9 2 (0.44%) ACCA
9 2 (0.44%) TOGAF Certification
10 1 (0.22%) CCNP
10 1 (0.22%) Cisco Certification
10 1 (0.22%) MCP
10 1 (0.22%) MCSA
10 1 (0.22%) MCSE
10 1 (0.22%) MCT
10 1 (0.22%) MOS
Quality Assurance & Compliance
1 43 (9.37%) Data Quality
2 29 (6.32%) QA
3 26 (5.66%) GDPR
4 7 (1.53%) ISO/IEC 27001
5 5 (1.09%) Cyber Essentials
6 3 (0.65%) SLA
7 2 (0.44%) COBIT
8 1 (0.22%) Accessibility
8 1 (0.22%) AIFMD
8 1 (0.22%) Cyber Essentials PLUS
8 1 (0.22%) GRC
8 1 (0.22%) PCI DSS
8 1 (0.22%) PMO
8 1 (0.22%) UCITS
System Software
1 26 (5.66%) Active Directory
2 15 (3.27%) Virtual Machines
3 3 (0.65%) Docker
3 3 (0.65%) Hyper-V
3 3 (0.65%) VMware Infrastructure
4 1 (0.22%) Virtual Desktop
Systems Management
1 25 (5.45%) Microsoft Intune
2 20 (4.36%) SCCM
3 18 (3.92%) Single Sign-On
4 2 (0.44%) Terraform
5 1 (0.22%) Active Directory Federation Services
5 1 (0.22%) Ansible
5 1 (0.22%) Nessus
5 1 (0.22%) WSUS
Vendors
1 352 (76.69%) Microsoft
2 33 (7.19%) ServiceNow
3 12 (2.61%) Google
3 12 (2.61%) UiPath
4 9 (1.96%) Databricks
4 9 (1.96%) OpenAI
5 7 (1.53%) Intapp
5 7 (1.53%) Salesforce
6 6 (1.31%) iManage
7 5 (1.09%) Apple
8 4 (0.87%) Blue Prism
8 4 (0.87%) Oracle
8 4 (0.87%) VMware
8 4 (0.87%) Xero
8 4 (0.87%) Zoho
9 3 (0.65%) Aderant
9 3 (0.65%) Cisco
9 3 (0.65%) Meraki
10 2 (0.44%) BiZZdesign
10 2 (0.44%) Kofax