Amazon Simple Storage Service (S3)
UK

The following table provides summary statistics for permanent job vacancies with a requirement for Amazon S3 skills. Included is a benchmarking guide to the salaries offered in vacancies that have cited Amazon S3 over the 6 months to 29 November 2023 with a comparison to the same period in the previous 2 years.

6 months to
29 Nov 2023
Same period 2022 Same period 2021
Rank 402 332 260
Rank change year-on-year -70 -72 +57
Permanent jobs citing Amazon S3 364 1,390 1,847
As % of all permanent jobs advertised in the UK 0.67% 1.10% 1.43%
As % of the Cloud Services category 1.57% 2.56% 3.06%
Number of salaries quoted 305 842 1,017
10th Percentile £47,500 £47,500 £47,500
25th Percentile £53,750 £57,500 £58,750
Median annual salary (50th Percentile) £70,000 £75,000 £77,500
Median % change year-on-year -6.67% -3.23% +10.71%
75th Percentile £80,000 £95,000 £95,000
90th Percentile £97,000 £120,000 £126,250
UK excluding London median annual salary £62,500 £65,000 £62,500
% change year-on-year -3.85% +4.00% +19.05%

All Cloud Skills
UK

Amazon S3 is in the Cloud Services category. The following table is for comparison with the above and provides summary statistics for all permanent job vacancies with a requirement for cloud computing skills.

Permanent vacancies with a requirement for cloud computing skills 23,124 54,234 60,343
As % of all permanent jobs advertised in the UK 42.74% 43.10% 46.75%
Number of salaries quoted 18,249 36,158 42,211
10th Percentile £32,750 £34,500 £33,000
25th Percentile £45,000 £46,250 £43,750
Median annual salary (50th Percentile) £62,500 £63,000 £60,000
Median % change year-on-year -0.79% +5.00% +4.35%
75th Percentile £82,500 £85,000 £80,000
90th Percentile £100,000 £100,000 £97,500
UK excluding London median annual salary £53,351 £55,000 £52,500
% change year-on-year -3.00% +4.76% +5.00%

Amazon S3
Job Vacancy Trend

Job postings citing Amazon S3 as a proportion of all IT jobs advertised.
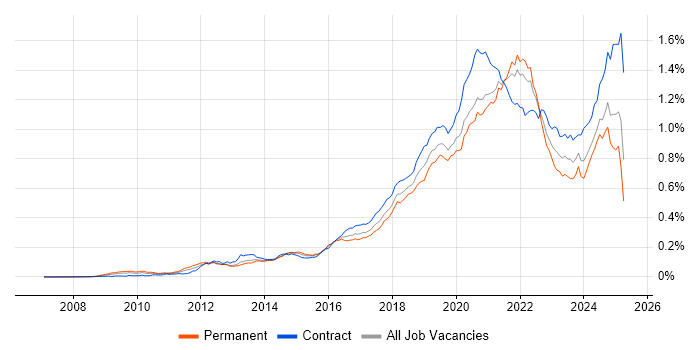
Job vacancy trend for Amazon S3 in the UK

Amazon S3
Salary Trend

3-month moving average salary quoted in jobs citing Amazon S3.

Salary trend for Amazon S3 in the UK

Amazon S3
Salary Histogram

Salary distribution for jobs citing Amazon S3 over the 6 months to 29 November 2023.

Salary histogram for Amazon S3 in the UK

Amazon S3
Top 16 Job Locations

The table below looks at the demand and provides a guide to the median salaries quoted in IT jobs citing Amazon S3 within the UK over the 6 months to 29 November 2023. The 'Rank Change' column provides an indication of the change in demand within each location based on the same 6 month period last year.

Location Rank Change
on Same Period
Last Year
Matching
Permanent
IT Job Ads
Median Salary
Past 6 Months
Median Salary
% Change
on Same Period
Last Year
Live
Jobs
England -58 330 £70,000 -6.67% 185
UK excluding London +78 181 £62,500 -3.85% 107
Work from Home -90 165 £65,000 -10.34% 103
London -107 143 £75,000 -9.09% 98
South West +95 52 £61,250 +11.36% 21
North of England +54 49 £55,000 -16.98% 31
North West +69 34 £55,000 -31.25% 13
South East +121 29 £67,500 +3.85% 25
Midlands +66 24 £70,000 +7.69% 10
West Midlands +105 20 £72,500 - 4
East of England +121 18 £72,500 -12.12% 9
Yorkshire +65 14 £75,000 +17.19% 9
Scotland +50 14 £60,000 +20.00% 10
East Midlands -1 4 £50,000 -23.08% 6
Wales +9 3 £70,000 +21.74% 3
North East +32 1 £55,000 -21.43% 9

Amazon S3
Co-occurring Skills and Capabilities by Category

The follow tables expand on the table above by listing co-occurrences grouped by category. The same employment type, locality and period is covered with up to 20 co-occurrences shown in each of the following categories:

Application Platforms
1 46 (12.64%) Apache Spark
2 31 (8.52%) Apache
3 18 (4.95%) nginx
4 16 (4.40%) Apache Airflow
5 13 (3.57%) Jupyter
6 7 (1.92%) WordPress
7 5 (1.37%) Confluence
8 4 (1.10%) SAS
8 4 (1.10%) SharePoint
9 3 (0.82%) OpenStack
9 3 (0.82%) Tomcat
10 2 (0.55%) MODX
10 2 (0.55%) MS Exchange
10 2 (0.55%) Oracle Workflow
10 2 (0.55%) Site Server
10 2 (0.55%) WebLogic
11 1 (0.27%) CMS
11 1 (0.27%) Luigi
Applications
1 4 (1.10%) Microsoft Office
2 2 (0.55%) Microsoft Excel
Business Applications
1 2 (0.55%) Salesforce CRM
2 1 (0.27%) Magento
Cloud Services
1 345 (94.78%) AWS
2 190 (52.20%) Amazon EC2
2 190 (52.20%) Serverless
3 181 (49.73%) AWS Lambda
4 92 (25.27%) AWS CloudFormation
5 82 (22.53%) Azure
6 62 (17.03%) Amazon ECS
7 47 (12.91%) Virtual Private Cloud
8 45 (12.36%) Amazon CloudWatch
8 45 (12.36%) GCP
9 32 (8.79%) Amazon EKS
10 30 (8.24%) SaaS
11 29 (7.97%) Amazon SQS
11 29 (7.97%) GitHub
12 28 (7.69%) CloudFront
13 27 (7.42%) Route 53
14 26 (7.14%) OpenShift
15 24 (6.59%) Amazon EMR
16 22 (6.04%) GitHub Actions
17 21 (5.77%) Snowflake
Communications & Networking
1 16 (4.40%) DNS
2 14 (3.85%) Firewall
3 12 (3.30%) TCP/IP
4 8 (2.20%) HTTP
4 8 (2.20%) Network Security
4 8 (2.20%) SSH
5 5 (1.37%) Internet
6 4 (1.10%) AMQP
6 4 (1.10%) HTTPS
6 4 (1.10%) VPN
7 3 (0.82%) FTP
7 3 (0.82%) IPv6
7 3 (0.82%) LAN
7 3 (0.82%) WAN
8 2 (0.55%) IP Telephony
8 2 (0.55%) SMTP
8 2 (0.55%) SNMP
8 2 (0.55%) tcpdump
8 2 (0.55%) Wireless
9 1 (0.27%) NAS
Database & Business Intelligence
1 143 (39.29%) Amazon RDS
2 82 (22.53%) Amazon Redshift
3 66 (18.13%) Big Data
4 62 (17.03%) PostgreSQL
5 60 (16.48%) DynamoDB
6 54 (14.84%) MySQL
7 41 (11.26%) Data Warehouse
7 41 (11.26%) Hadoop
8 32 (8.79%) Amazon Athena
8 32 (8.79%) NoSQL
9 26 (7.14%) MongoDB
10 25 (6.87%) Relational Database
11 23 (6.32%) Presto
12 20 (5.49%) Apache Hive
13 19 (5.22%) Redis
14 17 (4.67%) Elasticsearch
15 16 (4.40%) Amazon QuickSight
15 16 (4.40%) Data Lake
15 16 (4.40%) Power BI
16 13 (3.57%) SQL Server
Development Applications
1 88 (24.18%) Jenkins
2 77 (21.15%) Git
3 42 (11.54%) GitLab
4 36 (9.89%) JIRA
5 30 (8.24%) Cucumber
6 24 (6.59%) Atlassian Bamboo
6 24 (6.59%) Bitbucket
7 22 (6.04%) Artifactory
8 21 (5.77%) JUnit
9 19 (5.22%) SonarQube
10 13 (3.57%) Maven
11 8 (2.20%) TeamCity
12 6 (1.65%) CircleCI
12 6 (1.65%) ScalaTest
12 6 (1.65%) Sonatype Nexus
12 6 (1.65%) Travis CI
12 6 (1.65%) WebDriver
13 5 (1.37%) webpack
14 4 (1.10%) Browser DevTools
14 4 (1.10%) Subversion
General
1 86 (23.63%) Social Skills
2 45 (12.36%) Analytical Skills
3 36 (9.89%) Finance
4 24 (6.59%) Public Sector
5 15 (4.12%) Inclusion and Diversity
6 13 (3.57%) Front Office
6 13 (3.57%) Health Technology
7 12 (3.30%) Retail
8 10 (2.75%) Pharmaceutical
9 7 (1.92%) Presentation Skills
10 6 (1.65%) Law
11 5 (1.37%) Marketing
11 5 (1.37%) Publishing
12 4 (1.10%) Organisational Skills
13 3 (0.82%) Advertising
13 3 (0.82%) Banking
13 3 (0.82%) Billing
13 3 (0.82%) Tech for Good
14 2 (0.55%) Electronics
14 2 (0.55%) Manufacturing
Job Titles
1 93 (25.55%) DevOps Engineer
2 83 (22.80%) Developer
3 79 (21.70%) Data Engineer
4 55 (15.11%) AWS Engineer
5 45 (12.36%) Senior
6 30 (8.24%) Java Developer
7 28 (7.69%) AWS DevOps
8 27 (7.42%) AWS DevOps Engineer
9 24 (6.59%) Architect
10 23 (6.32%) Cloud Engineer
11 22 (6.04%) AWS Developer
12 19 (5.22%) Full Stack Developer
13 18 (4.95%) Solutions Architect
14 16 (4.40%) Python Engineer
14 16 (4.40%) Software Developer
15 15 (4.12%) AWS Data Engineer
15 15 (4.12%) Software Engineer
16 14 (3.85%) Data Architect
17 13 (3.57%) Kubernetes Engineer
17 13 (3.57%) Senior Data Engineer
Libraries, Frameworks & Software Standards
1 34 (9.34%) Node.js
2 33 (9.07%) REST
3 31 (8.52%) Kafka
3 31 (8.52%) Spring
4 28 (7.69%) Elastic Stack
5 26 (7.14%) CSS
6 25 (6.87%) RabbitMQ
7 23 (6.32%) React
8 22 (6.04%) AWS CDK
8 22 (6.04%) HTML
9 20 (5.49%) JSON
10 18 (4.95%) Middleware
11 17 (4.67%) YAML
12 16 (4.40%) AngularJS
13 12 (3.30%) ActiveMQ
13 12 (3.30%) Apache NiFi
13 12 (3.30%) AWS SAM
14 11 (3.02%) J2EE
14 11 (3.02%) Next.js
15 10 (2.75%) XML
Miscellaneous
1 25 (6.87%) Distributed Systems
2 22 (6.04%) Greenfield Project
3 18 (4.95%) Private Cloud
4 17 (4.67%) Public Cloud
5 16 (4.40%) Enterprise Software
6 14 (3.85%) Hybrid Cloud
7 13 (3.57%) Algorithms
7 13 (3.57%) Data Structures
7 13 (3.57%) Renewable Energy
8 12 (3.30%) Tandem
9 11 (3.02%) Linux Command Line
9 11 (3.02%) Onboarding
10 10 (2.75%) Cloud Native
11 6 (1.65%) Foreign Exchange (FX)
12 5 (1.37%) Management Information System
13 4 (1.10%) Enterprise Cloud
14 3 (0.82%) Clustering
14 3 (0.82%) Data Protection Act
14 3 (0.82%) IoT
14 3 (0.82%) Mobile App
Operating Systems
1 82 (22.53%) Linux
2 27 (7.42%) Windows
3 13 (3.57%) Unix
4 10 (2.75%) Mac OS
5 8 (2.20%) Windows Server
6 7 (1.92%) CentOS
7 3 (0.82%) Red Hat Enterprise Linux
7 3 (0.82%) Ubuntu
7 3 (0.82%) Windows Server 2019
8 2 (0.55%) VMS
9 1 (0.27%) Debian
9 1 (0.27%) Mac OS X
9 1 (0.27%) Solaris
Processes & Methodologies
1 165 (45.33%) DevOps
2 150 (41.21%) Agile
3 141 (38.74%) CI/CD
4 98 (26.92%) Infrastructure as Code
5 85 (23.35%) Software Engineering
6 77 (21.15%) Containerisation
6 77 (21.15%) Microservices
7 70 (19.23%) ETL
8 64 (17.58%) Data Engineering
9 63 (17.31%) Problem-Solving
10 58 (15.93%) Data Modelling
11 48 (13.19%) Analytics
12 46 (12.64%) Data Pipeline
13 43 (11.81%) Data Science
14 39 (10.71%) Computer Science
15 35 (9.62%) Mentoring
15 35 (9.62%) Test Automation
16 34 (9.34%) Business Intelligence
17 32 (8.79%) Deployment Automation
18 31 (8.52%) Data Transformation
Programming Languages
1 216 (59.34%) Python
2 123 (33.79%) Java
3 88 (24.18%) SQL
4 53 (14.56%) Bash
5 39 (10.71%) JavaScript
6 38 (10.44%) TypeScript
7 36 (9.89%) Shell Script
8 30 (8.24%) Go
9 25 (6.87%) Scala
10 22 (6.04%) Ruby
11 20 (5.49%) C#
12 16 (4.40%) PowerShell
13 14 (3.85%) Perl
14 13 (3.57%) Groovy
15 11 (3.02%) PHP
16 5 (1.37%) PL/SQL
16 5 (1.37%) R
17 4 (1.10%) C++
18 2 (0.55%) Rust
18 2 (0.55%) T-SQL
Qualifications
1 44 (12.09%) Security Cleared
2 41 (11.26%) Degree
3 31 (8.52%) Computer Science Degree
4 29 (7.97%) SC Cleared
5 25 (6.87%) AWS Certification
6 16 (4.40%) DV Cleared
7 12 (3.30%) Master's Degree
8 9 (2.47%) Azure Certification
9 7 (1.92%) AWS Certified DevOps Engineer
10 6 (1.65%) AWS Certified Solutions Architect
11 4 (1.10%) Microsoft Certification
12 3 (0.82%) Cisco Certification
13 2 (0.55%) AWS Certified Developer
13 2 (0.55%) BPSS Clearance
14 1 (0.27%) DBS Check
14 1 (0.27%) OCP
14 1 (0.27%) Oracle Certification
Quality Assurance & Compliance
1 23 (6.32%) QA
2 15 (4.12%) Data Quality
3 4 (1.10%) Accessibility
4 3 (0.82%) GDPR
4 3 (0.82%) PCI DSS
5 2 (0.55%) California Consumer Privacy Act
5 2 (0.55%) HIPAA
5 2 (0.55%) ISO/IEC 27001
5 2 (0.55%) Sarbanes-Oxley
5 2 (0.55%) SLA
6 1 (0.27%) Cyber Essentials
6 1 (0.27%) ISO 22301
6 1 (0.27%) NIST
System Software
1 130 (35.71%) Docker
2 13 (3.57%) Active Directory
3 4 (1.10%) Virtual Machines
4 3 (0.82%) VMware ESXi
4 3 (0.82%) VMware Infrastructure
5 2 (0.55%) Ceph
5 2 (0.55%) NFS
6 1 (0.27%) EMC RecoverPoint
6 1 (0.27%) Shibboleth
6 1 (0.27%) Slurm Workload Manager
Systems Management
1 144 (39.56%) Kubernetes
1 144 (39.56%) Terraform
2 55 (15.11%) Ansible
3 32 (8.79%) Grafana
4 30 (8.24%) Prometheus
5 18 (4.95%) Progress Chef
6 15 (4.12%) Packer
7 13 (3.57%) HAProxy
8 10 (2.75%) Puppet
9 8 (2.20%) Kibana
10 5 (1.37%) Microsoft Intune
10 5 (1.37%) Nagios
11 4 (1.10%) Salt
12 3 (0.82%) Docker Swarm
12 3 (0.82%) Mesos
12 3 (0.82%) vCenter Server
13 2 (0.55%) Hadoop YARN
13 2 (0.55%) Istio
13 2 (0.55%) Kustomize
13 2 (0.55%) Single Sign-On
Vendors
1 30 (8.24%) Oracle
2 26 (7.14%) Atlassian
3 17 (4.67%) Databricks
3 17 (4.67%) Microsoft
4 16 (4.40%) Google
5 12 (3.30%) IBM
5 12 (3.30%) SAP
6 9 (2.47%) AppDynamics
6 9 (2.47%) Dell
7 7 (1.92%) VMware
8 5 (1.37%) Cisco
8 5 (1.37%) Informatica
8 5 (1.37%) New Relic
8 5 (1.37%) Red Hat
9 4 (1.10%) Apple
9 4 (1.10%) Salesforce
10 3 (0.82%) Aruba
11 2 (0.55%) Remedy
11 2 (0.55%) Synopsys
11 2 (0.55%) TIBCO