Legal
UK

The table below looks at the prevalence of the term Legal in permanent job vacancies. Included is a benchmarking guide to the salaries offered in vacancies that cited Legal over the 6 months leading up to 30 April 2025, comparing them to the same period in the previous two years.

6 months to
30 Apr 2025
Same period 2024 Same period 2023
Rank 73 60 83
Rank change year-on-year -13 +23 +55
Permanent jobs citing Legal 1,858 3,845 4,074
As % of all permanent jobs advertised in the UK 3.56% 3.91% 3.92%
As % of the General category 5.28% 6.53% 5.71%
Number of salaries quoted 752 1,779 1,606
10th Percentile £32,050 £27,750 £31,250
25th Percentile £44,000 £36,000 £41,250
Median annual salary (50th Percentile) £57,000 £52,500 £55,000
Median % change year-on-year +8.57% -4.55% -
75th Percentile £80,000 £73,750 £72,500
90th Percentile £99,875 £90,000 £90,000
UK excluding London median annual salary £47,500 £45,000 £47,500
% change year-on-year +5.56% -5.26% -

All General Skills
UK

Legal falls under the General Skills category. For comparison with the information above, the following table provides summary statistics for all permanent job vacancies requiring common skills.

Permanent vacancies with a requirement for common skills 35,192 58,854 71,332
As % of all permanent jobs advertised in the UK 67.47% 59.84% 68.59%
Number of salaries quoted 18,374 39,596 38,382
10th Percentile £27,750 £27,500 £32,500
25th Percentile £41,250 £36,250 £43,750
Median annual salary (50th Percentile) £56,000 £52,500 £60,000
Median % change year-on-year +6.67% -12.50% -
75th Percentile £76,250 £72,500 £82,500
90th Percentile £100,000 £92,500 £101,250
UK excluding London median annual salary £50,055 £47,500 £52,500
% change year-on-year +5.38% -9.52% +5.00%

Legal
Job Vacancy Trend

Job postings citing Legal as a proportion of all IT jobs advertised.
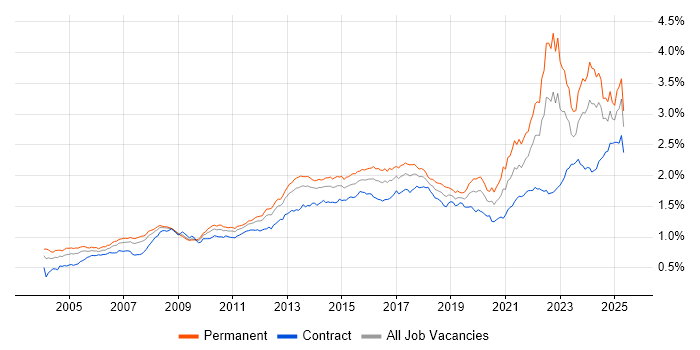
Job vacancy trend for Legal in the UK

Legal
Salary Trend

3-month moving average salary quoted in jobs citing Legal.

Salary trend for Legal in the UK

Legal
Salary Histogram

Salary distribution for jobs citing Legal over the 6 months to 30 April 2025.

Salary histogram for Legal in the UK

Legal
Top 19 Job Locations

The table below looks at the demand and provides a guide to the median salaries quoted in IT jobs citing Legal within the UK over the 6 months to 30 April 2025. The 'Rank Change' column provides an indication of the change in demand within each location based on the same 6 month period last year.

Location Rank Change
on Same Period
Last Year
Matching
Permanent
IT Job Ads
Median Salary
Past 6 Months
Median Salary
% Change
on Same Period
Last Year
Live
Jobs
England +6 1,694 £57,500 +10.58% 2,236
UK excluding London -19 1,137 £47,500 +5.56% 957
Work from Home +45 793 £57,000 +3.64% 1,161
London +5 633 £72,500 +7.41% 1,367
North of England -19 421 £45,000 - 292
North West -10 347 £44,000 -7.37% 182
South East +5 296 £52,500 +32.91% 202
Midlands -6 181 £45,000 -10.00% 158
West Midlands -19 121 £41,000 -18.00% 108
Scotland -49 73 £45,000 -30.77% 59
East of England -3 70 £52,500 +5.00% 71
Yorkshire -16 66 £45,000 +32.35% 81
East Midlands +20 60 £52,500 +16.67% 49
South West -3 60 £45,000 +5.88% 135
Northern Ireland +33 16 £87,500 +191.67% 22
Wales +21 15 £55,000 +18.19% 28
North East -13 8 £43,968 -16.25% 31
Channel Islands -1 4 £80,000 -5.88%
Isle of Man - 1 £54,000 - 4

Legal
Co-occurring Skills and Capabilities by Category

The follow tables expand on the table above by listing co-occurrences grouped by category. The same employment type, locality and period is covered with up to 20 co-occurrences shown in each of the following categories:

Application Platforms
1 77 (4.14%) SharePoint
2 64 (3.44%) Microsoft Exchange
3 33 (1.78%) CMS
4 21 (1.13%) SAS
5 7 (0.38%) WordPress
6 4 (0.22%) Drupal
6 4 (0.22%) Mule
7 3 (0.16%) Confluence
8 2 (0.11%) Apache Spark
8 2 (0.11%) IIS
8 2 (0.11%) nginx
8 2 (0.11%) Oracle SOA Suite
9 1 (0.054%) Headless CMS
9 1 (0.054%) Strapi
Applications
1 253 (13.62%) Microsoft Office
2 102 (5.49%) Microsoft Excel
3 60 (3.23%) Microsoft PowerPoint
4 12 (0.65%) Acrobat
5 10 (0.54%) Photoshop
6 9 (0.48%) Adobe Premiere
7 5 (0.27%) Adobe Creative Suite
7 5 (0.27%) Adobe Illustrator
7 5 (0.27%) InDesign
8 4 (0.22%) Chatbot
8 4 (0.22%) MS Visio
8 4 (0.22%) Spreadsheet
9 3 (0.16%) Microsoft Project
10 1 (0.054%) AutoCAD
10 1 (0.054%) Blender
10 1 (0.054%) CATIA
10 1 (0.054%) Oracle Smart View
10 1 (0.054%) Simulink
10 1 (0.054%) SOLIDWORKS
10 1 (0.054%) Stata
Business Applications
1 27 (1.45%) Elite 3E
2 10 (0.54%) Dynamics CRM
2 10 (0.54%) Dynamics NAV
3 6 (0.32%) Relativity
4 5 (0.27%) Remedy ITSM
4 5 (0.27%) SAP GTS
4 5 (0.27%) SAP S/4HANA
5 4 (0.22%) Teamcenter
6 3 (0.16%) Carpe Diem
6 3 (0.16%) Oracle Applications
6 3 (0.16%) SAP MDG
7 2 (0.11%) Infor LN
7 2 (0.11%) NetSuite
7 2 (0.11%) PeopleSoft Financials
7 2 (0.11%) Sage 200
7 2 (0.11%) Salesforce CRM
7 2 (0.11%) Visualfiles
8 1 (0.054%) Oracle EBS
8 1 (0.054%) Oracle ERP
8 1 (0.054%) SAP FI
Cloud Services
1 223 (12.00%) Azure
2 191 (10.28%) Microsoft 365
3 82 (4.41%) Power Platform
4 65 (3.50%) SaaS
5 56 (3.01%) AWS
6 50 (2.69%) Entra ID
7 43 (2.31%) OneDrive
8 36 (1.94%) GCP
9 32 (1.72%) Power Automate
10 30 (1.61%) Cloud Computing
11 25 (1.35%) PaaS
11 25 (1.35%) PowerApps
12 21 (1.13%) Microsoft Purview
13 16 (0.86%) IaaS
14 15 (0.81%) iPaaS
15 14 (0.75%) Google Workspace
15 14 (0.75%) Microsoft Copilot
16 12 (0.65%) Azure Data Factory
17 11 (0.59%) Dynamics 365
17 11 (0.59%) Serverless
Communications & Networking
1 67 (3.61%) Firewall
2 27 (1.45%) DNS
3 26 (1.40%) DHCP
4 24 (1.29%) VLAN
5 22 (1.18%) Network Security
5 22 (1.18%) TCP/IP
6 19 (1.02%) Intranet
7 18 (0.97%) VoIP
7 18 (0.97%) VPN
7 18 (0.97%) WAN
8 17 (0.91%) SAN
9 16 (0.86%) Internet
10 14 (0.75%) MPLS
11 13 (0.70%) Wi-Fi
12 12 (0.65%) LAN
13 10 (0.54%) Broadband
14 9 (0.48%) SD-WAN
15 6 (0.32%) Bluetooth
15 6 (0.32%) Intrusion Detection
15 6 (0.32%) WebEx
Database & Business Intelligence
1 64 (3.44%) Power BI
2 29 (1.56%) SQL Server
3 28 (1.51%) Metadata
4 26 (1.40%) Data Warehouse
5 18 (0.97%) SQL Server Reporting Services
6 14 (0.75%) Tableau
7 12 (0.65%) PostgreSQL
8 11 (0.59%) Data Lake
9 10 (0.54%) NoSQL
10 6 (0.32%) Oracle Reports
10 6 (0.32%) Relational Database
11 5 (0.27%) Looker
11 5 (0.27%) MS Access
12 4 (0.22%) EDRMS
12 4 (0.22%) Oracle Database
12 4 (0.22%) Power Query
13 3 (0.16%) Big Data
13 3 (0.16%) BigQuery
13 3 (0.16%) BusinessObjects
13 3 (0.16%) MySQL
Development Applications
1 41 (2.21%) JIRA
2 28 (1.51%) Rational DOORS
3 15 (0.81%) Git
4 12 (0.65%) Selenium
5 7 (0.38%) GitLab
6 4 (0.22%) Bazaar
7 3 (0.16%) AppScan
7 3 (0.16%) Burp Suite
7 3 (0.16%) InstallShield
7 3 (0.16%) Katalon Studio
7 3 (0.16%) LSMW
7 3 (0.16%) Metasploit
7 3 (0.16%) MLflow
8 2 (0.11%) Appium
8 2 (0.11%) AutoIt
8 2 (0.11%) Jenkins
8 2 (0.11%) Oracle Forms
9 1 (0.054%) MSI
9 1 (0.054%) Team Foundation Server
9 1 (0.054%) Visual Studio
General
1 672 (36.17%) Law
2 625 (33.64%) Social Skills
3 617 (33.21%) Finance
4 383 (20.61%) Inclusion and Diversity
5 251 (13.51%) Marketing
6 232 (12.49%) Analytical Skills
7 93 (5.01%) Banking
8 83 (4.47%) Organisational Skills
9 68 (3.66%) Retail
10 58 (3.12%) Presentation Skills
11 56 (3.01%) Documentation Skills
11 56 (3.01%) Influencing Skills
12 54 (2.91%) Manufacturing
13 41 (2.21%) Telecoms
14 34 (1.83%) Advertising
14 34 (1.83%) Public Sector
15 21 (1.13%) Games
16 20 (1.08%) Billing
17 16 (0.86%) Local Government
18 15 (0.81%) Front Office
Job Titles
1 241 (12.97%) Senior
2 213 (11.46%) Analyst
3 123 (6.62%) Customer Executive
4 104 (5.60%) Lead
5 77 (4.14%) IT Support
6 59 (3.18%) Senior Manager
7 54 (2.91%) Project Manager
8 51 (2.74%) Consultant
9 50 (2.69%) Support Analyst
10 48 (2.58%) IT Analyst
11 47 (2.53%) Graduate
12 45 (2.42%) Architect
13 41 (2.21%) IT Manager
14 38 (2.05%) IT Support Analyst
15 35 (1.88%) Developer
16 33 (1.78%) Cloud Engineer
17 31 (1.67%) Product Manager
18 30 (1.61%) Data Manager
19 28 (1.51%) Senior Analyst
20 27 (1.45%) Operations Manager
Libraries, Frameworks & Software Standards
1 27 (1.45%) HTML
2 26 (1.40%) CSS
3 21 (1.13%) .NET
4 15 (0.81%) REST
5 12 (0.65%) React
6 8 (0.43%) Django
6 8 (0.43%) EDI
6 8 (0.43%) WebSockets
7 7 (0.38%) RESTful
8 6 (0.32%) ASP.NET
8 6 (0.32%) LangChain
8 6 (0.32%) Middleware
9 5 (0.27%) Kafka
9 5 (0.27%) SOAP
9 5 (0.27%) XML
10 4 (0.22%) AngularJS
10 4 (0.22%) GraphQL
10 4 (0.22%) Saxon XSLT
11 3 (0.16%) TensorFlow
11 3 (0.16%) Vue
Miscellaneous
1 290 (15.61%) Cyberattack
2 115 (6.19%) Management Information System
3 59 (3.18%) Self-Motivation
4 52 (2.80%) Social Media
5 51 (2.74%) Learning Management System
6 49 (2.64%) Algorithms
7 40 (2.15%) Onboarding
8 38 (2.05%) Security Posture
9 34 (1.83%) Mobile App
10 33 (1.78%) Video Conferencing
11 32 (1.72%) Product Ownership
12 31 (1.67%) Data Protection Act
13 26 (1.40%) e-Learning
14 22 (1.18%) Analytical Mindset
15 20 (1.08%) Cyber Threat
16 19 (1.02%) Credit Risk
16 19 (1.02%) Data Structures
17 18 (0.97%) Virtual Team
18 17 (0.91%) Driving Licence
18 17 (0.91%) Greenfield Project
Operating Systems
1 157 (8.45%) Windows
2 52 (2.80%) Windows 10
3 46 (2.48%) Windows Server
4 26 (1.40%) Linux
5 25 (1.35%) Windows Vista
6 17 (0.91%) Mac OS
7 14 (0.75%) Android
8 9 (0.48%) Apple iOS
8 9 (0.48%) Windows Server 2016
8 9 (0.48%) Windows Server 2019
9 6 (0.32%) Ubuntu
10 5 (0.27%) Windows Server 2012
11 4 (0.22%) Unix
12 3 (0.16%) Kali Linux
13 2 (0.11%) VMS
14 1 (0.054%) Embedded Linux
Processes & Methodologies
1 430 (23.14%) Cybersecurity
2 346 (18.62%) Creative Thinking
3 322 (17.33%) Line Management
4 268 (14.42%) Problem-Solving
5 258 (13.89%) Agile
6 241 (12.97%) Decision-Making
7 237 (12.76%) Project Management
8 185 (9.96%) Risk Management
9 174 (9.36%) Information Security
10 173 (9.31%) Contract Negotiation
11 166 (8.93%) Business Development
12 165 (8.88%) Analytics
13 156 (8.40%) Continuous Improvement
14 141 (7.59%) Data-Driven Decision Making
15 140 (7.53%) Artificial Intelligence
15 140 (7.53%) Roadmaps
16 134 (7.21%) Mentoring
17 121 (6.51%) Coaching
18 114 (6.14%) Data Protection
19 113 (6.08%) Project Delivery
Programming Languages
1 148 (7.97%) SQL
2 109 (5.87%) Python
3 63 (3.39%) PowerShell
4 55 (2.96%) JavaScript
5 39 (2.10%) C#
6 32 (1.72%) Java
7 19 (1.02%) TypeScript
8 17 (0.91%) Kotlin
9 14 (0.75%) C
9 14 (0.75%) C++
9 14 (0.75%) PHP
10 12 (0.65%) R
11 8 (0.43%) T-SQL
12 7 (0.38%) Go
13 6 (0.32%) Ladder Logic
13 6 (0.32%) Ruby
13 6 (0.32%) VBA
14 5 (0.27%) Scala
15 4 (0.22%) Data Analysis Expressions
15 4 (0.22%) VB.NET
Qualifications
1 397 (21.37%) Degree
2 79 (4.25%) Master's Degree
3 73 (3.93%) BPSS Clearance
4 64 (3.44%) CISSP
5 59 (3.18%) DBS Check
6 47 (2.53%) PhD
7 44 (2.37%) CISM
8 42 (2.26%) Computer Science Degree
9 30 (1.61%) CISA
10 29 (1.56%) Numerate Degree
11 27 (1.45%) CRISC
12 25 (1.35%) Security Cleared
13 23 (1.24%) Microsoft Certification
14 22 (1.18%) Cisco Certification
15 18 (0.97%) A+ Certification
15 18 (0.97%) CompTIA Security+
16 17 (0.91%) (ISC)2 CCSP
16 17 (0.91%) ISO 27001 Lead Auditor
16 17 (0.91%) MRICS
17 13 (0.70%) ISEB
Quality Assurance & Compliance
1 285 (15.34%) NCSC
2 149 (8.02%) ISO/IEC 27001
3 118 (6.35%) GDPR
4 69 (3.71%) QA
5 68 (3.66%) Cyber Essentials
6 63 (3.39%) NIST
7 45 (2.42%) Accessibility
8 32 (1.72%) PCI DSS
9 26 (1.40%) Data Quality
10 23 (1.24%) Cyber Essentials PLUS
11 22 (1.18%) SLA
12 20 (1.08%) Sarbanes-Oxley
13 18 (0.97%) SOC 2
14 17 (0.91%) COBIT
14 17 (0.91%) GRC
15 11 (0.59%) ISO/IEC 27002 (supersedes ISO/IEC 17799)
16 10 (0.54%) California Consumer Privacy Act
16 10 (0.54%) ISO 9001
16 10 (0.54%) PERC
17 8 (0.43%) GAAP
System Software
1 105 (5.65%) Active Directory
2 35 (1.88%) VMware Infrastructure
3 28 (1.51%) Virtual Machines
4 17 (0.91%) Docker
5 10 (0.54%) VMware ESXi
6 9 (0.48%) Virtual Desktop
7 7 (0.38%) Hyper-V
8 3 (0.16%) DFS Replication
8 3 (0.16%) vSphere
9 1 (0.054%) Firmware
9 1 (0.054%) Microsoft App-V
9 1 (0.054%) pfSense
Systems Management
1 56 (3.01%) Microsoft Intune
2 28 (1.51%) Kubernetes
3 26 (1.40%) SCCM
4 18 (0.97%) Single Sign-On
5 11 (0.59%) Terraform
6 5 (0.27%) Active Directory Federation Services
6 5 (0.27%) CSIRT
7 4 (0.22%) Argo
7 4 (0.22%) CASB
7 4 (0.22%) Cisco CUCM
7 4 (0.22%) Kustomize
8 3 (0.16%) FortiGate
8 3 (0.16%) Functional Safety
8 3 (0.16%) Nessus
8 3 (0.16%) SCOM
9 2 (0.11%) Ansible
9 2 (0.11%) Istio
10 1 (0.054%) cPanel
10 1 (0.054%) EnCase
10 1 (0.054%) FTK
Vendors
1 319 (17.17%) Microsoft
2 152 (8.18%) Salesforce
3 62 (3.34%) iManage
4 59 (3.18%) Google
5 43 (2.31%) VMware
6 42 (2.26%) Cisco
7 38 (2.05%) Intapp
8 30 (1.61%) Aderant
9 27 (1.45%) ServiceNow
10 23 (1.24%) Adobe
11 21 (1.13%) Oracle
12 20 (1.08%) IBM
13 17 (0.91%) Citrix
14 16 (0.86%) SAP
15 11 (0.59%) Veeam
16 10 (0.54%) Databricks
16 10 (0.54%) OneTrust
17 9 (0.48%) Workday
18 8 (0.43%) Facebook
18 8 (0.43%) Meraki