Data Modelling Job Trends

Data Modelling
UK

The table below provides summary statistics and salary benchmarking for jobs requiring Data Modelling skills. It covers vacancies from the 6 months leading up to 18 September 2025, with comparisons to the same periods in the previous two years.

6 months to
18 Sep 2025
Same period 2024 Same period 2023
Rank 123 110 113
Rank change year-on-year -13 +3 +5
Permanent jobs citing Data Modelling 1,214 1,754 1,766
As % of all permanent jobs advertised in the UK 2.45% 2.25% 2.93%
As % of the Processes & Methodologies category 2.77% 2.77% 3.11%
Number of salaries quoted 630 961 1,296
10th Percentile £45,000 £41,250 £42,500
25th Percentile £56,250 £52,500 £51,145
Median annual salary (50th Percentile) £70,000 £69,300 £67,251
Median % change year-on-year +1.01% +3.05% +3.46%
75th Percentile £85,000 £87,348 £85,000
90th Percentile £106,375 £100,000 £100,000
UK excluding London median annual salary £63,500 £62,500 £57,349
% change year-on-year +1.60% +8.98% +1.50%

All Process and Methodology Skills
UK

Data Modelling falls under the Processes and Methodologies category. For comparison with the information above, the following table provides summary statistics for all permanent job vacancies requiring process or methodology skills.

Permanent vacancies with a requirement for process or methodology skills 43,869 63,416 56,859
As % of all permanent jobs advertised in the UK 88.70% 81.19% 94.35%
Number of salaries quoted 24,728 36,039 42,828
10th Percentile £28,500 £32,000 £32,750
25th Percentile £36,250 £42,500 £45,000
Median annual salary (50th Percentile) £55,000 £57,500 £60,000
Median % change year-on-year -4.35% -4.17% -
75th Percentile £75,000 £77,500 £80,000
90th Percentile £96,250 £95,000 £100,000
UK excluding London median annual salary £47,500 £52,500 £54,000
% change year-on-year -9.52% -2.78% +2.86%

Data Modelling
Job Vacancy Trend

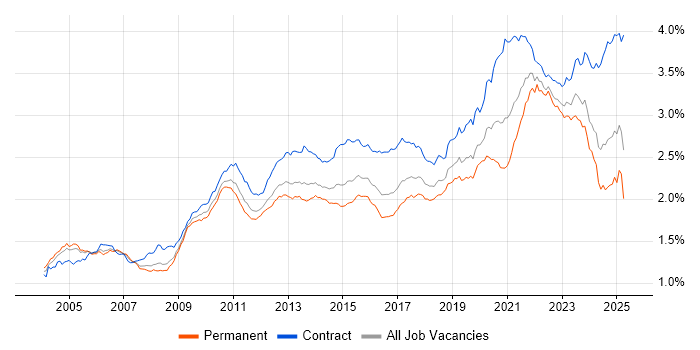
Job postings citing Data Modelling as a proportion of all IT jobs advertised.

Job vacancy trend for Data Modelling in the UK

Data Modelling
Salary Trend

Salary distribution trend for jobs in the UK citing Data Modelling.

Salary distribution trend for jobs in the UK citing Data Modelling

Data Modelling
Salary Histogram

Salary distribution for jobs citing Data Modelling over the 6 months to 18 September 2025.

Salary histogram for Data Modelling in the UK

Data Modelling
Top 18 Job Locations

The table below looks at the demand and provides a guide to the median salaries quoted in IT jobs citing Data Modelling within the UK over the 6 months to 18 September 2025. The 'Rank Change' column provides an indication of the change in demand within each location based on the same 6 month period last year.

Location Rank Change
on Same Period
Last Year
Matching
Permanent
IT Job Ads
Median Salary
Past 6 Months
Median Salary
% Change
on Same Period
Last Year
Live
Jobs
England -16 1,141 £69,000 -1.43% 738
UK excluding London -24 636 £63,500 +1.60% 525
London +14 530 £78,750 +5.00% 391
Work from Home -23 357 £67,500 -3.57% 390
South East +30 271 £65,000 - 259
North of England -79 122 £62,500 -7.41% 99
Midlands +11 113 £63,500 +10.43% 68
West Midlands +7 67 £60,250 +4.78% 41
Yorkshire +2 57 £67,500 +36.38% 33
North West -89 57 £60,000 -13.23% 58
South West +25 49 £63,425 -9.39% 41
East Midlands +32 46 £65,000 +30.00% 26
Scotland -8 45 £61,250 +11.36% 20
East of England -9 44 £60,000 +33.33% 26
North East +13 10 £49,250 -24.23% 8
Northern Ireland +17 1 - - 6
Isle of Man +10 1 - -
Wales -4 1 - - 10

Data Modelling
Co-occurring Skills and Capabilities by Category

The follow tables expand on the table above by listing co-occurrences grouped by category. The same employment type, locality and period is covered with up to 20 co-occurrences shown in each of the following categories:

Application Platforms
1 97 (7.99%) Apache Spark
2 43 (3.54%) Apache
3 37 (3.05%) Apache Airflow
4 23 (1.89%) Confluence
5 14 (1.15%) SharePoint
6 13 (1.07%) SAS
7 6 (0.49%) Appian
7 6 (0.49%) Microsoft Exchange
8 4 (0.33%) Apache Synapse
8 4 (0.33%) Oracle Workflow
9 2 (0.16%) BizTalk Server
9 2 (0.16%) Luigi
10 1 (0.082%) Apache Superset
10 1 (0.082%) ArcGIS
10 1 (0.082%) CMS
10 1 (0.082%) Headless CMS
10 1 (0.082%) Oracle Application Server
Applications
1 131 (10.79%) Microsoft Excel
2 10 (0.82%) Microsoft Office
3 7 (0.58%) Microsoft PowerPoint
4 5 (0.41%) MS Visio
5 4 (0.33%) PlantUML
6 2 (0.16%) Simulink
6 2 (0.16%) Trello
7 1 (0.082%) Chatbot
7 1 (0.082%) Spreadsheet
Business Applications
1 41 (3.38%) SAP S/4HANA
2 19 (1.57%) Dynamics CRM
3 10 (0.82%) NetSuite
4 8 (0.66%) SAP CO
4 8 (0.66%) SAP FI
4 8 (0.66%) SAP FI/CO
5 6 (0.49%) SAP MDG
6 5 (0.41%) Endur
6 5 (0.41%) Salesforce CRM
6 5 (0.41%) Sparx Enterprise Architect
7 4 (0.33%) Oracle EBS
7 4 (0.33%) Oracle ERP
8 3 (0.25%) Dynamics AX
8 3 (0.25%) Shopify
9 2 (0.16%) Aladdin
9 2 (0.16%) Dynamics GP
9 2 (0.16%) iTrent
9 2 (0.16%) SAP MDG-S
10 1 (0.082%) Loan IQ
10 1 (0.082%) SAP Retail
Cloud Services
1 607 (50.00%) Azure
2 363 (29.90%) Power Platform
3 347 (28.58%) AWS
4 184 (15.16%) GCP
5 126 (10.38%) Snowflake
6 94 (7.74%) Azure Data Factory
7 83 (6.84%) Azure Synapse Analytics
8 69 (5.68%) Serverless
9 60 (4.94%) dbt
10 57 (4.70%) Azure DevOps
11 50 (4.12%) SaaS
12 42 (3.46%) Amazon S3
13 41 (3.38%) GitHub
13 41 (3.38%) Microsoft Purview
14 39 (3.21%) AWS Lambda
15 38 (3.13%) Power Automate
16 35 (2.88%) PowerApps
17 34 (2.80%) Dynamics 365
18 32 (2.64%) Collibra
19 28 (2.31%) Microsoft 365
Communications & Networking
1 8 (0.66%) HTTP
2 4 (0.33%) Broadband
3 3 (0.25%) Firewall
3 3 (0.25%) PuTTY
4 2 (0.16%) ADSL2
5 1 (0.082%) SAN
5 1 (0.082%) SMS
5 1 (0.082%) X.21
Database & Business Intelligence
1 353 (29.08%) Data Warehouse
2 345 (28.42%) Power BI
3 219 (18.04%) Data Lake
4 154 (12.69%) Metadata
5 104 (8.57%) SQL Server
6 97 (7.99%) Big Data
7 84 (6.92%) NoSQL
8 78 (6.43%) Amazon Redshift
9 74 (6.10%) Tableau
10 71 (5.85%) SAP BW
11 55 (4.53%) Hadoop
12 51 (4.20%) Relational Database
13 47 (3.87%) Power Query
14 44 (3.62%) SQL Server Integration Services
15 37 (3.05%) PostgreSQL
16 36 (2.97%) MySQL
17 35 (2.88%) BigQuery
18 33 (2.72%) Snowflake Schema
19 32 (2.64%) Azure SQL Database
20 30 (2.47%) MongoDB
Development Applications
1 57 (4.70%) JIRA
2 56 (4.61%) Git
3 28 (2.31%) ERwin
4 23 (1.89%) ER Studio
5 21 (1.73%) Jenkins
6 8 (0.66%) Subversion
7 5 (0.41%) Eclipse
7 5 (0.41%) JUnit
7 5 (0.41%) Selenium
8 4 (0.33%) Maven
8 4 (0.33%) Robot Framework
8 4 (0.33%) Snyk
9 3 (0.25%) CircleCI
9 3 (0.25%) GitLab
9 3 (0.25%) MLflow
10 2 (0.16%) LSMW
10 2 (0.16%) Storybook
10 2 (0.16%) Visual Studio
11 1 (0.082%) Atlassian Bamboo
11 1 (0.082%) PowerDesigner
General
1 479 (39.46%) Social Skills
2 374 (30.81%) Finance
3 280 (23.06%) Analytical Skills
4 201 (16.56%) Law
5 122 (10.05%) Marketing
6 91 (7.50%) Inclusion and Diversity
7 72 (5.93%) Banking
8 66 (5.44%) Retail
9 57 (4.70%) Public Sector
10 35 (2.88%) Financial Institution
11 26 (2.14%) Manufacturing
12 23 (1.89%) Retail Banking
13 22 (1.81%) Legal
14 19 (1.57%) Telecoms
15 15 (1.24%) Influencing Skills
15 15 (1.24%) Presentation Skills
16 10 (0.82%) Documentation Skills
17 9 (0.74%) Games
17 9 (0.74%) Private Banking
17 9 (0.74%) Tech for Good
Job Titles
1 272 (22.41%) Senior
2 260 (21.42%) Lead
3 247 (20.35%) Architect
4 235 (19.36%) Data Engineer
5 162 (13.34%) Data Architect
6 154 (12.69%) Analyst
7 133 (10.96%) Developer
8 108 (8.90%) Senior Data Engineer
9 49 (4.04%) Business Intelligence Developer
10 48 (3.95%) Data Analyst
11 47 (3.87%) Azure Engineer
12 46 (3.79%) Azure Data Engineer
12 46 (3.79%) Business Intelligence Lead
13 41 (3.38%) Report Analyst
14 39 (3.21%) Solutions Architect
15 34 (2.80%) Business Intelligence Analyst
15 34 (2.80%) Enterprise Architect
16 32 (2.64%) Senior Developer
17 31 (2.55%) Business Analyst
18 29 (2.39%) Power BI Developer
Libraries, Frameworks & Software Standards
1 95 (7.83%) Kafka
2 70 (5.77%) REST
3 46 (3.79%) PySpark
4 33 (2.72%) .NET
4 33 (2.72%) HTML
5 30 (2.47%) XML
6 28 (2.31%) CSS
6 28 (2.31%) SOAP
7 27 (2.22%) JSON
8 26 (2.14%) Lightning Web Components
9 24 (1.98%) RESTful
10 23 (1.89%) Middleware
11 18 (1.48%) Spring Boot
12 15 (1.24%) Spring
13 14 (1.15%) AngularJS
13 14 (1.15%) React
13 14 (1.15%) Spark Streaming
14 10 (0.82%) GraphQL
14 10 (0.82%) RabbitMQ
15 9 (0.74%) gRPC
Miscellaneous
1 71 (5.85%) Product Ownership
2 66 (5.44%) Cloud Native
3 55 (4.53%) Enterprise Software
4 53 (4.37%) Data Structures
5 51 (4.20%) Management Information System
6 44 (3.62%) Legacy Systems
7 36 (2.97%) Distributed Systems
8 22 (1.81%) Analytical Mindset
9 19 (1.57%) FMCG
10 15 (1.24%) CMDB
11 13 (1.07%) Greenfield Project
11 13 (1.07%) Virtual Team
12 11 (0.91%) Foreign Exchange (FX)
13 10 (0.82%) Market Risk
13 10 (0.82%) Reinsurance
14 9 (0.74%) Data Protection Act
14 9 (0.74%) Hybrid Cloud
14 9 (0.74%) Taxonomies
15 8 (0.66%) IoT
16 7 (0.58%) e-Learning
Operating Systems
1 12 (0.99%) Unix
2 11 (0.91%) Linux
3 5 (0.41%) Windows
4 3 (0.25%) Android
4 3 (0.25%) Apple iOS
Processes & Methodologies
1 494 (40.69%) Analytics
2 435 (35.83%) Business Intelligence
3 412 (33.94%) ETL
4 338 (27.84%) Data Governance
5 327 (26.94%) Problem-Solving
6 318 (26.19%) Agile
7 309 (25.45%) Data Architecture
8 281 (23.15%) Data Pipeline
9 280 (23.06%) Data Engineering
10 221 (18.20%) CI/CD
10 221 (18.20%) Decision-Making
10 221 (18.20%) DevOps
11 220 (18.12%) Data Management
12 216 (17.79%) Data Strategy
13 175 (14.42%) Data Science
14 172 (14.17%) Visualisation
15 168 (13.84%) Artificial Intelligence
16 165 (13.59%) Data Integration
17 162 (13.34%) Roadmaps
18 158 (13.01%) Stakeholder Management
Programming Languages
1 586 (48.27%) SQL
2 408 (33.61%) Python
3 86 (7.08%) Java
4 70 (5.77%) Data Analysis Expressions
5 49 (4.04%) JavaScript
6 47 (3.87%) Scala
7 40 (3.29%) T-SQL
8 37 (3.05%) R
9 33 (2.72%) C#
10 26 (2.14%) Apex Code
11 19 (1.57%) TypeScript
12 16 (1.32%) PowerShell
13 12 (0.99%) Bash
13 12 (0.99%) PL/SQL
14 8 (0.66%) Go
15 7 (0.58%) SPARQL
16 6 (0.49%) Shell Script
17 5 (0.41%) C++
17 5 (0.41%) Fortran
17 5 (0.41%) VBA
Qualifications
1 295 (24.30%) Degree
2 69 (5.68%) Computer Science Degree
3 61 (5.02%) Azure Certification
4 57 (4.70%) Security Cleared
5 51 (4.20%) AWS Certification
6 41 (3.38%) Master's Degree
7 39 (3.21%) SC Cleared
8 34 (2.80%) Microsoft Certification
9 13 (1.07%) TOGAF Certification
10 12 (0.99%) AWS Certified Solutions Architect
11 7 (0.58%) CISA
11 7 (0.58%) CISM
11 7 (0.58%) CISSP
11 7 (0.58%) CRISC
11 7 (0.58%) DV Cleared
12 6 (0.49%) Oracle Certification
12 6 (0.49%) PMI Certification
12 6 (0.49%) PMP
13 5 (0.41%) DBS Check
14 4 (0.33%) AWS Certified Developer
Quality Assurance & Compliance
1 318 (26.19%) Data Quality
2 109 (8.98%) GDPR
3 71 (5.85%) QA
4 47 (3.87%) Accessibility
5 15 (1.24%) ISO/IEC 27001
6 13 (1.07%) NIST
7 8 (0.66%) Actionable Recommendations
7 8 (0.66%) California Consumer Privacy Act
8 7 (0.58%) COBIT
8 7 (0.58%) GRC
8 7 (0.58%) ITGC
9 5 (0.41%) HIPAA
10 3 (0.25%) SOC 2
11 2 (0.16%) PCI DSS
11 2 (0.16%) SNOMED CT
12 1 (0.082%) CDISC
12 1 (0.082%) DICOM
12 1 (0.082%) HL7
12 1 (0.082%) IFRS
12 1 (0.082%) MiFID
System Software
1 37 (3.05%) Docker
2 12 (0.99%) HDFS
3 8 (0.66%) Active Directory
4 4 (0.33%) Oracle RAC
5 3 (0.25%) Apache Flume
6 2 (0.16%) Firmware
6 2 (0.16%) Virtual Machines
Systems Management
1 46 (3.79%) Terraform
2 36 (2.97%) Kubernetes
3 9 (0.74%) Ansible
4 5 (0.41%) RSA Archer
5 4 (0.33%) Data Guard
5 4 (0.33%) Kibana
5 4 (0.33%) Oracle Enterprise Manager
5 4 (0.33%) Oracle RMAN
6 3 (0.25%) Grafana
6 3 (0.25%) logstash
6 3 (0.25%) Oozie
6 3 (0.25%) Prometheus
6 3 (0.25%) Single Sign-On
7 1 (0.082%) Kiali
7 1 (0.082%) Progress Chef
7 1 (0.082%) Puppet
Vendors
1 231 (19.03%) Microsoft
2 184 (15.16%) Databricks
3 180 (14.83%) SAP
4 72 (5.93%) Oracle
5 69 (5.68%) Salesforce
6 60 (4.94%) Google
7 41 (3.38%) Informatica
8 24 (1.98%) ServiceNow
9 17 (1.40%) Salesforce Marketing Cloud
10 16 (1.32%) Talend
11 13 (1.07%) IBM
12 11 (0.91%) MuleSoft
13 7 (0.58%) Alteryx
13 7 (0.58%) Progress
14 6 (0.49%) Amplitude
14 6 (0.49%) Okta
14 6 (0.49%) Splunk
14 6 (0.49%) Teradata
15 5 (0.41%) BiZZdesign
15 5 (0.41%) Sparx