Deployment Automation Jobs

Deployment Automation
UK

The table below provides summary statistics for permanent job vacancies requiring Deployment Automation skills. It includes a benchmarking guide to the annual salaries offered in vacancies that cited Deployment Automation over the 6 months leading up to 6 July 2025, comparing them to the same period in the previous two years.

6 months to
6 Jul 2025
Same period 2024 Same period 2023
Rank 373 512 424
Rank change year-on-year +139 -88 -54
Permanent jobs citing Deployment Automation 403 444 628
As % of all permanent jobs advertised in the UK 0.68% 0.42% 0.71%
As % of the Processes & Methodologies category 0.74% 0.51% 0.74%
Number of salaries quoted 161 341 463
10th Percentile £42,500 £44,263 £48,800
25th Percentile £55,000 £52,500 £57,500
Median annual salary (50th Percentile) £68,500 £65,000 £75,000
Median % change year-on-year +5.38% -13.33% +15.38%
75th Percentile £86,250 £80,000 £95,000
90th Percentile £97,528 £102,500 £130,000
UK excluding London median annual salary £67,750 £61,500 £67,500
% change year-on-year +10.16% -8.89% +22.73%

All Process and Methodology Skills
UK

Deployment Automation falls under the Processes and Methodologies category. For comparison with the information above, the following table provides summary statistics for all permanent job vacancies requiring process or methodology skills.

Permanent vacancies with a requirement for process or methodology skills 54,176 87,872 84,588
As % of all permanent jobs advertised in the UK 90.80% 82.53% 95.27%
Number of salaries quoted 28,154 60,487 53,372
10th Percentile £27,750 £29,750 £33,750
25th Percentile £38,750 £40,000 £45,000
Median annual salary (50th Percentile) £55,000 £55,000 £60,249
Median % change year-on-year - -8.71% +0.42%
75th Percentile £74,258 £72,500 £80,000
90th Percentile £96,250 £92,500 £100,000
UK excluding London median annual salary £50,055 £50,000 £55,000
% change year-on-year +0.11% -9.09% +4.76%

Deployment Automation
Job Vacancy Trend

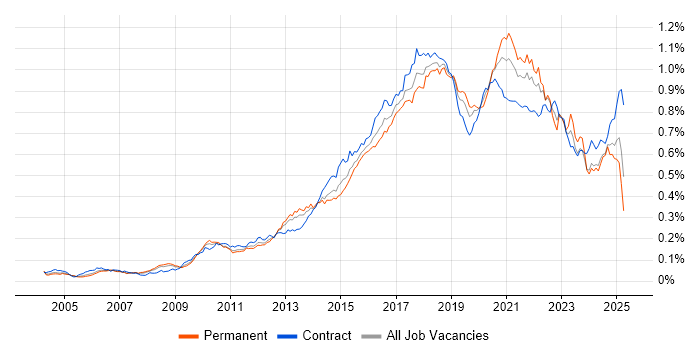
Job postings citing Deployment Automation as a proportion of all IT jobs advertised.

Job vacancy trend for Deployment Automation in the UK

Deployment Automation
Salary Trend

3-month moving average salary quoted in jobs citing Deployment Automation.

Salary trend for Deployment Automation in the UK

Deployment Automation
Salary Histogram

Salary distribution for jobs citing Deployment Automation over the 6 months to 6 July 2025.

Salary histogram for Deployment Automation in the UK

Deployment Automation
Top 16 Job Locations

The table below looks at the demand and provides a guide to the median salaries quoted in IT jobs citing Deployment Automation within the UK over the 6 months to 6 July 2025. The 'Rank Change' column provides an indication of the change in demand within each location based on the same 6 month period last year.

Location Rank Change
on Same Period
Last Year
Matching
Permanent
IT Job Ads
Median Salary
Past 6 Months
Median Salary
% Change
on Same Period
Last Year
Live
Jobs
England +101 373 £68,500 +5.38% 238
Work from Home +181 273 £60,000 -2.44% 147
UK excluding London +82 168 £67,750 +10.16% 138
London +115 160 £75,000 -14.16% 144
North of England +3 44 £67,750 +36.87% 25
South East +23 38 £52,500 -14.63% 37
North West +13 31 £67,500 +63.70% 16
Midlands +75 24 £62,500 +4.17% 9
Scotland +107 23 £75,360 +214.00% 26
East of England +49 21 - - 9
West Midlands +58 17 £61,250 +2.08% 4
South West +67 14 £71,991 +17.06% 17
Yorkshire +10 12 £68,500 +0.74% 8
East Midlands +57 7 £75,000 +87.50% 5
Wales - 4 £53,750 - 13
North East +43 1 - - 2

Deployment Automation
Co-occurring Skills and Capabilities by Category

The follow tables expand on the table above by listing co-occurrences grouped by category. The same employment type, locality and period is covered with up to 20 co-occurrences shown in each of the following categories:

Application Platforms
1 23 (5.71%) Apache Spark
2 8 (1.99%) Apache
2 8 (1.99%) Confluence
2 8 (1.99%) nginx
3 6 (1.49%) SharePoint
4 5 (1.24%) Apache Airflow
5 3 (0.74%) IIS
6 2 (0.50%) BizTalk Server
6 2 (0.50%) CMS
6 2 (0.50%) Microsoft Exchange
7 1 (0.25%) Camunda
7 1 (0.25%) Drupal
7 1 (0.25%) Headless CMS
7 1 (0.25%) OpenStack
7 1 (0.25%) Strapi
7 1 (0.25%) Tomcat
7 1 (0.25%) Umbraco
Applications
1 2 (0.50%) MS Visio
2 1 (0.25%) Microsoft Office
Business Applications
1 4 (0.99%) Dynamics CRM
2 1 (0.25%) Eikon
Cloud Services
1 211 (52.36%) AWS
2 122 (30.27%) Serverless
3 114 (28.29%) AWS Lambda
4 90 (22.33%) Azure
5 58 (14.39%) GCP
6 49 (12.16%) GitHub
7 40 (9.93%) Amazon EKS
8 39 (9.68%) Amazon S3
9 29 (7.20%) GitHub Actions
10 28 (6.95%) Azure DevOps
11 19 (4.71%) Amazon ELB
12 17 (4.22%) Amazon EC2
12 17 (4.22%) AWS CloudFormation
13 11 (2.73%) SaaS
14 10 (2.48%) AWS KMS
14 10 (2.48%) Azure Machine Learning
14 10 (2.48%) Datadog
15 9 (2.23%) Microsoft 365
16 8 (1.99%) PaaS
16 8 (1.99%) Power Platform
Communications & Networking
1 162 (40.20%) Broadband
2 84 (20.84%) SSH
2 84 (20.84%) SSL
3 20 (4.96%) Network Security
4 8 (1.99%) DNS
5 6 (1.49%) F5 BIG-IP LTM
6 4 (0.99%) VPN
7 3 (0.74%) Firewall
7 3 (0.74%) WAN
8 2 (0.50%) BGP
8 2 (0.50%) Cisco IOS
8 2 (0.50%) HTTP
8 2 (0.50%) Internet
8 2 (0.50%) IOS XR
8 2 (0.50%) NX-OS
9 1 (0.25%) Multicast
9 1 (0.25%) OpenVPN
9 1 (0.25%) Remote Desktop
9 1 (0.25%) Structured Cabling
9 1 (0.25%) Wireshark
Database & Business Intelligence
1 25 (6.20%) DynamoDB
2 19 (4.71%) Delta Lake
2 19 (4.71%) Metadata
2 19 (4.71%) Spark SQL
3 17 (4.22%) Data Warehouse
4 16 (3.97%) Tick Data
5 10 (2.48%) Cloud Spanner
5 10 (2.48%) PostgreSQL
5 10 (2.48%) SQL Server
6 8 (1.99%) Amazon RDS
7 6 (1.49%) Big Data
7 6 (1.49%) MongoDB
7 6 (1.49%) MySQL
8 5 (1.24%) NoSQL
9 4 (0.99%) Power BI
10 3 (0.74%) Relational Database
11 2 (0.50%) Data Lake
11 2 (0.50%) Elasticsearch
12 1 (0.25%) Amazon Aurora
12 1 (0.25%) Amazon QuickSight
Development Applications
1 37 (9.18%) Git
1 37 (9.18%) Jenkins
2 30 (7.44%) GitLab
3 19 (4.71%) MLflow
4 18 (4.47%) Cucumber
5 14 (3.47%) JIRA
6 12 (2.98%) IntelliJ
7 11 (2.73%) Maven
8 10 (2.48%) JUnit
8 10 (2.48%) Mockito
9 9 (2.23%) SonarQube
10 8 (1.99%) CircleCI
11 5 (1.24%) Appium
11 5 (1.24%) Artifactory
12 4 (0.99%) IBM UrbanCode
13 3 (0.74%) Bitbucket
13 3 (0.74%) Selenium
14 2 (0.50%) JMeter
14 2 (0.50%) SoapUI
14 2 (0.50%) Team Foundation Server
General
1 237 (58.81%) Social Skills
2 90 (22.33%) Games
3 62 (15.38%) Finance
4 26 (6.45%) Marketing
5 19 (4.71%) Banking
6 13 (3.23%) Legal
6 13 (3.23%) Public Sector
7 12 (2.98%) Analytical Skills
7 12 (2.98%) Law
8 11 (2.73%) Inclusion and Diversity
9 7 (1.74%) Organisational Skills
10 5 (1.24%) Telecoms
11 3 (0.74%) Advertising
11 3 (0.74%) Automotive
11 3 (0.74%) Financial Institution
11 3 (0.74%) Manufacturing
11 3 (0.74%) Retail
12 2 (0.50%) Cantonese Language
12 2 (0.50%) Investment Banking
12 2 (0.50%) Mandarin Language
Job Titles
1 133 (33.00%) Senior
2 119 (29.53%) DevOps Engineer
3 95 (23.57%) Cloud Engineer
4 79 (19.60%) Engineering Manager
4 79 (19.60%) Senior Manager
4 79 (19.60%) ServiceNow Manager
5 78 (19.35%) Senior Service Manager
6 48 (11.91%) Developer
7 44 (10.92%) Software Engineer
8 28 (6.95%) Lead
9 24 (5.96%) Architect
10 19 (4.71%) Machine Learning Engineer
10 19 (4.71%) Operations Engineer
11 18 (4.47%) Senior DevOps
12 16 (3.97%) Data Warehouse Developer
12 16 (3.97%) ETL Developer
12 16 (3.97%) Market Data Developer
12 16 (3.97%) Platform Engineer
13 15 (3.72%) Python Developer
13 15 (3.72%) Senior Software Engineer
Libraries, Frameworks & Software Standards
1 107 (26.55%) RESTful
2 86 (21.34%) Web Services
3 28 (6.95%) Spring
4 27 (6.70%) React
5 25 (6.20%) Spring Boot
6 22 (5.46%) YAML
7 21 (5.21%) PySpark
8 19 (4.71%) Elastic Stack
8 19 (4.71%) Keras
8 19 (4.71%) Lambda Expressions
8 19 (4.71%) Metaflow
8 19 (4.71%) NumPy
8 19 (4.71%) Pandas
8 19 (4.71%) PyTorch
8 19 (4.71%) scikit-learn
8 19 (4.71%) TensorFlow
9 18 (4.47%) Node.js
10 17 (4.22%) .NET
10 17 (4.22%) AngularJS
11 16 (3.97%) Kafka
Miscellaneous
1 204 (50.62%) Management Information System
2 90 (22.33%) Onboarding
3 85 (21.09%) Cyber Threat
4 82 (20.35%) Cyberattack
4 82 (20.35%) PKI
5 81 (20.10%) Product Ownership
6 79 (19.60%) Video\Live Streaming
7 27 (6.70%) Public Cloud
8 19 (4.71%) Distributed Systems
8 19 (4.71%) Linux Command Line
9 17 (4.22%) Cloud Native
9 17 (4.22%) Enterprise Software
10 12 (2.98%) Private Cloud
11 10 (2.48%) Credit Derivative
11 10 (2.48%) Educational Technology
11 10 (2.48%) Mobile Games
12 9 (2.23%) Algorithms
13 6 (1.49%) Mobile App
14 4 (0.99%) Data Centre
14 4 (0.99%) Self-Motivation
Operating Systems
1 45 (11.17%) Linux
2 20 (4.96%) Unix
3 18 (4.47%) Windows
4 16 (3.97%) Android
4 16 (3.97%) Apple iOS
5 8 (1.99%) Mac OS
6 4 (0.99%) Windows Server
7 3 (0.74%) Red Hat Enterprise Linux
8 2 (0.50%) Debian
9 1 (0.25%) Amazon Linux
9 1 (0.25%) CentOS
9 1 (0.25%) Windows 10
Processes & Methodologies
1 225 (55.83%) DevOps
2 178 (44.17%) Roadmaps
3 154 (38.21%) CI/CD
3 154 (38.21%) Software Engineering
4 108 (26.80%) Containerisation
5 95 (23.57%) Computer Science
6 94 (23.33%) Key Management
6 94 (23.33%) Software Delivery
7 89 (22.08%) Cybersecurity
8 88 (21.84%) Incident Management
9 87 (21.59%) ITSM
10 83 (20.60%) Vulnerability Assessment
11 82 (20.35%) Agile
11 82 (20.35%) Programme Delivery
11 82 (20.35%) Use Case
12 81 (20.10%) Change Management
12 81 (20.10%) Validation
13 80 (19.85%) Problem Management
13 80 (19.85%) Service Delivery
14 79 (19.60%) Infrastructure as Code
Programming Languages
1 171 (42.43%) Python
2 70 (17.37%) Java
3 32 (7.94%) SQL
4 26 (6.45%) JavaScript
5 23 (5.71%) TypeScript
6 17 (4.22%) C#
7 15 (3.72%) PowerShell
8 13 (3.23%) Go
9 11 (2.73%) Swift
10 10 (2.48%) C++
10 10 (2.48%) Kotlin
10 10 (2.48%) Objective-C
10 10 (2.48%) Shell Script
11 9 (2.23%) Bicep
12 7 (1.74%) Bash
13 4 (0.99%) Groovy
13 4 (0.99%) Kusto Query Language
14 3 (0.74%) C
14 3 (0.74%) Perl
14 3 (0.74%) Ruby
Qualifications
1 101 (25.06%) Degree
2 94 (23.33%) Computer Science Degree
3 28 (6.95%) Security Cleared
4 16 (3.97%) SC Cleared
5 14 (3.47%) AWS Certification
6 12 (2.98%) AWS Certified Solutions Architect
7 10 (2.48%) Azure Certification
8 8 (1.99%) CCNP
8 8 (1.99%) Cisco Certification
9 7 (1.74%) Microsoft Certification
10 6 (1.49%) CCNA
11 5 (1.24%) BPSS Clearance
12 2 (0.50%) DV Cleared
12 2 (0.50%) TOGAF Certification
13 1 (0.25%) CCIE
13 1 (0.25%) ISTQB
13 1 (0.25%) ISTQB Foundation Certification
13 1 (0.25%) MCSE
Quality Assurance & Compliance
1 92 (22.83%) ISO/IEC 27001
2 82 (20.35%) NIST
3 29 (7.20%) QA
4 14 (3.47%) GDPR
5 12 (2.98%) HIPAA
6 5 (1.24%) NCSC
7 3 (0.74%) PCI DSS
7 3 (0.74%) Sarbanes-Oxley
8 2 (0.50%) Data Quality
8 2 (0.50%) PMO
8 2 (0.50%) SOC 2
9 1 (0.25%) Accessibility
9 1 (0.25%) ISO 9001
System Software
1 124 (30.77%) Docker
2 96 (23.82%) Active Directory
3 8 (1.99%) Virtual Desktop
4 2 (0.50%) VMware Infrastructure
5 1 (0.25%) Hyper-V
5 1 (0.25%) Terminal Server
Systems Management
1 195 (48.39%) Terraform
2 134 (33.25%) Kubernetes
3 42 (10.42%) Ansible
4 30 (7.44%) Prometheus
5 26 (6.45%) Grafana
6 19 (4.71%) Kubeflow
7 11 (2.73%) Progress Chef
8 8 (1.99%) Puppet
9 6 (1.49%) Podman
10 4 (0.99%) Packer
11 2 (0.50%) Argo
12 1 (0.25%) Check_MK
12 1 (0.25%) FortiGate
12 1 (0.25%) Jamf Pro
12 1 (0.25%) Kibana
12 1 (0.25%) Kustomize
12 1 (0.25%) logstash
12 1 (0.25%) Opsgenie
12 1 (0.25%) Single Sign-On
12 1 (0.25%) vRealize
Vendors
1 82 (20.35%) Thales
2 79 (19.60%) ServiceNow
3 37 (9.18%) Databricks
4 18 (4.47%) Google
5 17 (4.22%) IBM
6 14 (3.47%) Microsoft
7 8 (1.99%) iManage
8 6 (1.49%) F5
9 5 (1.24%) Atlassian
9 5 (1.24%) Oracle
9 5 (1.24%) Salesforce
10 4 (0.99%) AppDynamics
10 4 (0.99%) Cisco
10 4 (0.99%) IBM Sterling
10 4 (0.99%) VMware
11 3 (0.74%) Dynatrace
11 3 (0.74%) Red Hat
11 3 (0.74%) SAP
12 2 (0.50%) Citrix
12 2 (0.50%) Guidewire