Artificial Intelligence Jobs

Artificial Intelligence (AI)
UK

The following table provides summary statistics for permanent job vacancies with a requirement for Artificial Intelligence skills. Included is a benchmarking guide to the salaries offered in vacancies that have cited Artificial Intelligence over the 6 months to 29 November 2023 with a comparison to the same period in the previous 2 years.

6 months to
29 Nov 2023
Same period 2022 Same period 2021
Rank 77 119 89
Rank change year-on-year +42 -30 +24
Permanent jobs citing Artificial Intelligence 2,040 3,723 4,776
As % of all permanent jobs advertised in the UK 3.77% 2.96% 3.70%
As % of the Processes & Methodologies category 4.01% 3.09% 3.88%
Number of salaries quoted 1,186 1,885 2,300
10th Percentile £43,750 £42,500 £37,500
25th Percentile £55,000 £52,500 £48,595
Median annual salary (50th Percentile) £76,383 £70,000 £67,500
Median % change year-on-year +9.12% +3.70% +8.00%
75th Percentile £92,500 £90,000 £88,750
90th Percentile £115,500 £108,491 £105,000
UK excluding London median annual salary £69,250 £60,000 £55,750
% change year-on-year +15.42% +7.62% +11.50%

All Process and Methodology Skills
UK

Artificial Intelligence is in the Processes and Methodologies category. The following table is for comparison with the above and provides summary statistics for all permanent job vacancies with a requirement for process or methodology skills.

Permanent vacancies with a requirement for process or methodology skills 50,908 120,439 123,182
As % of all permanent jobs advertised in the UK 94.09% 95.71% 95.44%
Number of salaries quoted 36,868 73,620 81,568
10th Percentile £32,500 £34,459 £32,500
25th Percentile £43,750 £45,000 £42,500
Median annual salary (50th Percentile) £60,000 £60,000 £59,045
Median % change year-on-year - +1.62% +7.35%
75th Percentile £80,000 £81,250 £77,500
90th Percentile £98,825 £100,000 £95,000
UK excluding London median annual salary £52,500 £53,000 £50,000
% change year-on-year -0.94% +6.00% +3.63%

Artificial Intelligence
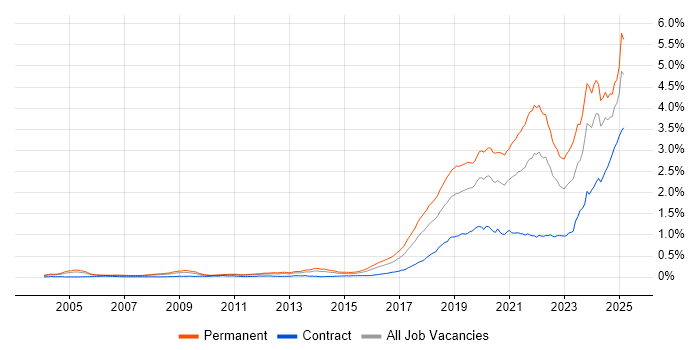
Job Vacancy Trend

Job postings citing Artificial Intelligence as a proportion of all IT jobs advertised.

Job vacancy trend for Artificial Intelligence in the UK

Artificial Intelligence
Salary Trend

3-month moving average salary quoted in jobs citing Artificial Intelligence.

Salary trend for Artificial Intelligence in the UK

Artificial Intelligence
Salary Histogram

Salary distribution for jobs citing Artificial Intelligence over the 6 months to 29 November 2023.

Salary histogram for Artificial Intelligence in the UK

Artificial Intelligence
Top 17 Job Locations

The table below looks at the demand and provides a guide to the median salaries quoted in IT jobs citing Artificial Intelligence within the UK over the 6 months to 29 November 2023. The 'Rank Change' column provides an indication of the change in demand within each location based on the same 6 month period last year.

Location Rank Change
on Same Period
Last Year
Matching
Permanent
IT Job Ads
Median Salary
Past 6 Months
Median Salary
% Change
on Same Period
Last Year
Live
Jobs
England +48 1,834 £77,500 +10.71% 1,311
Work from Home +47 1,033 £77,500 +10.71% 620
UK excluding London +53 1,020 £69,250 +15.42% 598
London +47 824 £85,000 +6.25% 824
North of England +44 278 £70,000 +27.27% 101
South East +42 236 £70,000 +12.75% 197
South West +52 202 £67,500 +12.50% 61
North West +57 169 £65,000 +18.18% 67
Scotland +102 124 £79,632 +22.51% 38
Yorkshire +40 103 £77,500 +19.23% 27
Midlands +33 87 £65,000 +3.17% 66
East of England +30 62 £60,000 - 118
West Midlands +19 60 £65,000 +3.17% 50
East Midlands +55 30 £43,500 -30.68% 15
Wales +1 20 £38,175 -13.24% 19
Northern Ireland +26 14 £75,000 +39.53% 10
North East +32 6 £57,500 +39.14% 7

Artificial Intelligence
Co-occurring Skills and Capabilities by Category

The follow tables expand on the table above by listing co-occurrences grouped by category. The same employment type, locality and period is covered with up to 20 co-occurrences shown in each of the following categories:

Application Platforms
1 91 (4.46%) Apache Spark
2 82 (4.02%) SharePoint
3 75 (3.68%) Apache
4 50 (2.45%) Confluence
5 23 (1.13%) Jupyter
6 19 (0.93%) Apache Airflow
7 11 (0.54%) nginx
8 9 (0.44%) SAS
9 8 (0.39%) Oracle Service Bus
9 8 (0.39%) WebLogic
10 4 (0.20%) SharePoint Server
10 4 (0.20%) WordPress
11 3 (0.15%) Appian
11 3 (0.15%) Drupal
12 2 (0.098%) Alfresco
12 2 (0.098%) Apache Solr
12 2 (0.098%) Hedera
12 2 (0.098%) Mule
12 2 (0.098%) WebSphere
12 2 (0.098%) WebSphere Application Server
Applications
1 49 (2.40%) Chatbot
2 31 (1.52%) Microsoft Office
3 24 (1.18%) Microsoft Excel
4 9 (0.44%) MS Visio
5 6 (0.29%) Microsoft PowerPoint
5 6 (0.29%) Trello
6 5 (0.25%) Sketch
7 4 (0.20%) 3ds Max
7 4 (0.20%) Adobe XD
8 3 (0.15%) SPSS
8 3 (0.15%) Stata
9 2 (0.098%) Blender
9 2 (0.098%) CINEMA 4D
9 2 (0.098%) InVision
9 2 (0.098%) Microsoft Project
9 2 (0.098%) MicroStation
10 1 (0.049%) Adobe Creative Suite
10 1 (0.049%) Maya
10 1 (0.049%) Spreadsheet
10 1 (0.049%) ZBrush
Business Applications
1 28 (1.37%) SAP ERP
2 10 (0.49%) Dynamics CRM
3 8 (0.39%) Remedy ITSM
4 6 (0.29%) Siebel CRM
5 5 (0.25%) Oracle Receivables
6 4 (0.20%) Oracle EBS
7 3 (0.15%) Workday HCM
8 2 (0.098%) Distributed Ledger
8 2 (0.098%) Oracle Cash Management
8 2 (0.098%) Oracle General Ledger
8 2 (0.098%) Oracle Payables
9 1 (0.049%) Dynamics NAV
9 1 (0.049%) Magento
9 1 (0.049%) NetSuite
9 1 (0.049%) Salesforce CRM
9 1 (0.049%) SAP EWM
9 1 (0.049%) Sparx Enterprise Architect
Cloud Services
1 489 (23.97%) Azure
2 487 (23.87%) AWS
3 364 (17.84%) GCP
4 188 (9.22%) Power Platform
5 166 (8.14%) SaaS
6 140 (6.86%) PaaS
7 135 (6.62%) IaaS
8 100 (4.90%) GitHub
9 74 (3.63%) Serverless
10 62 (3.04%) GitHub Actions
11 59 (2.89%) Vertex AI
12 54 (2.65%) Azure DevOps
12 54 (2.65%) Microsoft 365
13 49 (2.40%) Power Automate
14 48 (2.35%) ChatGPT
15 39 (1.91%) Google Sheets
16 35 (1.72%) Cloud Computing
17 32 (1.57%) Azure Data Factory
18 29 (1.42%) AWS Lambda
18 29 (1.42%) Azure Synapse Analytics
Communications & Networking
1 29 (1.42%) Firewall
2 24 (1.18%) Internet
3 22 (1.08%) DNS
4 21 (1.03%) AMQP
5 18 (0.88%) WAN
6 17 (0.83%) LAN
6 17 (0.83%) VPN
7 13 (0.64%) Cisco IOS
7 13 (0.64%) NX-OS
7 13 (0.64%) TCP/IP
8 12 (0.59%) Network Security
9 10 (0.49%) SD-WAN
10 9 (0.44%) BGP
10 9 (0.44%) HTTP
11 8 (0.39%) 4G
11 8 (0.39%) Cisco Firepower
11 8 (0.39%) DHCP
12 7 (0.34%) Cisco ISE
12 7 (0.34%) F5 BIG-IP GTM
12 7 (0.34%) F5 BIG-IP LTM
Database & Business Intelligence
1 213 (10.44%) NoSQL
2 188 (9.22%) Data Lake
3 183 (8.97%) Data Warehouse
4 179 (8.77%) PostgreSQL
5 169 (8.28%) Big Data
6 148 (7.25%) Power BI
7 108 (5.29%) MySQL
8 101 (4.95%) Oracle Database
8 101 (4.95%) SQL Server
9 98 (4.80%) Oracle Database 11g
10 97 (4.75%) Relational Database
11 79 (3.87%) Tableau
12 75 (3.68%) BigQuery
13 55 (2.70%) Looker
14 50 (2.45%) Bigtable
15 38 (1.86%) MongoDB
16 34 (1.67%) RDBMS
17 28 (1.37%) Oracle Database 10g
18 21 (1.03%) Elasticsearch
19 20 (0.98%) Metadata
Development Applications
1 137 (6.72%) Git
2 136 (6.67%) Jenkins
3 72 (3.53%) JIRA
4 51 (2.50%) GitLab
5 49 (2.40%) Cypress.io
6 26 (1.27%) Selenium
7 22 (1.08%) eggPlant
7 22 (1.08%) Postman
7 22 (1.08%) SoapUI
8 21 (1.03%) Cucumber
8 21 (1.03%) Maven
9 20 (0.98%) JMeter
9 20 (0.98%) REST Assured
9 20 (0.98%) The Grinder
10 18 (0.88%) LoadRunner
11 17 (0.83%) SonarQube
11 17 (0.83%) TeamCity
12 16 (0.78%) IBM UrbanCode
13 15 (0.74%) JUnit
14 14 (0.69%) webpack
General
1 596 (29.22%) Finance
2 432 (21.18%) Social Skills
3 319 (15.64%) Banking
4 251 (12.30%) Analytical Skills
5 224 (10.98%) Inclusion and Diversity
6 156 (7.65%) Retail
7 123 (6.03%) Marketing
8 101 (4.95%) Public Sector
9 91 (4.46%) Legal
9 91 (4.46%) Local Government
10 84 (4.12%) Manufacturing
11 79 (3.87%) Presentation Skills
12 65 (3.19%) Influencing Skills
13 61 (2.99%) Law
14 43 (2.11%) Aviation
15 42 (2.06%) Automotive
16 38 (1.86%) Telecoms
17 37 (1.81%) Front Office
18 36 (1.76%) Aerospace
19 28 (1.37%) Organisational Skills
Job Titles
1 377 (18.48%) Senior
2 347 (17.01%) Developer
3 297 (14.56%) Architect
4 239 (11.72%) Lead
5 209 (10.25%) Analyst
6 140 (6.86%) Consultant
7 125 (6.13%) Senior Developer
8 121 (5.93%) Enterprise Architect
9 101 (4.95%) Data Engineer
9 101 (4.95%) Solutions Architect
10 95 (4.66%) Software Engineer
11 92 (4.51%) Data Scientist
12 84 (4.12%) Product Owner
13 79 (3.87%) Full Stack Developer
14 73 (3.58%) Digital Analyst
14 73 (3.58%) Operations Analyst
15 58 (2.84%) Business Manager
16 56 (2.75%) DevOps Engineer
17 55 (2.70%) Data Architect
18 54 (2.65%) Database Developer
Libraries, Frameworks & Software Standards
1 221 (10.83%) React
2 153 (7.50%) HTML
3 149 (7.30%) Kafka
4 146 (7.16%) .NET
5 104 (5.10%) CSS
6 101 (4.95%) OpenID
7 84 (4.12%) PyTorch
8 82 (4.02%) Node.js
9 73 (3.58%) TensorFlow
10 67 (3.28%) REST
11 55 (2.70%) Web Services
12 45 (2.21%) scikit-learn
13 43 (2.11%) AngularJS
14 42 (2.06%) JWT
15 41 (2.01%) JSON
16 40 (1.96%) Middleware
17 32 (1.57%) Jest
18 31 (1.52%) Pandas
18 31 (1.52%) XML
19 26 (1.27%) HTML5
Miscellaneous
1 167 (8.19%) Product Ownership
2 142 (6.96%) Blockchain
3 139 (6.81%) Algorithms
4 137 (6.72%) Public Cloud
5 118 (5.78%) Mainframe
6 83 (4.07%) Robotics
7 75 (3.68%) Cloud Native
8 68 (3.33%) IoT
9 61 (2.99%) Management Information System
10 52 (2.55%) Low-Code
11 50 (2.45%) Cyberattack
12 42 (2.06%) Data Centre
13 39 (1.91%) Fixed Income
14 37 (1.81%) Derivative
15 34 (1.67%) Onboarding
16 33 (1.62%) Hedge funds
17 31 (1.52%) Foreign Exchange (FX)
18 30 (1.47%) Equities
19 25 (1.23%) Greenfield Project
19 25 (1.23%) Self-Motivation
Operating Systems
1 171 (8.38%) Unix
2 128 (6.27%) Linux
3 86 (4.22%) Windows
4 48 (2.35%) Apple iOS
5 31 (1.52%) Android
6 14 (0.69%) VMS
7 10 (0.49%) zOS
8 9 (0.44%) Mac OS
9 8 (0.39%) Solaris
10 7 (0.34%) Windows Server
11 5 (0.25%) Ubuntu
12 4 (0.20%) Windows Server 2012
12 4 (0.20%) Windows Server 2016
12 4 (0.20%) Windows Server 2019
13 3 (0.15%) Windows 10
14 1 (0.049%) CentOS
14 1 (0.049%) Mac OS X
14 1 (0.049%) Windows 7
14 1 (0.049%) Windows 8
Processes & Methodologies
1 888 (43.53%) Machine Learning
2 782 (38.33%) Agile
3 502 (24.61%) Analytics
4 357 (17.50%) Roadmaps
5 355 (17.40%) DevOps
6 319 (15.64%) Data Science
7 298 (14.61%) Problem-Solving
8 262 (12.84%) Mentoring
8 262 (12.84%) Software Engineering
9 244 (11.96%) Computer Science
10 235 (11.52%) CI/CD
11 208 (10.20%) Digital Engineering
12 207 (10.15%) Business Intelligence
13 200 (9.80%) Visualisation
14 197 (9.66%) Microservices
15 194 (9.51%) Customer Service
16 180 (8.82%) Actionable Insight
17 178 (8.73%) Decision-Making
18 170 (8.33%) Data Analytics
19 162 (7.94%) Coaching
Programming Languages
1 515 (25.25%) Python
2 399 (19.56%) SQL
3 295 (14.46%) JavaScript
4 241 (11.81%) C#
5 199 (9.75%) Java
6 184 (9.02%) TypeScript
7 82 (4.02%) R
8 81 (3.97%) PL/SQL
9 69 (3.38%) C++
10 55 (2.70%) PHP
11 43 (2.11%) C
12 41 (2.01%) Go
13 37 (1.81%) Bash
14 29 (1.42%) PowerShell
15 24 (1.18%) Ruby
16 17 (0.83%) Perl
16 17 (0.83%) Scala
17 16 (0.78%) T-SQL
18 12 (0.59%) Groovy
18 12 (0.59%) Tcl
Qualifications
1 523 (25.64%) Degree
2 249 (12.21%) Security Cleared
3 135 (6.62%) SC Cleared
4 106 (5.20%) Computer Science Degree
5 82 (4.02%) DV Cleared
6 64 (3.14%) Master's Degree
7 45 (2.21%) PhD
8 29 (1.42%) Microsoft Certification
9 28 (1.37%) TOGAF Certification
10 24 (1.18%) BPSS Clearance
11 22 (1.08%) Numerate Degree
12 19 (0.93%) AWS Certification
12 19 (0.93%) Azure Certification
13 14 (0.69%) Cisco Certification
14 9 (0.44%) CCNA
15 7 (0.34%) CEH
15 7 (0.34%) DBS Check
16 6 (0.29%) GIAC
16 6 (0.29%) ISSAP
16 6 (0.29%) SANS
Quality Assurance & Compliance
1 104 (5.10%) Data Quality
2 57 (2.79%) QA
3 25 (1.23%) Accessibility
4 19 (0.93%) WCAG
5 14 (0.69%) Cyber Essentials
6 13 (0.64%) ISO/IEC 27001
7 12 (0.59%) SLA
8 10 (0.49%) GDPR
9 9 (0.44%) ISO 22301
10 6 (0.29%) COBIT
10 6 (0.29%) Cyber Essentials PLUS
10 6 (0.29%) IASME
11 5 (0.25%) IFRS
11 5 (0.25%) PMO
12 3 (0.15%) CRD IV
12 3 (0.15%) IEC 61508
12 3 (0.15%) ISO 20022
12 3 (0.15%) NIST
13 2 (0.098%) DO-178B
13 2 (0.098%) ISO 9001
System Software
1 207 (10.15%) Docker
2 28 (1.37%) Virtual Machines
3 21 (1.03%) Active Directory
4 16 (0.78%) VMware Infrastructure
5 9 (0.44%) Virtual Desktop
6 8 (0.39%) Hyper-V
6 8 (0.39%) Oracle RAC
7 7 (0.34%) VMware NSX
8 4 (0.20%) Firmware
9 3 (0.15%) KVM
9 3 (0.15%) VMware ESXi
10 2 (0.098%) HDFS
10 2 (0.098%) OpenSIPS
Systems Management
1 269 (13.19%) Kubernetes
2 163 (7.99%) Terraform
3 46 (2.25%) Ansible
4 18 (0.88%) HP Quality Center
5 15 (0.74%) Grafana
6 12 (0.59%) Puppet
7 9 (0.44%) Progress Chef
8 8 (0.39%) Data Guard
8 8 (0.39%) Oracle RMAN
8 8 (0.39%) Prometheus
9 7 (0.34%) FortiGate
10 6 (0.29%) Microsoft Intune
11 5 (0.25%) Single Sign-On
11 5 (0.25%) SysTrack
12 4 (0.20%) Jamf Pro
12 4 (0.20%) Kibana
12 4 (0.20%) Nagios
13 3 (0.15%) SCCM
13 3 (0.15%) vCenter Server
13 3 (0.15%) vRealize
Vendors
1 245 (12.01%) Microsoft
2 204 (10.00%) Google
3 142 (6.96%) Oracle
4 70 (3.43%) SAP
5 67 (3.28%) Databricks
6 58 (2.84%) IBM
7 45 (2.21%) VMware
8 41 (2.01%) Remedy
9 39 (1.91%) Salesforce
10 34 (1.67%) Capita
11 32 (1.57%) ServiceNow
12 30 (1.47%) PayPal
13 29 (1.42%) OpenAI
14 21 (1.03%) Informatica
15 18 (0.88%) Cisco
15 18 (0.88%) HP
16 17 (0.83%) Talend
17 16 (0.78%) Dell
18 15 (0.74%) Apple
19 14 (0.69%) Veracode