Legacy System
UK

The table below looks at the prevalence of the term Legacy Systems in permanent job vacancies. Included is a benchmarking guide to the salaries offered in vacancies that have cited Legacy Systems over the 6 months to 7 December 2023 with a comparison to the same period over the previous 2 years.

6 months to
7 Dec 2023
Same period 2022 Same period 2021
Rank 435 383 504
Rank change year-on-year -52 +121 -104
Permanent jobs citing Legacy Systems 318 1,035 749
As % of all permanent jobs advertised in the UK 0.60% 0.84% 0.58%
As % of the Miscellaneous category 1.63% 1.96% 1.33%
Number of salaries quoted 275 638 476
10th Percentile £39,887 £40,350 £31,250
25th Percentile £47,500 £54,000 £38,750
Median annual salary (50th Percentile) £62,500 £75,000 £55,000
Median % change year-on-year -16.67% +36.36% -18.52%
75th Percentile £85,750 £92,500 £72,500
90th Percentile £97,290 £120,000 £95,000
UK excluding London median annual salary £55,000 £62,500 £45,000
% change year-on-year -12.00% +38.89% -18.18%

All Generic Skills
UK

Legacy Systems is in the General and Transferable Skills category. The following table is for comparison with the above and provides summary statistics for all permanent job vacancies with a requirement for generic IT skills.

Permanent vacancies with a requirement for generic IT skills 19,511 52,884 56,385
As % of all permanent jobs advertised in the UK 36.83% 43.05% 44.00%
Number of salaries quoted 14,245 29,698 33,809
10th Percentile £33,000 £35,000 £33,750
25th Percentile £45,000 £46,250 £45,000
Median annual salary (50th Percentile) £62,500 £64,750 £60,000
Median % change year-on-year -3.47% +7.92% -
75th Percentile £83,750 £85,000 £82,500
90th Percentile £107,500 £106,000 £100,000
UK excluding London median annual salary £55,000 £55,000 £50,000
% change year-on-year - +10.00% -

Legacy Systems
Job Vacancy Trend

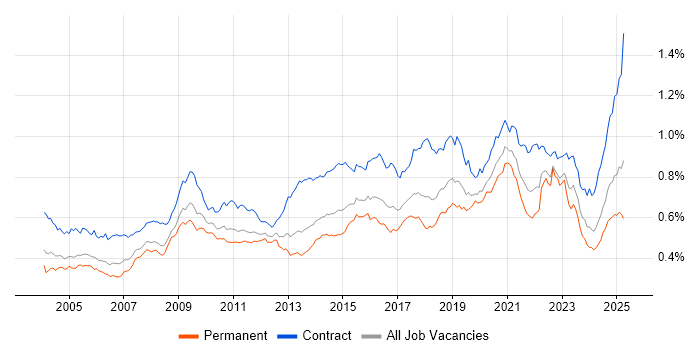
Job postings citing Legacy Systems as a proportion of all IT jobs advertised.

Job vacancy trend for Legacy Systems in the UK

Legacy Systems
Salary Trend

3-month moving average salary quoted in jobs citing Legacy Systems.

Salary trend for Legacy Systems in the UK

Legacy Systems
Salary Histogram

Salary distribution for jobs citing Legacy Systems over the 6 months to 7 December 2023.

Salary histogram for Legacy Systems in the UK

Legacy Systems
Top 17 Job Locations

The table below looks at the demand and provides a guide to the median salaries quoted in IT jobs citing Legacy Systems within the UK over the 6 months to 7 December 2023. The 'Rank Change' column provides an indication of the change in demand within each location based on the same 6 month period last year.

Location Rank Change
on Same Period
Last Year
Matching
Permanent
IT Job Ads
Median Salary
Past 6 Months
Median Salary
% Change
on Same Period
Last Year
Live
Jobs
England -36 287 £65,000 -13.33% 148
UK excluding London -1 213 £55,000 -12.00% 106
Work from Home -83 119 £60,000 -14.29% 79
London +26 93 £77,500 -8.82% 54
Midlands +122 58 £50,000 -20.00% 26
North of England -36 52 £65,000 +12.09% 31
West Midlands +119 47 £50,000 -33.33% 18
South East +88 42 £55,000 -15.38% 31
North West -39 38 £65,000 +9.20% 16
South West +34 29 £91,835 +59.71% 5
Scotland +30 17 £53,552 -28.60% 6
East of England +100 12 £55,000 +10.00% 7
Yorkshire +71 12 £50,000 - 11
East Midlands +55 11 £37,500 +7.14% 8
North East +45 2 £78,750 +12.50% 5
Wales +2 2 £63,250 +17.13% 3
Isle of Man - 2 £60,000 -

Legacy Systems
Co-occurring Skills and Capabilities by Category

The follow tables expand on the table above by listing co-occurrences grouped by category. The same employment type, locality and period is covered with up to 20 co-occurrences shown in each of the following categories:

Application Platforms
1 10 (3.14%) CMS
2 7 (2.20%) Apache
3 6 (1.89%) Confluence
3 6 (1.89%) WordPress
4 5 (1.57%) nginx
4 5 (1.57%) SharePoint
5 4 (1.26%) Apache Spark
5 4 (1.26%) Drupal
5 4 (1.26%) IIS
5 4 (1.26%) SharePoint Server
5 4 (1.26%) Tomcat
6 1 (0.31%) BizTalk Server
6 1 (0.31%) OpenStack
Applications
1 11 (3.46%) Microsoft Office
2 5 (1.57%) Microsoft Excel
3 3 (0.94%) MS Visio
4 1 (0.31%) Spreadsheet
Business Applications
1 46 (14.47%) NetSuite
2 17 (5.35%) Elite 3E
2 17 (5.35%) Remedy ITSM
3 9 (2.83%) Dynamics CRM
4 3 (0.94%) SAP S/4HANA
5 2 (0.63%) Magento
6 1 (0.31%) iTrent
6 1 (0.31%) JDE OneWorld
6 1 (0.31%) Oracle Assets
6 1 (0.31%) Oracle Procure-to-Pay
6 1 (0.31%) SAP CRM
6 1 (0.31%) SAP CX
Cloud Services
1 87 (27.36%) Azure
2 39 (12.26%) Power Platform
3 36 (11.32%) AWS
4 33 (10.38%) SaaS
5 19 (5.97%) Microsoft 365
6 18 (5.66%) Dynamics 365
7 16 (5.03%) Azure DevOps
8 15 (4.72%) GCP
9 11 (3.46%) PowerApps
10 10 (3.14%) Azure Cosmos DB
10 10 (3.14%) Power Automate
11 9 (2.83%) Azure AKS
11 9 (2.83%) PaaS
12 8 (2.52%) Azure Service Bus
12 8 (2.52%) IaaS
13 7 (2.20%) Azure Sentinel
14 6 (1.89%) Azure API Management
14 6 (1.89%) Azure Monitor
14 6 (1.89%) Cloud Composer
14 6 (1.89%) Cloudflare
Communications & Networking
1 16 (5.03%) Firewall
2 8 (2.52%) VPN
3 6 (1.89%) SD-WAN
4 5 (1.57%) BGP
4 5 (1.57%) IPv6
5 4 (1.26%) DHCP
5 4 (1.26%) DNS
5 4 (1.26%) SNMP
6 3 (0.94%) LAN
6 3 (0.94%) WAN
7 2 (0.63%) Multicast
7 2 (0.63%) Software-Defined Networking
7 2 (0.63%) TCP/IP
7 2 (0.63%) Wireless
8 1 (0.31%) Ethernet
8 1 (0.31%) Network Security
8 1 (0.31%) Reverse Proxy
8 1 (0.31%) Unified Communications
8 1 (0.31%) Wi-Fi
8 1 (0.31%) WLAN
Database & Business Intelligence
1 90 (28.30%) SQL Server
2 33 (10.38%) Power BI
3 26 (8.18%) MySQL
4 24 (7.55%) Relational Database
5 19 (5.97%) SQL Server Integration Services
6 15 (4.72%) Data Warehouse
7 11 (3.46%) NoSQL
8 9 (2.83%) Big Data
9 7 (2.20%) Azure SQL Database
9 7 (2.20%) Oracle Database
10 6 (1.89%) BigQuery
10 6 (1.89%) MongoDB
10 6 (1.89%) PostgreSQL
10 6 (1.89%) Redis
10 6 (1.89%) SQL Server Reporting Services
11 5 (1.57%) Data Lake
11 5 (1.57%) Hadoop
12 4 (1.26%) Apache Hive
12 4 (1.26%) Geospatial Data
12 4 (1.26%) HBase
Development Applications
1 38 (11.95%) Git
2 31 (9.75%) Jenkins
3 21 (6.60%) Sonatype Nexus
4 13 (4.09%) JIRA
5 9 (2.83%) TeamCity
6 8 (2.52%) Visual Studio
7 7 (2.20%) Bitbucket
7 7 (2.20%) Team Foundation Server
8 6 (1.89%) Cucumber
8 6 (1.89%) Cypress.io
8 6 (1.89%) Spinnaker
9 5 (1.57%) Artifactory
9 5 (1.57%) Maven
9 5 (1.57%) Octopus Deploy
10 4 (1.26%) Atlassian Bamboo
10 4 (1.26%) Bitbucket Server
10 4 (1.26%) JUnit
11 2 (0.63%) Subversion
12 1 (0.31%) NUnit
12 1 (0.31%) PowerDesigner
General
1 126 (39.62%) Social Skills
2 114 (35.85%) Finance
3 28 (8.81%) Banking
4 26 (8.18%) Analytical Skills
5 25 (7.86%) Legal
6 15 (4.72%) Marketing
7 14 (4.40%) Inclusion and Diversity
7 14 (4.40%) Law
8 12 (3.77%) Public Sector
9 9 (2.83%) Retail
10 8 (2.52%) Advertising
11 5 (1.57%) Back Office
11 5 (1.57%) Influencing Skills
11 5 (1.57%) Organisational Skills
12 4 (1.26%) Financial Institution
12 4 (1.26%) Manufacturing
12 4 (1.26%) Private Banking
13 3 (0.94%) Automotive
14 2 (0.63%) Telecoms
15 1 (0.31%) Military
Job Titles
1 85 (26.73%) Developer
2 68 (21.38%) Senior
3 57 (17.92%) Architect
4 52 (16.35%) Consultant
5 44 (13.84%) Functional Consultant
5 44 (13.84%) NetSuite Consultant
5 44 (13.84%) Senior Consultant
5 44 (13.84%) Senior Functional Consultant
6 28 (8.81%) Technical Architect
7 27 (8.49%) Solutions Architect
8 23 (7.23%) .NET Developer
8 23 (7.23%) C# Developer
9 21 (6.60%) Lead
10 19 (5.97%) Technical Solutions Architect
11 18 (5.66%) ServiceNow Architect
11 18 (5.66%) Software Engineer
12 16 (5.03%) Analyst
13 15 (4.72%) Software Developer
14 14 (4.40%) Data Engineer
15 12 (3.77%) VB.NET Developer
Libraries, Frameworks & Software Standards
1 62 (19.50%) .NET
1 62 (19.50%) HTML
2 36 (11.32%) CSS
2 36 (11.32%) Web Services
3 34 (10.69%) REST
4 32 (10.06%) ASP.NET
5 31 (9.75%) JSON
6 24 (7.55%) XML
7 23 (7.23%) RESTful
8 21 (6.60%) SOAP
9 18 (5.66%) AngularJS
9 18 (5.66%) Spring Boot
10 17 (5.35%) HTML5
10 17 (5.35%) Node.js
10 17 (5.35%) React
11 15 (4.72%) .NET Core
12 12 (3.77%) Spring
13 9 (2.83%) CSS3
14 8 (2.52%) .NET Framework
14 8 (2.52%) WinForms
Miscellaneous
1 30 (9.43%) Management Information System
2 24 (7.55%) Cloud Native
3 18 (5.66%) Public Cloud
4 14 (4.40%) Distributed Applications
5 7 (2.20%) Greenfield Project
5 7 (2.20%) Mainframe
6 6 (1.89%) Distributed Architecture
6 6 (1.89%) Virtual Team
7 5 (1.57%) Algorithms
7 5 (1.57%) Legacy Applications
8 4 (1.26%) Data Centre
8 4 (1.26%) Distributed Systems
8 4 (1.26%) Driving Licence
8 4 (1.26%) Embedded Systems
8 4 (1.26%) Enterprise Storage
8 4 (1.26%) Product Ownership
9 3 (0.94%) Clustering
9 3 (0.94%) Data Structures
9 3 (0.94%) Legacy Code
9 3 (0.94%) Replication
Operating Systems
1 18 (5.66%) Linux
2 17 (5.35%) Windows
3 9 (2.83%) Windows Server
3 9 (2.83%) Windows Server 2019
4 8 (2.52%) CentOS
5 7 (2.20%) Unix
6 6 (1.89%) Ubuntu
7 5 (1.57%) Windows 10
8 4 (1.26%) Windows Server 2012
8 4 (1.26%) Windows Server 2016
9 2 (0.63%) OpenBSD
Processes & Methodologies
1 118 (37.11%) Agile
2 107 (33.65%) Migration
3 91 (28.62%) Problem-Solving
4 69 (21.70%) Data Migration
5 57 (17.92%) DevOps
6 50 (15.72%) Process Improvement
7 48 (15.09%) Procure-to-Pay
8 46 (14.47%) Order to Cash
9 45 (14.15%) Record to Report
9 45 (14.15%) User Acceptance Testing
10 43 (13.52%) Software Engineering
11 41 (12.89%) Analytics
12 37 (11.64%) CI/CD
12 37 (11.64%) Computer Science
13 36 (11.32%) Microservices
14 32 (10.06%) Business Intelligence
14 32 (10.06%) Project Management
15 31 (9.75%) Continuous Improvement
15 31 (9.75%) Project Delivery
16 28 (8.81%) Mentoring
Programming Languages
1 96 (30.19%) JavaScript
2 90 (28.30%) SQL
3 67 (21.07%) C#
4 50 (15.72%) Python
5 38 (11.95%) Java
6 29 (9.12%) PowerShell
7 27 (8.49%) Bash
8 24 (7.55%) Perl
9 21 (6.60%) TypeScript
10 16 (5.03%) VB.NET
11 15 (4.72%) PHP
12 14 (4.40%) T-SQL
13 13 (4.09%) Groovy
14 10 (3.14%) Scala
15 9 (2.83%) Go
16 7 (2.20%) Delphi
16 7 (2.20%) PL/SQL
17 6 (1.89%) C
17 6 (1.89%) Data Analysis Expressions
17 6 (1.89%) Kusto Query Language
Qualifications
1 66 (20.75%) Degree
2 23 (7.23%) Security Cleared
3 21 (6.60%) Computer Science Degree
4 16 (5.03%) SC Cleared
5 6 (1.89%) Master's Degree
6 5 (1.57%) AWS Certification
6 5 (1.57%) DV Cleared
7 4 (1.26%) CISSP
7 4 (1.26%) TOGAF Certification
8 3 (0.94%) CBAP
8 3 (0.94%) CISM
8 3 (0.94%) IIBA
8 3 (0.94%) Microsoft Certification
8 3 (0.94%) PMI Certification
9 2 (0.63%) Azure Certification
9 2 (0.63%) ITIL Certification
9 2 (0.63%) PMP
10 1 (0.31%) BPSS Clearance
10 1 (0.31%) Cisco Certification
10 1 (0.31%) ISEB
Quality Assurance & Compliance
1 19 (5.97%) Data Quality
2 11 (3.46%) ISO/IEC 27001
3 9 (2.83%) Accessibility
4 8 (2.52%) QA
5 6 (1.89%) ISO 9000
5 6 (1.89%) PCI DSS
6 4 (1.26%) GDPR
7 2 (0.63%) RMADS
8 1 (0.31%) Cyber Essentials
8 1 (0.31%) PMO
System Software
1 25 (7.86%) Docker
2 13 (4.09%) VMware Infrastructure
3 6 (1.89%) Active Directory
3 6 (1.89%) Hyper-V
4 4 (1.26%) HDFS
4 4 (1.26%) Virtual Machines
5 3 (0.94%) KVM
5 3 (0.94%) VMware ESXi
6 2 (0.63%) Postfix
Systems Management
1 36 (11.32%) Kubernetes
2 18 (5.66%) Terraform
3 12 (3.77%) Ansible
4 5 (1.57%) Cobbler
4 5 (1.57%) Grafana
4 5 (1.57%) Microsoft Intune
5 4 (1.26%) Jamf Pro
5 4 (1.26%) Puppet
5 4 (1.26%) ZABBIX
6 3 (0.94%) Istio
6 3 (0.94%) Nagios
6 3 (0.94%) vCenter Server
6 3 (0.94%) vRealize
7 1 (0.31%) Active Directory Federation Services
7 1 (0.31%) Kibana
7 1 (0.31%) Packer
7 1 (0.31%) Progress Chef
Vendors
1 63 (19.81%) Microsoft
2 35 (11.01%) Oracle
3 22 (6.92%) HP
4 18 (5.66%) ServiceNow
5 17 (5.35%) BMC
5 17 (5.35%) Remedy
6 14 (4.40%) SAP
7 13 (4.09%) Google
7 13 (4.09%) VMware
8 7 (2.20%) Cisco
8 7 (2.20%) Databricks
9 6 (1.89%) Palo Alto
9 6 (1.89%) Red Hat
10 4 (1.26%) Atlassian
10 4 (1.26%) Cloudera
10 4 (1.26%) Dynatrace
10 4 (1.26%) Informatica
10 4 (1.26%) Sonatype
10 4 (1.26%) Splunk
11 3 (0.94%) Guidewire