JavaScript Job Trends

JavaScript (including ECMAScript)
UK

The table below provides summary statistics and salary benchmarking for jobs requiring JavaScript skills. It covers vacancies from the 6 months leading up to 18 September 2025, with comparisons to the same periods in the previous two years.

6 months to
18 Sep 2025
Same period 2024 Same period 2023
Rank 37 18 16
Rank change year-on-year -19 -2 -3
Permanent jobs citing JavaScript 2,749 6,063 5,887
As % of all permanent jobs advertised in the UK 5.56% 7.76% 9.77%
As % of the Programming Languages category 20.97% 25.10% 23.92%
Number of salaries quoted 1,688 3,851 5,214
10th Percentile £36,250 £35,000 £39,954
25th Percentile £47,500 £46,250 £48,750
Median annual salary (50th Percentile) £65,000 £62,168 £65,000
Median % change year-on-year +4.56% -4.36% +8.33%
75th Percentile £90,750 £87,500 £82,500
90th Percentile £132,500 £122,500 £102,500
UK excluding London median annual salary £55,000 £55,000 £55,457
% change year-on-year - -0.82% +0.83%

All Programming Languages
UK

JavaScript falls under the Programming Languages category. For comparison with the information above, the following table provides summary statistics for all permanent job vacancies requiring coding skills.

Permanent vacancies with a requirement for coding skills 13,110 24,157 24,608
As % of all permanent jobs advertised in the UK 26.51% 30.93% 40.83%
Number of salaries quoted 8,456 15,118 20,186
10th Percentile £33,750 £37,500 £39,557
25th Percentile £46,250 £47,025 £48,750
Median annual salary (50th Percentile) £62,500 £62,500 £65,000
Median % change year-on-year - -3.85% +4.00%
75th Percentile £83,750 £82,500 £85,000
90th Percentile £111,250 £107,500 £106,250
UK excluding London median annual salary £55,000 £55,000 £55,000

JavaScript
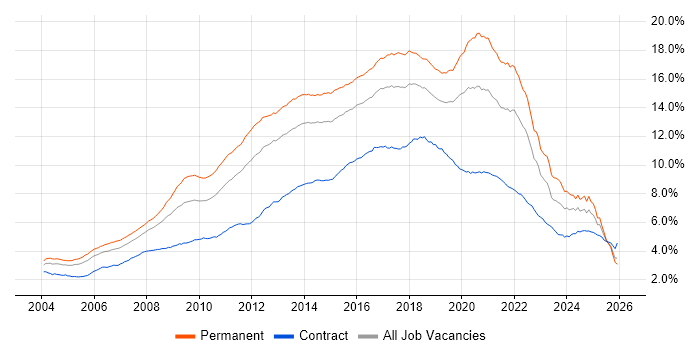
Job Vacancy Trend

Job postings citing JavaScript as a proportion of all IT jobs advertised.

Job vacancy trend for JavaScript in the UK

JavaScript
Salary Trend

Salary distribution trend for jobs in the UK citing JavaScript.

Salary distribution trend for jobs in the UK citing JavaScript

JavaScript
Salary Histogram

Salary distribution for jobs citing JavaScript over the 6 months to 18 September 2025.

Salary histogram for JavaScript in the UK

JavaScript
Top 18 Job Locations

The table below looks at the demand and provides a guide to the median salaries quoted in IT jobs citing JavaScript within the UK over the 6 months to 18 September 2025. The 'Rank Change' column provides an indication of the change in demand within each location based on the same 6 month period last year.

Location Rank Change
on Same Period
Last Year
Matching
Permanent
IT Job Ads
Median Salary
Past 6 Months
Median Salary
% Change
on Same Period
Last Year
Live
Jobs
England -19 2,490 £65,000 - 1,797
UK excluding London -23 1,699 £55,000 - 1,519
Work from Home -3 1,596 £70,000 - 951
London -13 935 £90,000 - 597
North of England -13 605 £57,500 +4.55% 371
North West -8 456 £60,000 +14.29% 191
South East -39 351 £65,000 +18.18% 455
Midlands -26 272 £55,000 +10.00% 254
East of England -37 162 £55,000 -4.35% 141
South West -26 149 £50,000 -7.27% 176
West Midlands -22 140 £50,000 -4.76% 140
East Midlands -16 133 £60,000 +26.32% 105
Scotland -21 129 £57,500 -4.17% 70
Yorkshire -32 122 £56,750 +3.18% 129
Wales -28 35 £64,750 +48.00% 53
North East -25 29 £50,000 -16.67% 58
Northern Ireland -10 7 £80,000 +95.12% 17
Isle of Man +10 1 £52,500 -

JavaScript
Co-occurring Skills and Capabilities by Category

The follow tables expand on the table above by listing co-occurrences grouped by category. The same employment type, locality and period is covered with up to 20 co-occurrences shown in each of the following categories:

Application Platforms
1 197 (7.17%) Confluence
2 187 (6.80%) Apache Airflow
3 106 (3.86%) Apache
4 79 (2.87%) CMS
5 63 (2.29%) SharePoint
6 50 (1.82%) WordPress
7 49 (1.78%) IIS
8 23 (0.84%) Headless CMS
9 18 (0.65%) Umbraco
10 12 (0.44%) Apache Solr
11 11 (0.40%) Drupal
12 9 (0.33%) Tomcat
13 8 (0.29%) ArcGIS
13 8 (0.29%) Microsoft Exchange
14 7 (0.25%) nginx
15 4 (0.15%) Apache Spark
15 4 (0.15%) EPiServer
16 3 (0.11%) Liferay
17 2 (0.073%) Alfresco
17 2 (0.073%) Mendix
Applications
1 43 (1.56%) Microsoft Office
2 33 (1.20%) Adobe XD
3 18 (0.65%) Chatbot
4 17 (0.62%) Microsoft Excel
5 16 (0.58%) Sketch
6 15 (0.55%) Adobe Creative Suite
7 12 (0.44%) Photoshop
8 11 (0.40%) Adobe Illustrator
9 9 (0.33%) InVision
10 7 (0.25%) MadCap Flare
11 3 (0.11%) Elementor
11 3 (0.11%) Simulink
12 2 (0.073%) Trello
13 1 (0.036%) Microsoft PowerPoint
13 1 (0.036%) MS Visio
Business Applications
1 67 (2.44%) Dynamics CRM
2 29 (1.05%) NetSuite
3 27 (0.98%) Shopify
4 13 (0.47%) Magento
5 12 (0.44%) Sprinklr
6 9 (0.33%) Infor CloudSuite
6 9 (0.33%) Infor CloudSuite Industrial (formerly SyteLine)
7 6 (0.22%) Workday HCM
8 4 (0.15%) JDE OneWorld
8 4 (0.15%) Payment Gateway
8 4 (0.15%) PlanetPress Connect
8 4 (0.15%) Sage 1000
9 3 (0.11%) Adobe Campaign
10 2 (0.073%) MFGPRO
10 2 (0.073%) SAP Business One
11 1 (0.036%) Odoo
11 1 (0.036%) Remedy ITSM
11 1 (0.036%) Salesforce CRM
11 1 (0.036%) SAP S/4HANA
Cloud Services
1 1,317 (47.91%) AWS
2 1,130 (41.11%) Azure
3 622 (22.63%) GCP
4 191 (6.95%) dbt
5 189 (6.88%) Serverless
6 160 (5.82%) GitHub
7 150 (5.46%) SaaS
8 133 (4.84%) Power Platform
9 122 (4.44%) Azure DevOps
10 110 (4.00%) Power Automate
11 95 (3.46%) Snowflake
12 87 (3.16%) Dynamics 365
13 86 (3.13%) Amazon EKS
14 84 (3.06%) PowerApps
15 76 (2.76%) Figma
16 70 (2.55%) AWS CloudFormation
17 69 (2.51%) Microsoft 365
18 65 (2.36%) AWS Lambda
19 61 (2.22%) Amazon S3
20 59 (2.15%) Amazon EC2
Communications & Networking
1 69 (2.51%) VPN
2 65 (2.36%) TCP/IP
3 46 (1.67%) Internet
4 27 (0.98%) HTTP
5 14 (0.51%) Broadband
6 10 (0.36%) MQTT
6 10 (0.36%) SSL
7 9 (0.33%) DMARC
8 8 (0.29%) Firewall
8 8 (0.29%) WPA
9 6 (0.22%) Ethernet
9 6 (0.22%) Modbus
9 6 (0.22%) Wi-Fi
10 5 (0.18%) HTTPS
11 4 (0.15%) SMS
12 3 (0.11%) DNS
12 3 (0.11%) Intranet
13 2 (0.073%) AMQP
13 2 (0.073%) Network Security
14 1 (0.036%) DMVPN
Database & Business Intelligence
1 494 (17.97%) SQL Server
2 260 (9.46%) PostgreSQL
3 194 (7.06%) Amazon Athena
4 191 (6.95%) MySQL
5 190 (6.91%) Apache Iceberg
6 186 (6.77%) Apache Arrow
6 186 (6.77%) Dremio
7 150 (5.46%) MongoDB
8 140 (5.09%) Elasticsearch
9 136 (4.95%) NoSQL
10 101 (3.67%) Relational Database
11 91 (3.31%) Data Lake
12 89 (3.24%) Apache Ignite
13 69 (2.51%) Power BI
14 50 (1.82%) Azure SQL Database
15 40 (1.46%) SQL Server Reporting Services
16 36 (1.31%) RDBMS
17 26 (0.95%) SQL Server Integration Services
18 25 (0.91%) GIS
18 25 (0.91%) Redis
Development Applications
1 432 (15.71%) Git
2 385 (14.01%) JIRA
3 322 (11.71%) Cucumber
4 301 (10.95%) Selenium
5 289 (10.51%) GitLab
6 279 (10.15%) Maven
7 274 (9.97%) Bitbucket
8 270 (9.82%) SonarQube
9 262 (9.53%) Sonatype Nexus
10 112 (4.07%) Jenkins
11 76 (2.76%) Cypress.io
12 69 (2.51%) JUnit
13 64 (2.33%) Robot Framework
14 56 (2.04%) webpack
15 49 (1.78%) JMeter
16 38 (1.38%) Postman
17 32 (1.16%) Mockito
18 29 (1.05%) Vite
19 28 (1.02%) Visual Studio
20 25 (0.91%) TeamCity
General
1 853 (31.03%) Finance
2 669 (24.34%) Inclusion and Diversity
3 628 (22.84%) Social Skills
4 438 (15.93%) Banking
5 251 (9.13%) Front Office
6 230 (8.37%) Analytical Skills
7 215 (7.82%) Law
8 200 (7.28%) Investment Banking
9 158 (5.75%) Retail
10 131 (4.77%) Marketing
11 106 (3.86%) Public Sector
12 90 (3.27%) Corporate Banking
13 69 (2.51%) Telecoms
14 43 (1.56%) Multimedia
15 41 (1.49%) Manufacturing
16 38 (1.38%) Games
16 38 (1.38%) Legal
17 32 (1.16%) Organisational Skills
18 31 (1.13%) Advertising
19 26 (0.95%) Presentation Skills
Job Titles
1 1,218 (44.31%) Developer
2 876 (31.87%) Software Engineer
3 671 (24.41%) Senior
4 322 (11.71%) Senior Software Engineer
5 251 (9.13%) Senior Developer
6 244 (8.88%) Full-Stack Developer
7 240 (8.73%) Lead
8 200 (7.28%) AWS Engineer
9 189 (6.88%) AWS Software Engineer
9 189 (6.88%) Software Developer
10 174 (6.33%) Python Engineer
11 167 (6.07%) Python Software Engineer
12 162 (5.89%) Java Engineer
13 159 (5.78%) Developer/Software Engineer
14 146 (5.31%) Java Software Engineer
15 140 (5.09%) .NET Developer
16 110 (4.00%) AWS Developer
17 108 (3.93%) Front-End Developer (Client-Side Developer)
18 106 (3.86%) Java Developer
19 99 (3.60%) Python Developer
Libraries, Frameworks & Software Standards
1 1,134 (41.25%) HTML
2 1,077 (39.18%) React
3 984 (35.79%) CSS
4 694 (25.25%) .NET
5 658 (23.94%) Node.js
6 370 (13.46%) Spring
7 366 (13.31%) AngularJS
8 359 (13.06%) REST
9 353 (12.84%) Spring Boot
10 336 (12.22%) Redux
11 322 (11.71%) Kafka
12 294 (10.69%) RESTful
13 290 (10.55%) Vue
14 274 (9.97%) HTML5
15 252 (9.17%) JPA
16 243 (8.84%) Pandas
17 216 (7.86%) Hibernate
18 214 (7.78%) CSS3
19 190 (6.91%) NumPy
20 186 (6.77%) SciPy
Miscellaneous
1 356 (12.95%) Product Ownership
2 288 (10.48%) Enterprise Software
3 255 (9.28%) Linux Command Line
4 251 (9.13%) Self-Motivation
5 248 (9.02%) Fixed Income
6 227 (8.26%) Cyberattack
7 215 (7.82%) Foreign Exchange (FX)
8 209 (7.60%) Equities
9 130 (4.73%) Cloud Native
10 102 (3.71%) Hedge funds
11 90 (3.27%) Derivative
12 89 (3.24%) Pricing Data
13 69 (2.51%) Mobile App
14 68 (2.47%) Distributed Systems
15 44 (1.60%) Algorithms
16 28 (1.02%) Data Structures
17 24 (0.87%) Analytical Mindset
17 24 (0.87%) Legacy Systems
18 23 (0.84%) Greenfield Project
19 22 (0.80%) Public Cloud
Operating Systems
1 445 (16.19%) Linux
2 135 (4.91%) Windows
3 74 (2.69%) Android
4 41 (1.49%) Unix
5 23 (0.84%) Windows Server
6 21 (0.76%) Apple iOS
7 10 (0.36%) Mac OS
8 5 (0.18%) Embedded Linux
9 3 (0.11%) Ubuntu
10 1 (0.036%) CentOS
10 1 (0.036%) Debian
10 1 (0.036%) FreeRTOS
Processes & Methodologies
1 1,582 (57.55%) Agile
2 1,149 (41.80%) Software Engineering
3 807 (29.36%) CI/CD
4 739 (26.88%) Full-Stack Development
5 735 (26.74%) Microservices
6 707 (25.72%) DevOps
7 651 (23.68%) Mentoring
8 620 (22.55%) User Experience
9 548 (19.93%) Test Automation
10 536 (19.50%) Problem-Solving
11 491 (17.86%) Front End Development
12 456 (16.59%) SDLC
13 429 (15.61%) Containerisation
14 388 (14.11%) Scrum
15 343 (12.48%) Continuous Improvement
16 341 (12.40%) Clean Code
17 334 (12.15%) TDD
18 325 (11.82%) Performance Optimisation
19 304 (11.06%) Machine Learning
20 257 (9.35%) Artificial Intelligence
Programming Languages
1 1,046 (38.05%) Java
2 1,011 (36.78%) Python
3 933 (33.94%) TypeScript
4 854 (31.07%) SQL
5 555 (20.19%) C#
6 314 (11.42%) C++
7 292 (10.62%) Go
8 284 (10.33%) Rust
9 214 (7.78%) PHP
10 122 (4.44%) PowerShell
11 81 (2.95%) R
12 80 (2.91%) Bash
13 71 (2.58%) C
14 63 (2.29%) Ruby
15 55 (2.00%) MATLAB
16 49 (1.78%) Dart
17 34 (1.24%) VB.NET
18 32 (1.16%) T-SQL
19 29 (1.05%) Shell Script
20 26 (0.95%) PL/SQL
Qualifications
1 395 (14.37%) Security Cleared
2 386 (14.04%) Degree
3 257 (9.35%) DV Cleared
4 253 (9.20%) AWS Certification
5 190 (6.91%) AWS Certified Developer
5 190 (6.91%) AWS Certified Solutions Architect
6 172 (6.26%) Computer Science Degree
7 116 (4.22%) SC Cleared
8 79 (2.87%) Microsoft Certification
9 58 (2.11%) Azure Certification
10 39 (1.42%) AWS Certified Cloud Practitioner
11 22 (0.80%) Master's Degree
12 14 (0.51%) ISTQB
13 11 (0.40%) TOGAF Certification
14 7 (0.25%) BPSS Clearance
14 7 (0.25%) DBS Check
14 7 (0.25%) HND
15 6 (0.22%) Chartered Engineer
15 6 (0.22%) HNC
16 5 (0.18%) ISTQB Foundation Certification
Quality Assurance & Compliance
1 478 (17.39%) QA
2 228 (8.29%) Accessibility
3 60 (2.18%) GDPR
4 45 (1.64%) WCAG
5 18 (0.65%) ISO/IEC 27001
6 13 (0.47%) Data Quality
7 11 (0.40%) HL7
8 8 (0.29%) SLA
9 3 (0.11%) Software Quality Assurance
10 2 (0.073%) PSD2
11 1 (0.036%) Actionable Recommendations
11 1 (0.036%) DICOM
11 1 (0.036%) HIPAA
11 1 (0.036%) ISO 9001
11 1 (0.036%) PMO
System Software
1 571 (20.77%) Docker
2 21 (0.76%) Active Directory
3 7 (0.25%) VMware Infrastructure
4 6 (0.22%) VMware ESXi
5 5 (0.18%) Hyper-V
6 2 (0.073%) Firmware
7 1 (0.036%) HDFS
7 1 (0.036%) KVM
Systems Management
1 502 (18.26%) Kubernetes
2 151 (5.49%) Terraform
3 72 (2.62%) Ansible
4 35 (1.27%) Kibana
5 31 (1.13%) Grafana
6 29 (1.05%) Single Sign-On
7 19 (0.69%) Prometheus
8 10 (0.36%) Istio
9 9 (0.33%) Microsoft Intune
10 6 (0.22%) Functional Safety
10 6 (0.22%) Jamf Pro
11 4 (0.15%) Kustomize
12 3 (0.11%) Argo
12 3 (0.11%) HP Quality Center
12 3 (0.11%) Progress Chef
13 1 (0.036%) HP UCMDB
13 1 (0.036%) Marathon
13 1 (0.036%) Matomo
13 1 (0.036%) Puppet
13 1 (0.036%) vRealize
Vendors
1 397 (14.44%) Microsoft
2 247 (8.99%) Solace
3 109 (3.97%) Oracle
4 82 (2.98%) Google
5 77 (2.80%) ServiceNow
6 75 (2.73%) Adobe
7 42 (1.53%) Splunk
8 39 (1.42%) Salesforce
9 37 (1.35%) Dynatrace
10 28 (1.02%) Cisco
11 17 (0.62%) MuleSoft
12 15 (0.55%) Apple
12 15 (0.55%) Atlassian
12 15 (0.55%) HubSpot
13 13 (0.47%) DevExpress
13 13 (0.47%) VMware
14 12 (0.44%) Rollbar
15 11 (0.40%) Meraki
15 11 (0.40%) OpenAI
15 11 (0.40%) SAP