Salesforce
UK

The table below provides summary statistics for permanent job vacancies with a requirement for knowledge and experience of Salesforce products and/or services. Included is a benchmarking guide to the salaries offered in vacancies that have cited Salesforce over the 6 months to 10 December 2023 with a comparison to the same period in the previous 2 years.

The figures below represent the IT labour market in general and are not representative of salaries within Salesforce.

6 months to
10 Dec 2023
Same period 2022 Same period 2021
Rank 150 162 148
Rank change year-on-year +12 -14 +31
Permanent jobs citing Salesforce 1,174 2,852 3,284
As % of all permanent jobs advertised in the UK 2.25% 2.33% 2.58%
As % of the Vendors category 5.35% 5.68% 6.58%
Number of salaries quoted 922 1,535 1,904
10th Percentile £32,500 £38,750 £37,500
25th Percentile £38,000 £50,000 £47,500
Median annual salary (50th Percentile) £60,000 £66,000 £62,500
Median % change year-on-year -9.09% +5.60% +4.17%
75th Percentile £75,000 £85,000 £80,000
90th Percentile £95,000 £105,000 £95,000
UK excluding London median annual salary £45,000 £58,500 £55,500
% change year-on-year -23.08% +5.41% +5.71%

All Vendors
UK

Salesforce is in the Vendor Products and Services category. The following table is for comparison with the above and provides summary statistics for all permanent job vacancies with a requirement for knowledge or experience of vendor products and services.

Permanent vacancies with a requirement for knowledge or experience of vendor products and services 21,950 50,228 49,937
As % of all permanent jobs advertised in the UK 41.99% 41.09% 39.30%
Number of salaries quoted 16,048 29,606 33,465
10th Percentile £29,000 £31,250 £30,000
25th Percentile £39,742 £41,250 £39,750
Median annual salary (50th Percentile) £55,000 £57,500 £55,000
Median % change year-on-year -4.35% +4.55% +4.76%
75th Percentile £73,750 £77,500 £73,750
90th Percentile £91,934 £95,000 £88,750
UK excluding London median annual salary £49,000 £50,000 £47,500
% change year-on-year -2.00% +5.26% +3.26%

Salesforce
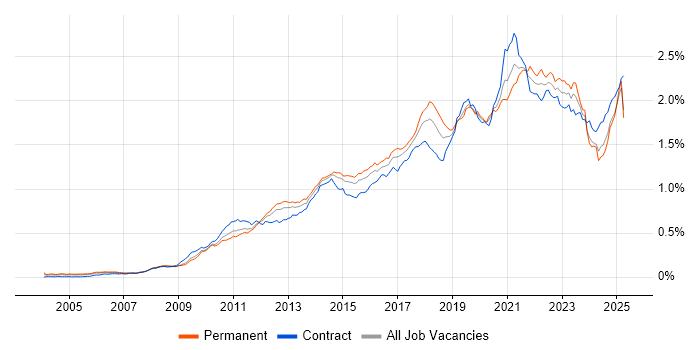
Job Vacancy Trend

Job postings citing Salesforce as a proportion of all IT jobs advertised.

Job vacancy trend for Salesforce in the UK

Salesforce
Salary Trend

3-month moving average salary quoted in jobs citing Salesforce.

Salary trend for Salesforce in the UK

Salesforce
Salary Histogram

Salary distribution for jobs citing Salesforce over the 6 months to 10 December 2023.

Salary histogram for Salesforce in the UK

Salesforce
Top 17 Job Locations

The table below looks at the demand and provides a guide to the median salaries quoted in IT jobs citing Salesforce within the UK over the 6 months to 10 December 2023. The 'Rank Change' column provides an indication of the change in demand within each location based on the same 6 month period last year.

Location Rank Change
on Same Period
Last Year
Matching
Permanent
IT Job Ads
Median Salary
Past 6 Months
Median Salary
% Change
on Same Period
Last Year
Live
Jobs
England -1 1,053 £60,000 -7.69% 643
UK excluding London +47 636 £45,000 -23.08% 307
Work from Home +43 524 £46,000 -29.23% 312
London -41 398 £70,000 -3.45% 313
South East +70 212 £38,000 -33.91% 85
North of England +73 174 £50,000 -20.00% 100
Midlands +81 105 £55,000 -5.98% 36
North West +75 94 £46,000 -26.98% 52
West Midlands +103 79 £52,500 -10.26% 27
Yorkshire +52 71 £50,000 -16.67% 38
South West +14 69 £48,000 -4.00% 40
Scotland +45 34 £65,288 -15.76% 7
East Midlands +25 26 £58,750 +23.68% 9
East of England +26 22 £60,000 +4.35% 30
Wales +16 19 £60,000 +36.36% 8
North East +35 13 £60,000 -20.00% 16
Northern Ireland +24 1 - - 2

Salesforce
Co-occurring Skills and Capabilities by Category

The follow tables expand on the table above by listing co-occurrences grouped by category. The same employment type, locality and period is covered with up to 20 co-occurrences shown in each of the following categories:

Application Platforms
1 49 (4.17%) Confluence
2 38 (3.24%) SharePoint
3 12 (1.02%) Anypoint
4 9 (0.77%) WordPress
5 8 (0.68%) CMS
6 5 (0.43%) Adobe Experience Manager
7 4 (0.34%) IIS
8 2 (0.17%) Alfresco
8 2 (0.17%) Apache
8 2 (0.17%) Documentum
8 2 (0.17%) FileNet
8 2 (0.17%) MODX
8 2 (0.17%) MS Exchange
8 2 (0.17%) SAS
8 2 (0.17%) Site Server
9 1 (0.085%) Headless CMS
Applications
1 57 (4.86%) Microsoft Office
2 25 (2.13%) Microsoft Excel
3 17 (1.45%) MS Visio
4 16 (1.36%) Microsoft Project
5 8 (0.68%) Microsoft PowerPoint
6 5 (0.43%) Spreadsheet
7 2 (0.17%) Trello
8 1 (0.085%) Simulink
8 1 (0.085%) SOLIDWORKS
Business Applications
1 68 (5.79%) Salesforce CRM
2 13 (1.11%) NetSuite
3 12 (1.02%) SAP S/4HANA
3 12 (1.02%) Unit4 Business World
4 11 (0.94%) Dynamics CRM
5 6 (0.51%) SAP CRM
6 5 (0.43%) Magento
7 4 (0.34%) SAP ERP
8 3 (0.26%) Eikon
8 3 (0.26%) FastStats
8 3 (0.26%) Sparx Enterprise Architect
9 2 (0.17%) Eloqua
9 2 (0.17%) Remedy ITSM
9 2 (0.17%) Shopify
10 1 (0.085%) Dynamics NAV
10 1 (0.085%) SAP Business One
10 1 (0.085%) SAP GTS
10 1 (0.085%) SAP Retail
10 1 (0.085%) SAP SCM
10 1 (0.085%) Unica
Cloud Services
1 99 (8.43%) Azure
2 77 (6.56%) AWS
2 77 (6.56%) Salesforce Service Cloud
3 69 (5.88%) Microsoft 365
4 62 (5.28%) Power Platform
5 57 (4.86%) Salesforce Sales Cloud
6 56 (4.77%) SaaS
7 48 (4.09%) GCP
8 39 (3.32%) FinancialForce
9 36 (3.07%) Google Analytics
10 20 (1.70%) GitHub
11 19 (1.62%) Canva
12 18 (1.53%) Dynamics 365
12 18 (1.53%) Salesforce Commerce Cloud
13 15 (1.28%) IaaS
14 14 (1.19%) Entra ID
15 13 (1.11%) Azure DevOps
15 13 (1.11%) PaaS
16 12 (1.02%) SurveyMonkey
17 7 (0.60%) Figma
Communications & Networking
1 15 (1.28%) IP Telephony
2 10 (0.85%) DNS
2 10 (0.85%) Wireless
3 8 (0.68%) TCP/IP
4 7 (0.60%) Firewall
4 7 (0.60%) VLAN
4 7 (0.60%) VoIP
5 6 (0.51%) DHCP
5 6 (0.51%) Multicast
5 6 (0.51%) Wireshark
6 4 (0.34%) IGMP
6 4 (0.34%) IPv6
6 4 (0.34%) OSPF
6 4 (0.34%) RIP
6 4 (0.34%) SNMP
6 4 (0.34%) VPN
6 4 (0.34%) VRRP
6 4 (0.34%) Wi-Fi
7 3 (0.26%) Internet
7 3 (0.26%) LTE
Database & Business Intelligence
1 50 (4.26%) Data Warehouse
2 49 (4.17%) Power BI
3 26 (2.21%) Tableau
4 14 (1.19%) Relational Database
5 12 (1.02%) Big Data
6 10 (0.85%) SQL Server
7 8 (0.68%) Data Mining
7 8 (0.68%) Elasticsearch
8 7 (0.60%) Power Query
9 6 (0.51%) Data Hub
10 3 (0.26%) BusinessObjects Business Intelligence
10 3 (0.26%) Data Mart
10 3 (0.26%) SQL Server Integration Services
11 2 (0.17%) Amazon Redshift
11 2 (0.17%) Data Lake
11 2 (0.17%) KNIME
11 2 (0.17%) MongoDB
11 2 (0.17%) MySQL
11 2 (0.17%) PostgreSQL
11 2 (0.17%) SQL Server Reporting Services
Development Applications
1 81 (6.90%) JIRA
2 19 (1.62%) Git
3 12 (1.02%) Selenium
4 11 (0.94%) Bitbucket
5 10 (0.85%) Jenkins
6 8 (0.68%) Cucumber
7 7 (0.60%) SonarQube
8 6 (0.51%) git-flow
9 5 (0.43%) CA Release Automation
9 5 (0.43%) IBM UrbanCode
9 5 (0.43%) Mocha
9 5 (0.43%) Subversion
9 5 (0.43%) Team Foundation Server
9 5 (0.43%) Zephyr
10 3 (0.26%) Postman
10 3 (0.26%) Visual Studio
11 2 (0.17%) Ant
11 2 (0.17%) CircleCI
11 2 (0.17%) Code Climate
11 2 (0.17%) Cypress.io
General
1 262 (22.32%) Finance
2 252 (21.47%) Social Skills
3 179 (15.25%) Marketing
4 125 (10.65%) Analytical Skills
5 67 (5.71%) Manufacturing
6 52 (4.43%) Public Sector
7 49 (4.17%) Retail
8 46 (3.92%) Presentation Skills
9 29 (2.47%) Inclusion and Diversity
10 27 (2.30%) Banking
11 21 (1.79%) Organisational Skills
12 16 (1.36%) Automotive
13 14 (1.19%) Telecoms
14 12 (1.02%) Financial Institution
14 12 (1.02%) Influencing Skills
15 10 (0.85%) Documentation Skills
15 10 (0.85%) Electronics
15 10 (0.85%) Law
16 9 (0.77%) Legal
17 8 (0.68%) Billing
Job Titles
1 206 (17.55%) Development Manager
2 203 (17.29%) Business Manager
3 202 (17.21%) Business Development Manager
4 196 (16.70%) Senior
5 191 (16.27%) Analyst
6 137 (11.67%) Project Manager
7 117 (9.97%) Senior Manager
8 114 (9.71%) Developer
9 112 (9.54%) Architect
10 109 (9.28%) Senior Project Manager
11 82 (6.98%) Lead
12 81 (6.90%) Salesforce Developer
13 73 (6.22%) Consultant
14 64 (5.45%) Salesforce Architect
15 60 (5.11%) Salesforce Analyst
16 56 (4.77%) Business Analyst
17 54 (4.60%) Solutions Architect
18 42 (3.58%) Salesforce Consultant
19 38 (3.24%) Administrator
20 35 (2.98%) Senior Developer
Libraries, Frameworks & Software Standards
1 69 (5.88%) Lightning Web Components
2 60 (5.11%) .NET
3 53 (4.51%) Web Services
4 45 (3.83%) REST
5 39 (3.32%) HTML
6 37 (3.15%) CSS
7 36 (3.07%) Visualforce
8 34 (2.90%) React
9 27 (2.30%) React Native
10 24 (2.04%) XML
11 22 (1.87%) AngularJS
12 21 (1.79%) Middleware
13 20 (1.70%) SOAP
14 16 (1.36%) .NET Core
15 13 (1.11%) ASP.NET
15 13 (1.11%) Classic ASP
16 7 (0.60%) Kafka
17 6 (0.51%) JSON
18 5 (0.43%) Vue
19 4 (0.34%) .NET Framework
Miscellaneous
1 133 (11.33%) Management Information System
2 110 (9.37%) Virtual Team
3 57 (4.86%) Enterprise Software
4 36 (3.07%) Product Ownership
5 32 (2.73%) Onboarding
6 23 (1.96%) Self-Motivation
7 20 (1.70%) Cloud Native
8 13 (1.11%) Graphic Design
8 13 (1.11%) Video Conferencing
9 12 (1.02%) Social Media
10 11 (0.94%) FMCG
11 10 (0.85%) Low-Code
12 8 (0.68%) 3D Graphics
12 8 (0.68%) Data Structures
12 8 (0.68%) Life Science
12 8 (0.68%) Photography
13 7 (0.60%) Blog
13 7 (0.60%) Equities
13 7 (0.60%) Greenfield Project
14 5 (0.43%) Handset
Operating Systems
1 20 (1.70%) Windows
2 13 (1.11%) Windows 10
3 12 (1.02%) Apple iOS
4 4 (0.34%) Linux
5 1 (0.085%) Android
5 1 (0.085%) Mac OS
5 1 (0.085%) Unix
5 1 (0.085%) Windows 7
5 1 (0.085%) Windows Server
5 1 (0.085%) Windows Server 2012
5 1 (0.085%) Windows Server 2016
Processes & Methodologies
1 300 (25.55%) CRM
2 272 (23.17%) Agile
3 215 (18.31%) Customer Experience
4 214 (18.23%) Business Development
5 200 (17.04%) Migration
6 198 (16.87%) ERP
7 197 (16.78%) Project Management
8 194 (16.52%) Client Onboarding
9 187 (15.93%) Project Delivery
10 169 (14.40%) Scrum
11 151 (12.86%) SDLC
12 145 (12.35%) Computer Science
13 123 (10.48%) PRINCE2
14 115 (9.80%) Stakeholder Management
15 111 (9.45%) Roadmaps
16 110 (9.37%) Problem-Solving
17 87 (7.41%) Analytics
18 77 (6.56%) Business Analysis
18 77 (6.56%) Decision-Making
19 76 (6.47%) Mentoring
Programming Languages
1 68 (5.79%) SQL
2 64 (5.45%) JavaScript
3 61 (5.20%) Apex Code
4 42 (3.58%) Java
5 36 (3.07%) C#
6 23 (1.96%) TypeScript
7 15 (1.28%) Python
8 14 (1.19%) SOQL
9 4 (0.34%) ABAP
9 4 (0.34%) PowerShell
9 4 (0.34%) SOSL
9 4 (0.34%) T-SQL
10 3 (0.26%) Kotlin
10 3 (0.26%) Perl
10 3 (0.26%) Shell Script
10 3 (0.26%) VB.NET
11 2 (0.17%) PHP
11 2 (0.17%) sed
12 1 (0.085%) MATLAB
12 1 (0.085%) PL/SQL
Qualifications
1 219 (18.65%) Degree
2 133 (11.33%) Computer Science Degree
3 24 (2.04%) Security Cleared
4 19 (1.62%) SC Cleared
5 11 (0.94%) Master's Degree
6 8 (0.68%) TOGAF Certification
7 6 (0.51%) BPSS Clearance
7 6 (0.51%) CCIE
7 6 (0.51%) CCNP
7 6 (0.51%) Cisco Certification
7 6 (0.51%) CWAP
7 6 (0.51%) CWNA
7 6 (0.51%) ITIL Certification
8 5 (0.43%) PMI Certification
8 5 (0.43%) PMP
9 4 (0.34%) MCT
10 3 (0.26%) ISTQB
11 2 (0.17%) Azure Certification
11 2 (0.17%) ISEB
11 2 (0.17%) ITIL Foundation Certificate
Quality Assurance & Compliance
1 30 (2.56%) Data Quality
1 30 (2.56%) NIST
2 21 (1.79%) QA
3 11 (0.94%) SLA
4 10 (0.85%) PMO
5 8 (0.68%) MiFID
6 5 (0.43%) GDPR
7 4 (0.34%) ISO 22301
8 3 (0.26%) ISO/IEC 27001
9 2 (0.17%) Accessibility
9 2 (0.17%) COBIT
10 1 (0.085%) PCI DSS
System Software
1 19 (1.62%) Active Directory
2 2 (0.17%) Docker
3 1 (0.085%) Virtual Desktop
3 1 (0.085%) Virtual Machines
3 1 (0.085%) VMware ESXi
3 1 (0.085%) vSphere
Systems Management
1 5 (0.43%) Autotask
1 5 (0.43%) Kibana
1 5 (0.43%) Nagios
1 5 (0.43%) Prometheus
1 5 (0.43%) Puppet
1 5 (0.43%) Terraform
2 3 (0.26%) Single Sign-On
2 3 (0.26%) WSUS
3 2 (0.17%) Kubernetes
4 1 (0.085%) Ansible
4 1 (0.085%) HP Fortify
4 1 (0.085%) logstash
4 1 (0.085%) Systems Management Server (SMS)
Vendors
1 139 (11.84%) Microsoft
2 108 (9.20%) NEC
3 90 (7.67%) SAP
4 84 (7.16%) Google
5 70 (5.96%) HubSpot
6 53 (4.51%) Oracle
7 52 (4.43%) MuleSoft
8 43 (3.66%) Pardot
9 36 (3.07%) Salesforce Marketing Cloud
10 33 (2.81%) Sage
11 32 (2.73%) Atlassian
12 27 (2.30%) Adobe
13 22 (1.87%) IBM
14 19 (1.62%) Hotjar
15 17 (1.45%) ServiceNow
16 16 (1.36%) Informatica
17 13 (1.11%) Talend
18 12 (1.02%) Civica
18 12 (1.02%) Northgate
19 7 (0.60%) SnapLogic