Transact-SQL
UK
The table below provides summary statistics and salary benchmarking for jobs requiring T-SQL skills. It covers permanent job vacancies from the 6 months leading up to 22 February 2026, with comparisons to the same periods in the previous two years.
| 6 months to 22 Feb 2026 |
Same period 2025 | Same period 2024 | |
|---|---|---|---|
| Rank | 426 | 317 | 213 |
| Rank change year-on-year | -109 | -104 | +52 |
| Permanent jobs citing T-SQL | 256 | 446 | 1,109 |
| As % of all permanent jobs in the UK | 0.37% | 0.92% | 1.47% |
| As % of the Programming Languages category | 2.00% | 2.67% | 3.97% |
| Number of salaries quoted | 171 | 263 | 968 |
| 10th Percentile | £28,000 | £41,250 | £39,750 |
| 25th Percentile | £37,500 | £43,750 | £46,250 |
| Median annual salary (50th Percentile) | £48,500 | £55,000 | £55,000 |
| Median % change year-on-year | -11.82% | - | -0.36% |
| 75th Percentile | £63,750 | £65,625 | £65,000 |
| 90th Percentile | £83,500 | £82,500 | £77,875 |
| UK excluding London median annual salary | £42,500 | £47,500 | £52,500 |
| % change year-on-year | -10.53% | -9.52% | +5.00% |
All Programming Languages
UK
T-SQL falls under the Programming Languages category. For comparison with the information above, the following table provides summary statistics for all permanent job vacancies requiring coding skills.
| Permanent vacancies with a requirement for coding skills | 12,770 | 16,673 | 27,931 |
| As % of all permanent jobs advertised in the UK | 18.52% | 34.43% | 37.04% |
| Number of salaries quoted | 9,107 | 10,127 | 22,904 |
| 10th Percentile | £33,750 | £38,500 | £36,250 |
| 25th Percentile | £46,250 | £48,750 | £45,000 |
| Median annual salary (50th Percentile) | £62,500 | £65,000 | £60,000 |
| Median % change year-on-year | -3.85% | +8.33% | -7.69% |
| 75th Percentile | £82,500 | £85,336 | £80,000 |
| 90th Percentile | £100,000 | £110,000 | £100,000 |
| UK excluding London median annual salary | £55,000 | £57,500 | £55,000 |
| % change year-on-year | -4.35% | +4.55% | - |
T-SQL
Job Vacancy Trend
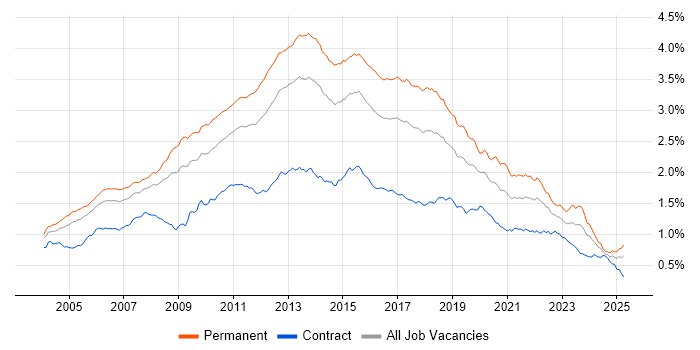
Historical trend showing the proportion of permanent IT job postings citing T-SQL relative to all permanent IT jobs advertised.

T-SQL
Salary Trend
Salary distribution trend for jobs in the UK citing T-SQL.

T-SQL
Salary Histogram
Salary distribution for jobs citing T-SQL over the 6 months to 22 February 2026.
T-SQL
Top 17 Job Locations
The table below looks at the demand and provides a guide to the median salaries quoted in IT jobs citing T-SQL within the UK over the 6 months to 22 February 2026. The 'Rank Change' column provides an indication of the change in demand within each location based on the same 6 month period last year.
| Location | Rank Change on Same Period Last Year |
Matching Permanent IT Job Ads |
Median Salary Past 6 Months |
Median Salary % Change on Same Period Last Year |
Live Jobs |
|---|---|---|---|---|---|
| England | -122 | 203 | £48,500 | -11.82% | 102 |
| UK excluding London | -45 | 197 | £42,500 | -10.53% | 101 |
| Work from Home | -39 | 139 | £42,500 | -22.73% | 43 |
| London | -70 | 57 | £72,500 | +16.00% | 13 |
| Midlands | -10 | 46 | £48,500 | +4.86% | 18 |
| Scotland | +32 | 45 | £37,500 | -18.48% | |
| South East | -23 | 40 | £40,000 | -21.18% | 44 |
| North of England | -20 | 37 | £47,500 | -5.00% | 24 |
| West Midlands | +14 | 29 | £42,500 | -22.73% | 11 |
| Yorkshire | -22 | 25 | £25,000 | -47.92% | 3 |
| South West | -21 | 18 | £42,500 | +2.41% | 9 |
| East Midlands | -32 | 17 | £50,000 | +11.11% | 7 |
| North West | -13 | 9 | £57,500 | +9.52% | 20 |
| East of England | -28 | 5 | £42,175 | -11.21% | 6 |
| Northern Ireland | - | 5 | £50,000 | - | 1 |
| North East | -12 | 3 | £51,000 | -32.00% | 2 |
| Channel Islands | - | 1 | £90,000 | - |
T-SQL
Co-Occurring Skills & Capabilities by Category
The following tables expand on the one above by listing co-occurrences grouped by category. They cover the same employment type, locality and period, with up to 20 co-occurrences shown in each category:
|
|
||||||||||||||||||||||||||||||||||||||||||||||||||||||||||||||||||||||||||||||||||||||||||||||||||||||||||||||||||||||||||||||
|
|
||||||||||||||||||||||||||||||||||||||||||||||||||||||||||||||||||||||||||||||||||||||||||||||||||||||||||||||||||||||||||||||
|
|
||||||||||||||||||||||||||||||||||||||||||||||||||||||||||||||||||||||||||||||||||||||||||||||||||||||||||||||||||||||||||||||
|
|
||||||||||||||||||||||||||||||||||||||||||||||||||||||||||||||||||||||||||||||||||||||||||||||||||||||||||||||||||||||||||||||
|
|
||||||||||||||||||||||||||||||||||||||||||||||||||||||||||||||||||||||||||||||||||||||||||||||||||||||||||||||||||||||||||||||
|
|
||||||||||||||||||||||||||||||||||||||||||||||||||||||||||||||||||||||||||||||||||||||||||||||||||||||||||||||||||||||||||||||
|
|
||||||||||||||||||||||||||||||||||||||||||||||||||||||||||||||||||||||||||||||||||||||||||||||||||||||||||||||||||||||||||||||
|
|
||||||||||||||||||||||||||||||||||||||||||||||||||||||||||||||||||||||||||||||||||||||||||||||||||||||||||||||||||||||||||||||
|
|
||||||||||||||||||||||||||||||||||||||||||||||||||||||||||||||||||||||||||||||||||||||||||||||||||||||||||||||||||||||||||||||
|
|||||||||||||||||||||||||||||||||||||||||||||||||||||||||||||||||||||||||||||||||||||||||||||||||||||||||||||||||||||||||||||||
