Cloud Native
UK

The table below looks at the prevalence of the term Cloud Native in permanent job vacancies. Included is a benchmarking guide to the salaries offered in vacancies that have cited Cloud Native over the 6 months to 10 December 2023 with a comparison to the same period over the previous 2 years.

6 months to
10 Dec 2023
Same period 2022 Same period 2021
Rank 216 181 216
Rank change year-on-year -35 +35 +68
Permanent jobs citing Cloud Native 863 2,636 2,165
As % of all permanent jobs advertised in the UK 1.65% 2.16% 1.70%
As % of the Miscellaneous category 4.48% 5.02% 3.89%
Number of salaries quoted 482 1,149 1,178
10th Percentile £55,166 £56,219 £52,500
25th Percentile £67,500 £65,000 £62,500
Median annual salary (50th Percentile) £80,000 £85,000 £82,250
Median % change year-on-year -5.88% +3.34% +17.50%
75th Percentile £102,500 £105,000 £100,000
90th Percentile £120,000 £121,500 £112,500
UK excluding London median annual salary £75,000 £70,000 £67,500
% change year-on-year +7.14% +3.70% +3.85%

All Generic Skills
UK

Cloud Native is in the General and Transferable Skills category. The following table is for comparison with the above and provides summary statistics for all permanent job vacancies with a requirement for generic IT skills.

Permanent vacancies with a requirement for generic IT skills 19,243 52,473 55,657
As % of all permanent jobs advertised in the UK 36.81% 42.93% 43.80%
Number of salaries quoted 14,017 29,568 33,811
10th Percentile £32,756 £34,996 £33,750
25th Percentile £45,000 £46,250 £45,000
Median annual salary (50th Percentile) £62,500 £64,750 £60,000
Median % change year-on-year -3.47% +7.92% -
75th Percentile £83,750 £85,000 £82,500
90th Percentile £107,500 £105,000 £100,000
UK excluding London median annual salary £55,000 £55,000 £50,000
% change year-on-year - +10.00% -

Cloud Native
Job Vacancy Trend

Job postings citing Cloud Native as a proportion of all IT jobs advertised.
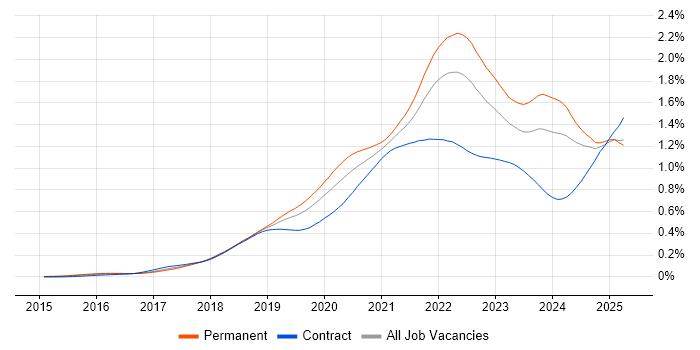
Job vacancy trend for Cloud Native in the UK

Cloud Native
Salary Trend

3-month moving average salary quoted in jobs citing Cloud Native.

Salary trend for Cloud Native in the UK

Cloud Native
Salary Histogram

Salary distribution for jobs citing Cloud Native over the 6 months to 10 December 2023.

Salary histogram for Cloud Native in the UK

Cloud Native
Top 17 Job Locations

The table below looks at the demand and provides a guide to the median salaries quoted in IT jobs citing Cloud Native within the UK over the 6 months to 10 December 2023. The 'Rank Change' column provides an indication of the change in demand within each location based on the same 6 month period last year.

Location Rank Change
on Same Period
Last Year
Matching
Permanent
IT Job Ads
Median Salary
Past 6 Months
Median Salary
% Change
on Same Period
Last Year
Live
Jobs
England -50 654 £82,500 -2.94% 246
UK excluding London +74 517 £75,000 +7.14% 128
Work from Home +4 411 £80,000 -5.88% 151
London -98 287 £90,000 - 145
Scotland +68 141 £73,122 +21.87% 10
North of England +73 140 £72,788 +3.98% 37
South West +58 102 £80,000 - 16
Yorkshire +78 77 £72,788 -11.77% 11
North West +43 60 £78,750 +21.15% 25
South East +56 58 £75,000 +7.14% 37
Midlands +69 27 £55,000 -14.73% 18
East of England +93 21 £125,000 +75.44% 6
Northern Ireland +7 16 £70,000 -5.41% 5
West Midlands +84 15 £64,500 +3.20% 11
East Midlands +37 12 £50,000 -20.95% 6
Wales +21 12 £62,989 -22.48% 1
North East +39 3 £65,000 -16.13% 1

Cloud Native
Co-occurring Skills and Capabilities by Category

The follow tables expand on the table above by listing co-occurrences grouped by category. The same employment type, locality and period is covered with up to 20 co-occurrences shown in each of the following categories:

Application Platforms
1 63 (7.30%) Confluence
2 42 (4.87%) Apache Spark
3 23 (2.67%) Apache
4 10 (1.16%) Apache Airflow
4 10 (1.16%) SharePoint
5 8 (0.93%) CMS
6 4 (0.46%) nginx
7 3 (0.35%) Anypoint
7 3 (0.35%) BizTalk Server
8 2 (0.23%) Ethereum
8 2 (0.23%) IIS
9 1 (0.12%) Hyperledger
9 1 (0.12%) JBoss
9 1 (0.12%) OpenStack
9 1 (0.12%) Red Hat Fuse
Applications
1 4 (0.46%) Trello
2 1 (0.12%) MS Visio
Business Applications
1 10 (1.16%) Dynamics CRM
2 2 (0.23%) Distributed Ledger
3 1 (0.12%) Adobe Campaign
3 1 (0.12%) Dynamics GP
3 1 (0.12%) Dynamics NAV
3 1 (0.12%) Epicor Tropos
3 1 (0.12%) Magento
3 1 (0.12%) Quorum
3 1 (0.12%) R3 Corda
3 1 (0.12%) Shopify
Cloud Services
1 477 (55.27%) AWS
2 434 (50.29%) Azure
3 212 (24.57%) GCP
4 106 (12.28%) Serverless
5 89 (10.31%) SaaS
6 86 (9.97%) PaaS
7 83 (9.62%) IaaS
8 57 (6.60%) AWS CloudFormation
9 54 (6.26%) AWS Lambda
9 54 (6.26%) Azure DevOps
10 30 (3.48%) GitHub
11 29 (3.36%) Cloud Computing
12 25 (2.90%) Azure Cosmos DB
13 24 (2.78%) Amazon CloudWatch
14 20 (2.32%) Amazon ECS
14 20 (2.32%) OpenShift
14 20 (2.32%) Power Platform
15 19 (2.20%) Azure Monitor
16 18 (2.09%) Pulumi
17 16 (1.85%) Azure Service Bus
Communications & Networking
1 54 (6.26%) TCP/IP
2 46 (5.33%) Firewall
3 39 (4.52%) DNS
4 30 (3.48%) HTTP
5 29 (3.36%) DHCP
6 28 (3.24%) F5 BIG-IP GTM
6 28 (3.24%) F5 BIG-IP LTM
7 14 (1.62%) VPN
8 7 (0.81%) Network Security
9 6 (0.70%) DSL
10 5 (0.58%) AMQP
11 4 (0.46%) RFID
11 4 (0.46%) VLAN
11 4 (0.46%) WAN
12 3 (0.35%) Internet
12 3 (0.35%) LAN
12 3 (0.35%) Wi-Fi
13 2 (0.23%) BGP
14 1 (0.12%) FTP
14 1 (0.12%) Wireless
Database & Business Intelligence
1 130 (15.06%) Data Warehouse
2 108 (12.51%) NoSQL
3 65 (7.53%) Data Lake
4 55 (6.37%) MongoDB
5 51 (5.91%) Elasticsearch
6 47 (5.45%) Big Data
7 46 (5.33%) Hadoop
8 39 (4.52%) SQL Server
9 32 (3.71%) PostgreSQL
9 32 (3.71%) Redis
10 30 (3.48%) DynamoDB
11 29 (3.36%) Metadata
12 22 (2.55%) BigQuery
13 19 (2.20%) Azure SQL Database
13 19 (2.20%) Relational Database
14 14 (1.62%) Power BI
15 10 (1.16%) Amazon Redshift
16 8 (0.93%) Flink
16 8 (0.93%) MySQL
17 7 (0.81%) RDBMS
Development Applications
1 74 (8.57%) JIRA
2 67 (7.76%) Jenkins
3 33 (3.82%) Git
4 28 (3.24%) Sonatype Nexus
5 22 (2.55%) GitLab
6 21 (2.43%) Spinnaker
7 15 (1.74%) Artifactory
8 10 (1.16%) JUnit
8 10 (1.16%) Maven
9 9 (1.04%) Jasmine
9 9 (1.04%) SonarQube
10 7 (0.81%) Cucumber
10 7 (0.81%) Karma Test Runner
10 7 (0.81%) Visual Studio Code
11 5 (0.58%) Cypress.io
12 4 (0.46%) Bitbucket
12 4 (0.46%) Gradle
12 4 (0.46%) Moq
12 4 (0.46%) NUnit
12 4 (0.46%) TeamCity
General
1 392 (45.42%) Finance
2 181 (20.97%) Inclusion and Diversity
3 172 (19.93%) Banking
4 157 (18.19%) Social Skills
5 108 (12.51%) Retail
6 95 (11.01%) Law
7 94 (10.89%) Marketing
8 76 (8.81%) Analytical Skills
9 34 (3.94%) Financial Institution
10 29 (3.36%) Legal
11 23 (2.67%) Private Banking
12 21 (2.43%) Influencing Skills
13 17 (1.97%) Presentation Skills
14 12 (1.39%) Investment Banking
15 10 (1.16%) Back Office
15 10 (1.16%) Public Sector
16 8 (0.93%) Billing
17 7 (0.81%) Tech for Good
18 5 (0.58%) Games
19 4 (0.46%) Manufacturing
Job Titles
1 264 (30.59%) Senior
2 262 (30.36%) Architect
3 147 (17.03%) Solutions Architect
4 143 (16.57%) Developer
5 109 (12.63%) Software Engineer
6 101 (11.70%) Lead
7 82 (9.50%) Senior Architect
8 81 (9.39%) DevOps Engineer
9 75 (8.69%) Senior Solutions Architect
10 73 (8.46%) Cloud Engineer
11 54 (6.26%) Senior Developer
12 51 (5.91%) Data Engineer
13 47 (5.45%) Enterprise Architect
14 42 (4.87%) AWS Engineer
14 42 (4.87%) Senior DevOps
14 42 (4.87%) Senior DevOps Engineer
14 42 (4.87%) Senior Software Engineer
15 38 (4.40%) Cloud Architect
16 35 (4.06%) Python Engineer
17 31 (3.59%) Cloud Software Engineer
Libraries, Frameworks & Software Standards
1 151 (17.50%) .NET
2 115 (13.33%) React
3 81 (9.39%) AngularJS
4 74 (8.57%) OpenID
5 70 (8.11%) HTML
6 56 (6.49%) Spring Boot
7 54 (6.26%) .NET Core
8 53 (6.14%) REST
9 52 (6.03%) Spring
10 50 (5.79%) RESTful
11 49 (5.68%) Kafka
12 48 (5.56%) Node.js
13 29 (3.36%) SAML
14 28 (3.24%) Spine.js
15 26 (3.01%) ASP.NET
16 23 (2.67%) Swagger
17 21 (2.43%) Vue
18 20 (2.32%) AWS CDK
18 20 (2.32%) Django
19 19 (2.20%) Web Services
Miscellaneous
1 117 (13.56%) Public Cloud
2 77 (8.92%) Data Structures
3 66 (7.65%) Product Ownership
4 58 (6.72%) Blockchain
5 57 (6.60%) Distributed Systems
6 54 (6.26%) Data Centre
7 53 (6.14%) Cyberattack
8 43 (4.98%) Mainframe
9 32 (3.71%) Legacy Code
10 31 (3.59%) Greenfield Project
11 30 (3.48%) Virtual Team
12 26 (3.01%) Legacy Systems
12 26 (3.01%) Private Cloud
13 23 (2.67%) Mobile App
14 19 (2.20%) Algorithms
15 16 (1.85%) Distributed Applications
16 14 (1.62%) Self-Motivation
17 12 (1.39%) Hybrid Cloud
18 11 (1.27%) Hedge funds
18 11 (1.27%) Management Information System
Operating Systems
1 126 (14.60%) Linux
2 66 (7.65%) Unix
3 28 (3.24%) Windows
4 22 (2.55%) Android
5 16 (1.85%) Apple iOS
6 15 (1.74%) Mac OS
7 6 (0.70%) CentOS
8 5 (0.58%) Debian
8 5 (0.58%) Red Hat Enterprise Linux
8 5 (0.58%) Ubuntu
9 4 (0.46%) Mac OS X
10 3 (0.35%) VMS
10 3 (0.35%) Windows Server
Processes & Methodologies
1 566 (65.59%) Agile
2 342 (39.63%) CI/CD
3 328 (38.01%) DevOps
4 230 (26.65%) Software Engineering
5 219 (25.38%) Microservices
6 206 (23.87%) Infrastructure as Code
7 173 (20.05%) Scrum
8 152 (17.61%) Design Patterns
9 150 (17.38%) Roadmaps
10 129 (14.95%) Analytics
11 126 (14.60%) Enterprise Architecture
12 123 (14.25%) Machine Learning
12 123 (14.25%) SDLC
13 114 (13.21%) DevSecOps
14 105 (12.17%) Cloud Security
14 105 (12.17%) Containerisation
15 103 (11.94%) TOGAF
16 100 (11.59%) Artificial Intelligence
17 98 (11.36%) Mentoring
18 94 (10.89%) Scaled Agile Framework
Programming Languages
1 235 (27.23%) Python
2 150 (17.38%) Java
3 139 (16.11%) SQL
4 119 (13.79%) C#
5 112 (12.98%) JavaScript
6 79 (9.15%) TypeScript
7 54 (6.26%) Go
8 39 (4.52%) PowerShell
9 35 (4.06%) Bash
10 33 (3.82%) Rust
11 32 (3.71%) Scala
12 22 (2.55%) C++
12 22 (2.55%) Groovy
13 19 (2.20%) Bicep
14 15 (1.74%) C
15 12 (1.39%) T-SQL
16 10 (1.16%) Ruby
17 8 (0.93%) PL/SQL
18 7 (0.81%) Kotlin
18 7 (0.81%) Shell Script
Qualifications
1 131 (15.18%) Security Cleared
2 73 (8.46%) TOGAF Certification
3 69 (8.00%) DV Cleared
4 60 (6.95%) AWS Certification
5 49 (5.68%) SC Cleared
6 41 (4.75%) Degree
7 32 (3.71%) AWS Certified Solutions Architect
8 15 (1.74%) Azure Certification
8 15 (1.74%) Computer Science Degree
8 15 (1.74%) Master's Degree
9 14 (1.62%) Microsoft Certification
10 8 (0.93%) AWS Certified DevOps Engineer
10 8 (0.93%) AWS Certified SysOps Administrator
11 4 (0.46%) BPSS Clearance
11 4 (0.46%) Cisco Certification
12 3 (0.35%) (ISC)2 CCSP
12 3 (0.35%) CCSP
12 3 (0.35%) CISSP
13 2 (0.23%) CCSK
13 2 (0.23%) PMI Certification
Quality Assurance & Compliance
1 24 (2.78%) QA
2 16 (1.85%) SLA
3 15 (1.74%) Accessibility
4 14 (1.62%) Data Quality
5 13 (1.51%) ISO/IEC 27001
6 7 (0.81%) NIST
6 7 (0.81%) WAI
7 6 (0.70%) Cyber Essentials
7 6 (0.70%) ISO 9000
7 6 (0.70%) PCI DSS
8 3 (0.35%) SOC 2
9 2 (0.23%) GDPR
9 2 (0.23%) ISO/IEC 27002 (supersedes ISO/IEC 17799)
9 2 (0.23%) NCSC
10 1 (0.12%) COBIT
10 1 (0.12%) ISO 9001
10 1 (0.12%) ISO/IEC 20000
System Software
1 79 (9.15%) Docker
2 10 (1.16%) Active Directory
3 6 (0.70%) Virtual Machines
3 6 (0.70%) VMware Infrastructure
4 5 (0.58%) VMware ESXi
5 3 (0.35%) Hyper-V
6 1 (0.12%) Ceph
6 1 (0.12%) Citrix Hypervisor
6 1 (0.12%) Gluster
6 1 (0.12%) Slurm Workload Manager
6 1 (0.12%) Virtual Desktop
Systems Management
1 228 (26.42%) Kubernetes
2 186 (21.55%) Terraform
3 76 (8.81%) Ansible
4 23 (2.67%) Puppet
5 18 (2.09%) Istio
6 16 (1.85%) Grafana
7 12 (1.39%) Argo
7 12 (1.39%) Progress Chef
8 8 (0.93%) Packer
8 8 (0.93%) Prometheus
9 7 (0.81%) Single Sign-On
10 4 (0.46%) Jamf Pro
10 4 (0.46%) vRealize
10 4 (0.46%) vRealize Orchestrator
11 3 (0.35%) Kibana
11 3 (0.35%) Nagios
11 3 (0.35%) vCenter Server
12 2 (0.23%) Fluentd
12 2 (0.23%) Norton AntiVirus
13 1 (0.12%) Rancher
Vendors
1 100 (11.59%) Microsoft
2 75 (8.69%) Google
3 36 (4.17%) Oracle
4 31 (3.59%) ServiceNow
5 30 (3.48%) Cisco
6 29 (3.36%) Databricks
6 29 (3.36%) Fortinet
7 28 (3.24%) CheckPoint
7 28 (3.24%) F5
8 20 (2.32%) Salesforce
9 19 (2.20%) Splunk
10 17 (1.97%) Dell
11 10 (1.16%) VMware
12 9 (1.04%) Dynatrace
13 7 (0.81%) Atlassian
13 7 (0.81%) Red Hat
14 6 (0.70%) Alteryx
14 6 (0.70%) Cognos
14 6 (0.70%) MuleSoft
14 6 (0.70%) Sybase