Stakeholder Management Jobs

Stakeholder Management
UK

The table below provides summary statistics for permanent job vacancies requiring Stakeholder Management skills. It includes a benchmarking guide to the annual salaries offered in vacancies that cited Stakeholder Management over the 6 months leading up to 30 April 2025, comparing them to the same period in the previous two years.

6 months to
30 Apr 2025
Same period 2024 Same period 2023
Rank 33 56 47
Rank change year-on-year +23 -9 +6
Permanent jobs citing Stakeholder Management 3,212 4,173 6,315
As % of all permanent jobs advertised in the UK 6.16% 4.24% 6.07%
As % of the Processes & Methodologies category 6.60% 4.93% 6.35%
Number of salaries quoted 1,703 2,943 3,901
10th Percentile £43,750 £38,250 £42,500
25th Percentile £52,500 £46,250 £52,000
Median annual salary (50th Percentile) £63,500 £62,500 £65,000
Median % change year-on-year +1.60% -3.85% +4.00%
75th Percentile £83,750 £80,000 £85,000
90th Percentile £102,500 £97,500 £102,500
UK excluding London median annual salary £58,500 £55,000 £55,000
% change year-on-year +6.36% - -

All Process and Methodology Skills
UK

Stakeholder Management falls under the Processes and Methodologies category. For comparison with the information above, the following table provides summary statistics for all permanent job vacancies requiring process or methodology skills.

Permanent vacancies with a requirement for process or methodology skills 48,641 84,574 99,457
As % of all permanent jobs advertised in the UK 93.26% 86.00% 95.63%
Number of salaries quoted 26,531 59,798 58,397
10th Percentile £30,580 £29,000 £34,000
25th Percentile £42,500 £40,000 £45,000
Median annual salary (50th Percentile) £57,500 £55,000 £61,500
Median % change year-on-year +4.55% -10.57% +2.50%
75th Percentile £76,250 £72,500 £82,500
90th Percentile £98,750 £92,500 £100,000
UK excluding London median annual salary £52,500 £50,000 £55,000
% change year-on-year +5.00% -9.09% +4.76%

Stakeholder Management
Job Vacancy Trend

Job postings citing Stakeholder Management as a proportion of all IT jobs advertised.
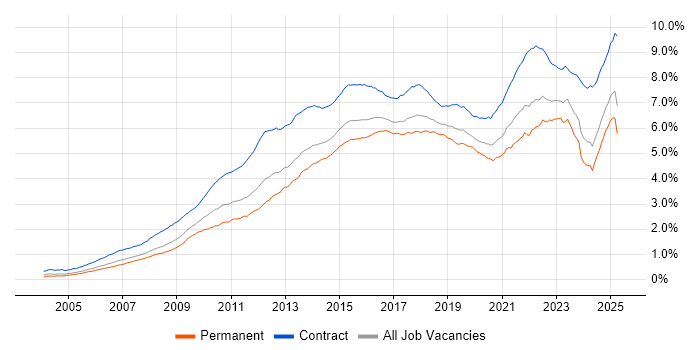
Job vacancy trend for Stakeholder Management in the UK

Stakeholder Management
Salary Trend

3-month moving average salary quoted in jobs citing Stakeholder Management.

Salary trend for Stakeholder Management in the UK

Stakeholder Management
Salary Histogram

Salary distribution for jobs citing Stakeholder Management over the 6 months to 30 April 2025.

Salary histogram for Stakeholder Management in the UK

Stakeholder Management
Top 19 Job Locations

The table below looks at the demand and provides a guide to the median salaries quoted in IT jobs citing Stakeholder Management within the UK over the 6 months to 30 April 2025. The 'Rank Change' column provides an indication of the change in demand within each location based on the same 6 month period last year.

Location Rank Change
on Same Period
Last Year
Matching
Permanent
IT Job Ads
Median Salary
Past 6 Months
Median Salary
% Change
on Same Period
Last Year
Live
Jobs
England +17 2,754 £62,500 -0.45% 2,109
UK excluding London +35 2,140 £58,500 +6.36% 1,060
London +5 883 £82,500 +10.00% 1,114
North of England +25 845 £56,000 -2.61% 314
Work from Home -7 712 £65,000 +2.54% 953
North West +28 665 £56,000 +3.70% 214
South East +49 422 £62,500 +8.70% 274
Midlands -5 323 £58,000 +6.42% 189
Scotland +66 274 £75,000 +46.96% 73
West Midlands +8 235 £55,000 - 123
South West +37 165 £57,500 - 124
Yorkshire +4 160 £60,000 - 84
East Midlands -13 88 £60,000 +11.11% 62
East of England -25 82 £64,325 +19.12% 83
North East +14 20 £47,500 -18.05% 18
Wales +12 19 £50,500 +7.45% 10
Northern Ireland +18 11 - - 12
Isle of Man +18 4 - - 3
Channel Islands - 3 £78,750 -

Stakeholder Management
Co-occurring Skills and Capabilities by Category

The follow tables expand on the table above by listing co-occurrences grouped by category. The same employment type, locality and period is covered with up to 20 co-occurrences shown in each of the following categories:

Application Platforms
1 83 (2.58%) Confluence
2 71 (2.21%) SharePoint
3 19 (0.59%) CMS
4 15 (0.47%) Apache Spark
5 14 (0.44%) SAS
6 9 (0.28%) WordPress
7 7 (0.22%) Microsoft Exchange
8 6 (0.19%) Apache Airflow
8 6 (0.19%) Drupal
9 3 (0.093%) Apache
9 3 (0.093%) Mendix
10 2 (0.062%) CICS
10 2 (0.062%) CoreMedia CMS
10 2 (0.062%) Jupyter
10 2 (0.062%) Moodle
10 2 (0.062%) nginx
10 2 (0.062%) ThingWorx
11 1 (0.031%) Appian
11 1 (0.031%) Headless CMS
11 1 (0.031%) NetWeaver
Applications
1 123 (3.83%) Microsoft Excel
2 102 (3.18%) Microsoft Office
3 66 (2.05%) Microsoft Project
4 56 (1.74%) Microsoft PowerPoint
5 17 (0.53%) MS Visio
6 10 (0.31%) Spreadsheet
6 10 (0.31%) Trello
7 3 (0.093%) Productboard
7 3 (0.093%) ProjectWise
7 3 (0.093%) SPSS
8 2 (0.062%) Adobe Captivate
9 1 (0.031%) Adobe Creative Suite
9 1 (0.031%) Adobe Illustrator
9 1 (0.031%) Adobe Premiere
9 1 (0.031%) Notion
9 1 (0.031%) Photoshop
Business Applications
1 34 (1.06%) NetSuite
2 33 (1.03%) SAP S/4HANA
3 25 (0.78%) Dynamics CRM
4 22 (0.68%) Shopify
5 21 (0.65%) SAP FI
6 16 (0.50%) OpenText VIM for SAP
7 13 (0.40%) Oracle Payroll
8 12 (0.37%) Salesforce CRM
9 10 (0.31%) Oracle ERP
10 8 (0.25%) SAP SD
10 8 (0.25%) Teamcenter
11 5 (0.16%) Elite 3E
11 5 (0.16%) SAP CO
11 5 (0.16%) SAP FI/CO
12 4 (0.12%) Dynamics AX
12 4 (0.12%) SAP PP
13 3 (0.093%) Distributed Ledger
13 3 (0.093%) Dynamics NAV
13 3 (0.093%) SAP ERP
13 3 (0.093%) SAP IBP
Cloud Services
1 401 (12.48%) Azure
2 223 (6.94%) AWS
3 181 (5.64%) Power Platform
4 126 (3.92%) GCP
5 105 (3.27%) SaaS
6 65 (2.02%) Dynamics 365
7 64 (1.99%) Microsoft 365
8 46 (1.43%) Azure DevOps
9 39 (1.21%) Snowflake
10 38 (1.18%) Power Automate
11 35 (1.09%) PowerApps
12 33 (1.03%) GitHub
13 27 (0.84%) Cloud Computing
14 26 (0.81%) Entra ID
14 26 (0.81%) PaaS
14 26 (0.81%) Salesforce Sales Cloud
15 24 (0.75%) Serverless
16 23 (0.72%) IaaS
17 20 (0.62%) Azure Data Factory
17 20 (0.62%) Google Analytics
Communications & Networking
1 48 (1.49%) Firewall
2 25 (0.78%) WAN
3 21 (0.65%) Network Security
4 20 (0.62%) VPN
5 15 (0.47%) LAN
6 13 (0.40%) SSL
7 11 (0.34%) BGP
7 11 (0.34%) DNS
7 11 (0.34%) Wireless
8 10 (0.31%) TCP/IP
9 9 (0.28%) Internet
9 9 (0.28%) SD-WAN
10 7 (0.22%) SMS
10 7 (0.22%) VLAN
11 5 (0.16%) DHCP
11 5 (0.16%) Intrusion Detection
11 5 (0.16%) MPLS
11 5 (0.16%) OSPF
11 5 (0.16%) Software-Defined Networking
11 5 (0.16%) Wi-Fi
Database & Business Intelligence
1 164 (5.11%) Power BI
2 90 (2.80%) Tableau
3 76 (2.37%) Data Lake
4 68 (2.12%) Data Warehouse
5 40 (1.25%) Metadata
6 34 (1.06%) Big Data
7 31 (0.97%) SQL Server
8 22 (0.68%) SQL Server Reporting Services
9 21 (0.65%) PostgreSQL
9 21 (0.65%) Relational Database
10 18 (0.56%) Azure SQL Database
11 17 (0.53%) NoSQL
12 15 (0.47%) BigQuery
12 15 (0.47%) MongoDB
12 15 (0.47%) MySQL
13 10 (0.31%) Data Vault
14 9 (0.28%) BusinessObjects
14 9 (0.28%) MS Access
14 9 (0.28%) SQL Server Integration Services
15 8 (0.25%) Amazon Redshift
Development Applications
1 190 (5.92%) Rational DOORS
2 149 (4.64%) JIRA
3 19 (0.59%) Git
4 16 (0.50%) GitLab
5 13 (0.40%) Jenkins
6 7 (0.22%) CircleCI
7 6 (0.19%) Grunt
7 6 (0.19%) Jasmine
7 6 (0.19%) Mocha
7 6 (0.19%) webpack
8 4 (0.12%) Postman
8 4 (0.12%) Selenium
9 3 (0.093%) Visual Studio
10 2 (0.062%) Appium
10 2 (0.062%) Axure RP
10 2 (0.062%) ERwin
10 2 (0.062%) SoapUI
10 2 (0.062%) Visual Studio Code
10 2 (0.062%) Visual Website Optimizer
11 1 (0.031%) Rational Rhapsody
General
1 1,175 (36.58%) Social Skills
2 1,000 (31.13%) Finance
3 564 (17.56%) Analytical Skills
4 237 (7.38%) Law
5 215 (6.69%) Banking
6 184 (5.73%) Manufacturing
7 180 (5.60%) Marketing
8 158 (4.92%) Influencing Skills
9 135 (4.20%) Public Sector
10 125 (3.89%) Presentation Skills
11 110 (3.42%) Inclusion and Diversity
12 109 (3.39%) Legal
13 108 (3.36%) Retail
14 101 (3.14%) Organisational Skills
15 81 (2.52%) Financial Institution
16 59 (1.84%) Electronics
17 43 (1.34%) Advertising
18 39 (1.21%) Documentation Skills
18 39 (1.21%) Telecoms
19 33 (1.03%) Local Government
Job Titles
1 448 (13.95%) Senior
2 390 (12.14%) Analyst
3 375 (11.67%) Lead
4 363 (11.30%) Project Manager
5 269 (8.37%) Engineering Manager
6 251 (7.81%) Architect
7 190 (5.92%) Requirements Manager
8 145 (4.51%) Business Analyst
9 127 (3.95%) IT Manager
10 126 (3.92%) Solutions Architect
11 123 (3.83%) Delivery Project Manager
12 114 (3.55%) Senior Manager
13 96 (2.99%) Consultant
14 83 (2.58%) Developer
14 83 (2.58%) Senior Analyst
15 80 (2.49%) Delivery Manager
16 72 (2.24%) Product Manager
16 72 (2.24%) Risk Manager
17 70 (2.18%) Principal Engineer
18 59 (1.84%) Programme Manager
Libraries, Frameworks & Software Standards
1 60 (1.87%) Middleware
2 51 (1.59%) REST
3 45 (1.40%) .NET
3 45 (1.40%) React
4 34 (1.06%) CSS
5 33 (1.03%) HTML
5 33 (1.03%) SOAP
6 27 (0.84%) AngularJS
6 27 (0.84%) Lightning Web Components
7 23 (0.72%) Node.js
8 22 (0.68%) .NET Core
9 17 (0.53%) EDI
10 15 (0.47%) ARM Templates
10 15 (0.47%) Oracle Fusion
11 14 (0.44%) Kafka
12 13 (0.40%) PySpark
13 12 (0.37%) JSON
13 12 (0.37%) OAuth
14 10 (0.31%) Next.js
14 10 (0.31%) OAuth2
Miscellaneous
1 160 (4.98%) Management Information System
2 158 (4.92%) Product Ownership
3 69 (2.15%) Onboarding
4 67 (2.09%) Self-Motivation
5 58 (1.81%) Credit Risk
6 55 (1.71%) Analytical Mindset
7 52 (1.62%) Enterprise Software
8 45 (1.40%) Legacy Systems
9 44 (1.37%) Cloud Native
10 36 (1.12%) PMI
11 33 (1.03%) Data Centre
12 30 (0.93%) Public Cloud
13 29 (0.90%) Data Protection Act
14 27 (0.84%) Virtual Team
15 23 (0.72%) Mobile App
16 20 (0.62%) Hybrid Cloud
17 19 (0.59%) Derivative
17 19 (0.59%) NHS
17 19 (0.59%) Operational Technology
17 19 (0.59%) Social Media
Operating Systems
1 60 (1.87%) Windows
2 35 (1.09%) Linux
3 17 (0.53%) Windows Server
4 14 (0.44%) Unix
4 14 (0.44%) zOS
5 11 (0.34%) Red Hat Enterprise Linux
6 8 (0.25%) Android
6 8 (0.25%) Solaris
7 7 (0.22%) Apple iOS
8 5 (0.16%) Mac OS
9 3 (0.093%) CentOS
10 2 (0.062%) VMS
10 2 (0.062%) Windows 10
10 2 (0.062%) Windows Vista
11 1 (0.031%) Debian
11 1 (0.031%) Kali Linux
11 1 (0.031%) Ubuntu
11 1 (0.031%) Windows Server 2016
Processes & Methodologies
1 879 (27.37%) Agile
2 771 (24.00%) Project Management
3 518 (16.13%) Continuous Improvement
4 512 (15.94%) Problem-Solving
5 478 (14.88%) Project Delivery
6 469 (14.60%) Roadmaps
7 455 (14.17%) Risk Management
8 392 (12.20%) Analytics
9 362 (11.27%) Systems Engineering
10 341 (10.62%) Validation
11 326 (10.15%) Decision-Making
12 267 (8.31%) Mentoring
13 261 (8.13%) Business Strategy
14 254 (7.91%) Verification and Validation
15 251 (7.81%) Coaching
16 237 (7.38%) DevOps
17 225 (7.00%) Business Intelligence
18 219 (6.82%) Change Management
19 218 (6.79%) Business Case
20 217 (6.76%) Requirements Management
Programming Languages
1 247 (7.69%) SQL
2 193 (6.01%) Python
3 64 (1.99%) Java
4 63 (1.96%) JavaScript
5 43 (1.34%) C#
6 37 (1.15%) R
7 29 (0.90%) TypeScript
8 27 (0.84%) Apex Code
9 23 (0.72%) PowerShell
10 19 (0.59%) Data Analysis Expressions
11 15 (0.47%) Scala
12 11 (0.34%) Bash
13 10 (0.31%) Go
13 10 (0.31%) VBA
14 9 (0.28%) T-SQL
15 8 (0.25%) C++
16 6 (0.19%) Swift
17 5 (0.16%) PHP
18 3 (0.093%) ABAP
18 3 (0.093%) Kotlin
Qualifications
1 619 (19.27%) BPSS Clearance
2 617 (19.21%) Degree
3 135 (4.20%) Master's Degree
4 111 (3.46%) Security Cleared
5 100 (3.11%) Computer Science Degree
6 93 (2.90%) PMP
7 91 (2.83%) PMI Certification
8 88 (2.74%) CISSP
9 82 (2.55%) Chartered Engineer
10 76 (2.37%) HNC
11 70 (2.18%) CRISC
12 68 (2.12%) CISM
13 60 (1.87%) SC Cleared
14 58 (1.81%) DBS Check
15 36 (1.12%) DV Cleared
16 32 (1.00%) Azure Certification
17 21 (0.65%) CISA
18 19 (0.59%) CBAP
18 19 (0.59%) TOGAF Certification
19 18 (0.56%) APMP
Quality Assurance & Compliance
1 133 (4.14%) Data Quality
2 126 (3.92%) QA
3 96 (2.99%) Accessibility
4 81 (2.52%) ISO/IEC 27001
5 67 (2.09%) NIST
5 67 (2.09%) PMO
6 56 (1.74%) GDPR
7 49 (1.53%) Sarbanes-Oxley
8 39 (1.21%) GRC
9 32 (1.00%) COBIT
10 25 (0.78%) ITGC
10 25 (0.78%) PCI DSS
11 22 (0.68%) Cyber Essentials
12 20 (0.62%) ISO 20022
13 16 (0.50%) Cyber Essentials PLUS
14 15 (0.47%) SLA
15 14 (0.44%) SOC 2
16 12 (0.37%) Actionable Recommendations
16 12 (0.37%) California Consumer Privacy Act
17 10 (0.31%) SEPA
System Software
1 56 (1.74%) Docker
2 32 (1.00%) Active Directory
3 17 (0.53%) VMware Infrastructure
4 4 (0.12%) VMware ESXi
5 3 (0.093%) Hyper-V
5 3 (0.093%) RACF
6 2 (0.062%) Firmware
6 2 (0.062%) VMware NSX
7 1 (0.031%) KVM
7 1 (0.031%) NFS
7 1 (0.031%) Virtual Machines
Systems Management
1 71 (2.21%) Kubernetes
2 60 (1.87%) Terraform
3 17 (0.53%) Microsoft Intune
4 15 (0.47%) Ansible
5 11 (0.34%) Grafana
6 6 (0.19%) FortiGate
7 5 (0.16%) CASB
7 5 (0.16%) Single Sign-On
8 4 (0.12%) CSIRT
9 3 (0.093%) Jamf Pro
10 2 (0.062%) Argo
10 2 (0.062%) Consul
10 2 (0.062%) Graylog
10 2 (0.062%) Kubeflow
10 2 (0.062%) Prometheus
10 2 (0.062%) Rancher
11 1 (0.031%) Automic
11 1 (0.031%) Marathon
11 1 (0.031%) OpenVAS
11 1 (0.031%) Packer
Vendors
1 406 (12.64%) Microsoft
2 162 (5.04%) SAP
3 134 (4.17%) Salesforce
4 94 (2.93%) ServiceNow
5 92 (2.86%) Google
6 69 (2.15%) Oracle
7 39 (1.21%) Atlassian
8 37 (1.15%) Databricks
9 34 (1.06%) Avaloq
10 31 (0.97%) Cisco
11 27 (0.84%) Micro Focus
12 25 (0.78%) VMware
13 22 (0.68%) IBM
13 22 (0.68%) Salesforce Marketing Cloud
14 21 (0.65%) Citrix
15 17 (0.53%) Fortinet
16 16 (0.50%) Adobe
16 16 (0.50%) Siemens
17 15 (0.47%) Workday
18 13 (0.40%) Hitachi