Representational State Transfer (REST)
UK

The following table provides summary statistics for permanent job vacancies with a requirement for REST skills. Included is a benchmarking guide to the salaries offered in vacancies that have cited REST over the 6 months to 10 December 2023 with a comparison to the same period in the previous 2 years.

6 months to
10 Dec 2023
Same period 2022 Same period 2021
Rank 120 91 63
Rank change year-on-year -29 -28 +5
Permanent jobs citing REST 1,450 4,421 6,123
As % of all permanent jobs advertised in the UK 2.77% 3.62% 4.82%
As % of the Libraries, Frameworks & Software Standards category 10.55% 11.16% 12.58%
Number of salaries quoted 1,154 2,793 3,451
10th Percentile £45,000 £42,500 £40,000
25th Percentile £52,500 £50,000 £48,525
Median annual salary (50th Percentile) £70,000 £70,000 £65,000
Median % change year-on-year - +7.69% +8.33%
75th Percentile £88,938 £90,000 £80,000
90th Percentile £102,500 £106,250 £95,000
UK excluding London median annual salary £57,500 £57,500 £55,000
% change year-on-year - +4.55% +10.00%

All Software Libraries and Frameworks
UK

REST is in the Software Libraries and Frameworks category. The following table is for comparison with the above and provides summary statistics for all permanent job vacancies with a requirement for technical specification, industry standards, software libraries and framework skills.

Permanent vacancies with a requirement for technical specification, industry standards, software libraries and framework skills 13,739 39,611 48,676
As % of all permanent jobs advertised in the UK 26.28% 32.41% 38.30%
Number of salaries quoted 10,720 24,123 32,015
10th Percentile £41,250 £40,000 £36,750
25th Percentile £51,250 £50,000 £45,000
Median annual salary (50th Percentile) £65,351 £65,000 £60,000
Median % change year-on-year +0.54% +8.33% +4.35%
75th Percentile £85,000 £86,250 £80,000
90th Percentile £106,289 £105,000 £96,250
UK excluding London median annual salary £57,500 £57,500 £52,500
% change year-on-year - +9.52% +5.00%

REST
Job Vacancy Trend

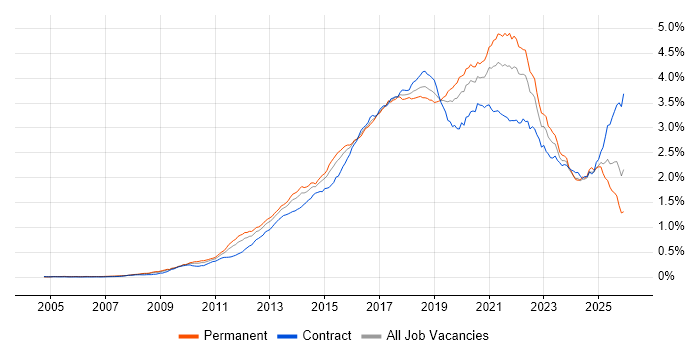
Job postings citing REST as a proportion of all IT jobs advertised.

Job vacancy trend for REST in the UK

REST
Salary Trend

3-month moving average salary quoted in jobs citing REST.

Salary trend for REST in the UK

REST
Salary Histogram

Salary distribution for jobs citing REST over the 6 months to 10 December 2023.

Salary histogram for REST in the UK

REST
Top 17 Job Locations

The table below looks at the demand and provides a guide to the median salaries quoted in IT jobs citing REST within the UK over the 6 months to 10 December 2023. The 'Rank Change' column provides an indication of the change in demand within each location based on the same 6 month period last year.

Location Rank Change
on Same Period
Last Year
Matching
Permanent
IT Job Ads
Median Salary
Past 6 Months
Median Salary
% Change
on Same Period
Last Year
Live
Jobs
England -26 1,260 £70,000 - 474
UK excluding London -11 701 £57,500 - 291
Work from Home -22 663 £70,000 +7.69% 282
London -14 660 £80,000 - 243
South East +4 193 £57,500 -4.17% 90
North of England +28 158 £62,500 +13.64% 74
Midlands +56 107 £52,500 -12.50% 30
South West -15 100 £60,000 +9.09% 40
Scotland -30 95 £60,000 +2.37% 19
North West +27 92 £60,000 - 57
Yorkshire +38 58 £67,500 +28.57% 15
West Midlands +53 56 £53,750 -6.52% 20
East Midlands +48 51 £51,250 -18.00% 10
East of England +48 39 £70,000 +21.74% 20
Northern Ireland -1 15 £67,500 +50.00% 11
North East +34 8 £57,500 +15.00% 2
Wales -33 8 £70,000 +18.31% 10

REST
Co-occurring Skills and Capabilities by Category

The follow tables expand on the table above by listing co-occurrences grouped by category. The same employment type, locality and period is covered with up to 20 co-occurrences shown in each of the following categories:

Application Platforms
1 97 (6.69%) JBoss
2 95 (6.55%) Red Hat Fuse
3 52 (3.59%) IIS
4 44 (3.03%) SharePoint
5 37 (2.55%) Confluence
6 26 (1.79%) Apache
7 25 (1.72%) Apache Spark
8 22 (1.52%) OpenStack
9 13 (0.90%) Oracle SOA Suite
9 13 (0.90%) Tomcat
10 12 (0.83%) CMS
11 8 (0.55%) nginx
11 8 (0.55%) WebLogic
12 7 (0.48%) Apache Airflow
12 7 (0.48%) Oracle Workflow
12 7 (0.48%) Umbraco
13 6 (0.41%) Apache Solr
13 6 (0.41%) SharePoint 2010
13 6 (0.41%) SharePoint 2013
14 5 (0.34%) WebSphere
Applications
1 13 (0.90%) Microsoft Office
2 6 (0.41%) Microsoft Excel
3 3 (0.21%) FileZilla
4 1 (0.069%) Chatbot
4 1 (0.069%) MS Visio
4 1 (0.069%) Sketch
Business Applications
1 30 (2.07%) Dynamics CRM
2 17 (1.17%) Elite 3E
2 17 (1.17%) Maximo
2 17 (1.17%) Remedy ITSM
3 13 (0.90%) BusinessWorks
4 11 (0.76%) Shopify
5 7 (0.48%) NetSuite
5 7 (0.48%) Sparx Enterprise Architect
6 6 (0.41%) Dynamics NAV
7 4 (0.28%) JDE EnterpriseOne
7 4 (0.28%) JDE OneWorld
7 4 (0.28%) Oracle Applications
7 4 (0.28%) Oracle ERP
7 4 (0.28%) Salesforce CRM
8 3 (0.21%) Infor M3
9 2 (0.14%) Magento
9 2 (0.14%) Misys Equation
9 2 (0.14%) Oracle Cash Management
9 2 (0.14%) Payment Gateway
9 2 (0.14%) SDL Web 8
Cloud Services
1 458 (31.59%) Azure
2 333 (22.97%) AWS
3 225 (15.52%) SaaS
4 156 (10.76%) Azure DevOps
5 152 (10.48%) Serverless
6 143 (9.86%) GCP
7 78 (5.38%) Power Platform
8 73 (5.03%) GitHub
8 73 (5.03%) PaaS
9 72 (4.97%) IaaS
10 66 (4.55%) Azure Service Bus
11 58 (4.00%) AWS Lambda
12 57 (3.93%) Amazon EKS
13 40 (2.76%) Amazon ECS
14 31 (2.14%) PowerApps
15 30 (2.07%) Amazon EC2
15 30 (2.07%) Power Automate
16 29 (2.00%) Amazon S3
17 28 (1.93%) AWS CloudFormation
18 27 (1.86%) Cloud Computing
Communications & Networking
1 38 (2.62%) HTTP
2 32 (2.21%) Firewall
3 30 (2.07%) Internet
4 27 (1.86%) WAN
5 19 (1.31%) DNS
6 16 (1.10%) MPLS
7 13 (0.90%) BGP
7 13 (0.90%) SSL
8 12 (0.83%) IOS XR
9 11 (0.76%) TCP/IP
10 9 (0.62%) FTP
11 8 (0.55%) SMTP
11 8 (0.55%) SSH
12 7 (0.48%) DHCP
13 6 (0.41%) AMQP
13 6 (0.41%) MQTT
14 4 (0.28%) 5G
14 4 (0.28%) SD-WAN
15 3 (0.21%) Modbus
15 3 (0.21%) RS-485
Database & Business Intelligence
1 285 (19.66%) SQL Server
2 150 (10.34%) NoSQL
3 115 (7.93%) Relational Database
4 104 (7.17%) MySQL
5 90 (6.21%) PostgreSQL
6 86 (5.93%) Data Warehouse
7 58 (4.00%) Data Lake
7 58 (4.00%) Redis
8 55 (3.79%) Azure SQL Database
9 43 (2.97%) DynamoDB
10 42 (2.90%) Oracle Database
11 39 (2.69%) MongoDB
12 37 (2.55%) Power BI
13 35 (2.41%) SQL Server Integration Services
14 24 (1.66%) Hadoop
15 23 (1.59%) Big Data
16 21 (1.45%) RDBMS
17 20 (1.38%) SQL Server Reporting Services
18 17 (1.17%) GIS
19 15 (1.03%) Amazon RDS
Development Applications
1 258 (17.79%) Jenkins
2 227 (15.66%) Git
3 143 (9.86%) Postman
4 134 (9.24%) Selenium
5 121 (8.34%) Cucumber
6 105 (7.24%) JIRA
7 104 (7.17%) IntelliJ
8 68 (4.69%) JUnit
9 47 (3.24%) Maven
10 41 (2.83%) Cypress.io
11 35 (2.41%) GitLab
12 28 (1.93%) WebDriver
13 27 (1.86%) Team Foundation Server
14 24 (1.66%) JMeter
14 24 (1.66%) Oracle APEX
14 24 (1.66%) SpecFlow
15 21 (1.45%) TeamCity
15 21 (1.45%) webpack
16 19 (1.31%) NUnit
17 18 (1.24%) REST Assured
General
1 282 (19.45%) Finance
2 240 (16.55%) Social Skills
3 160 (11.03%) Public Sector
4 131 (9.03%) Inclusion and Diversity
5 119 (8.21%) Banking
6 104 (7.17%) Analytical Skills
7 46 (3.17%) Law
8 45 (3.10%) Retail
9 37 (2.55%) Games
10 35 (2.41%) Legal
11 31 (2.14%) Financial Institution
12 20 (1.38%) Local Government
13 19 (1.31%) Marketing
14 18 (1.24%) Organisational Skills
14 18 (1.24%) Publishing
15 16 (1.10%) Presentation Skills
16 14 (0.97%) Manufacturing
16 14 (0.97%) Pharmaceutical
17 12 (0.83%) Investment Banking
18 10 (0.69%) Automotive
Job Titles
1 679 (46.83%) Developer
2 420 (28.97%) Senior
3 193 (13.31%) Lead
4 190 (13.10%) Senior Developer
5 188 (12.97%) Java Developer
6 165 (11.38%) Software Engineer
7 153 (10.55%) Architect
8 120 (8.28%) .NET Developer
9 94 (6.48%) Java Engineer
10 93 (6.41%) Senior Software Engineer
11 82 (5.66%) Java Software Engineer
12 79 (5.45%) Solutions Architect
13 73 (5.03%) Lead Developer
14 65 (4.48%) Senior Java Engineer
15 64 (4.41%) Senior Java Software Engineer
16 58 (4.00%) Full Stack Developer
17 56 (3.86%) C# Developer
18 55 (3.79%) Software Developer
19 51 (3.52%) Senior Java Developer
20 47 (3.24%) Senior .NET Developer
Libraries, Frameworks & Software Standards
1 373 (25.72%) SOAP
2 356 (24.55%) Web Services
3 316 (21.79%) JSON
4 315 (21.72%) Spring
5 311 (21.45%) .NET
6 264 (18.21%) AngularJS
7 262 (18.07%) XML
8 239 (16.48%) HTML
9 235 (16.21%) React
10 221 (15.24%) CSS
11 170 (11.72%) Kafka
12 149 (10.28%) Spring Boot
13 143 (9.86%) Hibernate
14 135 (9.31%) Node.js
15 120 (8.28%) .NET Framework
16 119 (8.21%) ASP.NET
17 109 (7.52%) JPA
18 103 (7.10%) GraphQL
19 101 (6.97%) .NET Core
20 95 (6.55%) RESTful
Miscellaneous
1 86 (5.93%) Enterprise Software
2 70 (4.83%) Greenfield Project
3 56 (3.86%) Public Cloud
4 55 (3.79%) Product Ownership
5 54 (3.72%) Distributed Systems
6 53 (3.66%) Cloud Native
7 44 (3.03%) Blockchain
8 42 (2.90%) Mainframe
9 38 (2.62%) Management Information System
10 36 (2.48%) Legacy Systems
11 32 (2.21%) IoT
11 32 (2.21%) Mobile App
12 29 (2.00%) Self-Motivation
13 24 (1.66%) Sports Betting
14 22 (1.52%) Clustering
14 22 (1.52%) Data Structures
14 22 (1.52%) Low-Code
15 20 (1.38%) Foreign Exchange (FX)
16 19 (1.31%) Algorithms
17 17 (1.17%) Reinsurance
Operating Systems
1 99 (6.83%) Linux
2 60 (4.14%) Unix
3 40 (2.76%) Windows
4 19 (1.31%) Android
5 18 (1.24%) Windows Server
6 14 (0.97%) Red Hat Enterprise Linux
7 13 (0.90%) CentOS
8 10 (0.69%) Apple iOS
9 9 (0.62%) Windows Server 2016
10 8 (0.55%) Ubuntu
11 6 (0.41%) Debian
12 3 (0.21%) FreeRTOS
13 2 (0.14%) Windows 10
14 1 (0.069%) Oracle Linux
14 1 (0.069%) VMS
Processes & Methodologies
1 748 (51.59%) Agile
2 424 (29.24%) Microservices
3 391 (26.97%) CI/CD
4 369 (25.45%) DevOps
5 311 (21.45%) Software Engineering
6 285 (19.66%) Problem-Solving
7 212 (14.62%) Scrum
8 203 (14.00%) User Experience
9 180 (12.41%) Mentoring
10 178 (12.28%) Front End Development
11 174 (12.00%) TDD
12 173 (11.93%) Test Automation
13 163 (11.24%) BDD
14 157 (10.83%) Full Stack Development
15 145 (10.00%) SDLC
16 130 (8.97%) Clean Code
17 128 (8.83%) API Testing
18 125 (8.62%) UX Design
19 124 (8.55%) Design Patterns
19 124 (8.55%) Unit Testing
Programming Languages
1 522 (36.00%) Java
2 456 (31.45%) JavaScript
3 455 (31.38%) SQL
4 352 (24.28%) C#
5 206 (14.21%) Python
6 181 (12.48%) TypeScript
7 82 (5.66%) PowerShell
8 66 (4.55%) PHP
9 65 (4.48%) PL/SQL
10 46 (3.17%) T-SQL
11 34 (2.34%) Perl
11 34 (2.34%) Ruby
12 32 (2.21%) Shell Script
13 27 (1.86%) Go
14 24 (1.66%) Scala
15 19 (1.31%) Apex Code
15 19 (1.31%) C++
16 18 (1.24%) Bash
17 17 (1.17%) Groovy
18 15 (1.03%) VB.NET
Qualifications
1 226 (15.59%) Security Cleared
2 204 (14.07%) SC Cleared
3 105 (7.24%) Degree
4 45 (3.10%) Computer Science Degree
5 20 (1.38%) BPSS Clearance
6 16 (1.10%) Azure Certification
7 15 (1.03%) AWS Certification
8 11 (0.76%) DV Cleared
9 8 (0.55%) Microsoft Certification
10 7 (0.48%) ISTQB
11 6 (0.41%) Cisco Certification
11 6 (0.41%) ITIL Foundation Certificate
11 6 (0.41%) MCPD
12 5 (0.34%) CCNA
13 4 (0.28%) AWS Certified Solutions Architect
13 4 (0.28%) CCNP
13 4 (0.28%) ISEB
14 3 (0.21%) Master's Degree
15 2 (0.14%) AWS Certified DevOps Engineer
15 2 (0.14%) JNCIA
Quality Assurance & Compliance
1 164 (11.31%) QA
2 43 (2.97%) Accessibility
3 25 (1.72%) Data Quality
4 22 (1.52%) ISO/IEC 27001
5 17 (1.17%) WCAG
6 8 (0.55%) PCI DSS
7 3 (0.21%) ISO 9000
8 2 (0.14%) Government Security Classifications
8 2 (0.14%) NCSC
8 2 (0.14%) Software Quality Assurance
9 1 (0.069%) ISO 15022
9 1 (0.069%) ISO 20022
System Software
1 195 (13.45%) Docker
2 21 (1.45%) VMware Infrastructure
3 18 (1.24%) Active Directory
4 14 (0.97%) Apache ZooKeeper
5 13 (0.90%) Virtual Machines
6 12 (0.83%) Hyper-V
7 7 (0.48%) HDFS
8 5 (0.34%) Firmware
9 4 (0.28%) FreeRADIUS
9 4 (0.28%) IAG
9 4 (0.28%) VMware NSX
10 3 (0.21%) Embedded Firmware
11 2 (0.14%) Kamailio
11 2 (0.14%) OpenSIPS
11 2 (0.14%) Postfix
11 2 (0.14%) Virtual Servers
12 1 (0.069%) KVM
12 1 (0.069%) VMware ESXi
12 1 (0.069%) vSphere
Systems Management
1 211 (14.55%) Kubernetes
2 83 (5.72%) Ansible
3 71 (4.90%) Terraform
4 15 (1.03%) Grafana
5 10 (0.69%) Puppet
6 9 (0.62%) Packer
6 9 (0.62%) Progress Chef
7 6 (0.41%) Kibana
8 5 (0.34%) Prometheus
9 4 (0.28%) MIIS
9 4 (0.28%) Rancher
10 3 (0.21%) Iperf
10 3 (0.21%) Istio
11 2 (0.14%) Consul
11 2 (0.14%) ZABBIX
12 1 (0.069%) Docker Swarm
12 1 (0.069%) Jamf Pro
12 1 (0.069%) Mesos
Vendors
1 201 (13.86%) Microsoft
2 104 (7.17%) Oracle
3 64 (4.41%) Google
4 45 (3.10%) Salesforce
5 33 (2.28%) ServiceNow
6 31 (2.14%) IBM
7 24 (1.66%) VMware
8 21 (1.45%) Informatica
9 19 (1.31%) TIBCO
10 18 (1.24%) WSO2
11 17 (1.17%) BMC
11 17 (1.17%) CheckPoint
11 17 (1.17%) HP
11 17 (1.17%) Red Hat
11 17 (1.17%) Remedy
12 15 (1.03%) Atlassian
12 15 (1.03%) Dynatrace
12 15 (1.03%) Splunk
13 12 (0.83%) Databricks
14 11 (0.76%) Confluent