Adobe
UK

The table below provides summary statistics for permanent job vacancies with a requirement for knowledge and experience of Adobe products and/or services. Included is a benchmarking guide to the salaries offered in vacancies that have cited Adobe over the 6 months to 7 December 2023 with a comparison to the same period in the previous 2 years.

The figures below represent the IT labour market in general and are not representative of salaries within Adobe Systems, Inc.

6 months to
7 Dec 2023
Same period 2022 Same period 2021
Rank 390 302 249
Rank change year-on-year -88 -53 +104
Permanent jobs citing Adobe 382 1,463 1,908
As % of all permanent jobs advertised in the UK 0.72% 1.19% 1.49%
As % of the Vendors category 1.72% 2.89% 3.80%
Number of salaries quoted 286 658 1,118
10th Percentile £27,500 £31,250 £27,500
25th Percentile £35,313 £38,813 £33,000
Median annual salary (50th Percentile) £50,000 £52,500 £50,000
Median % change year-on-year -4.76% +5.00% +11.11%
75th Percentile £72,500 £75,000 £70,000
90th Percentile £85,000 £90,000 £85,000
UK excluding London median annual salary £47,500 £45,000 £42,500
% change year-on-year +5.56% +5.88% +6.25%

All Vendors
UK

Adobe is in the Vendor Products and Services category. The following table is for comparison with the above and provides summary statistics for all permanent job vacancies with a requirement for knowledge or experience of vendor products and services.

Permanent vacancies with a requirement for knowledge or experience of vendor products and services 22,214 50,563 50,260
As % of all permanent jobs advertised in the UK 41.93% 41.16% 39.22%
Number of salaries quoted 16,235 29,708 33,438
10th Percentile £29,000 £31,250 £30,000
25th Percentile £40,000 £41,250 £39,500
Median annual salary (50th Percentile) £55,000 £57,500 £55,000
Median % change year-on-year -4.35% +4.55% +4.76%
75th Percentile £73,750 £77,500 £73,750
90th Percentile £91,934 £95,000 £88,750
UK excluding London median annual salary £49,500 £50,000 £47,500
% change year-on-year -1.00% +5.26% +4.40%

Adobe
Job Vacancy Trend

Job postings citing Adobe as a proportion of all IT jobs advertised.
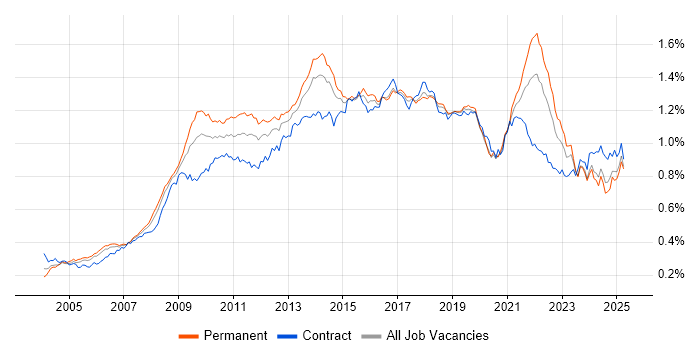
Job vacancy trend for Adobe in the UK

Adobe
Salary Trend

3-month moving average salary quoted in jobs citing Adobe.

Salary trend for Adobe in the UK

Adobe
Salary Histogram

Salary distribution for jobs citing Adobe over the 6 months to 7 December 2023.

Salary histogram for Adobe in the UK

Adobe
Top 16 Job Locations

The table below looks at the demand and provides a guide to the median salaries quoted in IT jobs citing Adobe within the UK over the 6 months to 7 December 2023. The 'Rank Change' column provides an indication of the change in demand within each location based on the same 6 month period last year.

Location Rank Change
on Same Period
Last Year
Matching
Permanent
IT Job Ads
Median Salary
Past 6 Months
Median Salary
% Change
on Same Period
Last Year
Live
Jobs
England -65 363 £50,000 -4.76% 358
UK excluding London -88 183 £47,500 +5.56% 186
London -17 180 £55,000 -4.35% 191
Work from Home -105 156 £52,500 - 158
South East -41 46 £38,000 -30.91% 71
North of England +21 43 £47,500 +5.56% 46
Midlands +66 36 £50,000 +21.21% 28
South West +60 33 £44,000 -2.22% 24
Yorkshire +32 23 £47,500 +8.57% 7
East Midlands +59 19 £47,500 +26.67% 15
North West +55 19 £60,000 +33.33% 38
East of England +84 16 £55,000 +37.50% 14
West Midlands +56 16 £57,500 +27.21% 13
Scotland -32 8 £65,288 +41.16% 8
Wales -4 1 £50,000 -4.76% 2
North East - 1 £72,500 - 1

Adobe
Co-occurring Skills and Capabilities by Category

The follow tables expand on the table above by listing co-occurrences grouped by category. The same employment type, locality and period is covered with up to 20 co-occurrences shown in each of the following categories:

Application Platforms
1 44 (11.52%) Adobe Experience Manager
2 29 (7.59%) CMS
3 12 (3.14%) Confluence
4 9 (2.36%) SharePoint
5 8 (2.09%) WordPress
6 4 (1.05%) MS Exchange
7 3 (0.79%) Apache Airflow
7 3 (0.79%) IIS
7 3 (0.79%) NetWeaver
8 2 (0.52%) Apache Spark
8 2 (0.52%) Appian
8 2 (0.52%) Liferay
8 2 (0.52%) Oracle SOA Suite
8 2 (0.52%) Oracle Workflow
9 1 (0.26%) Drupal
9 1 (0.26%) Luigi
Applications
1 65 (17.02%) Microsoft Office
2 57 (14.92%) Adobe Creative Suite
3 53 (13.87%) Sketch
4 46 (12.04%) Adobe XD
4 46 (12.04%) Photoshop
5 36 (9.42%) InDesign
6 34 (8.90%) Microsoft Excel
7 29 (7.59%) Adobe Illustrator
8 25 (6.54%) Microsoft PowerPoint
9 16 (4.19%) Acrobat
9 16 (4.19%) Adobe After Effects
10 15 (3.93%) AutoCAD
11 14 (3.66%) Adobe Premiere
11 14 (3.66%) InVision
12 8 (2.09%) MS Visio
12 8 (2.09%) Revit
13 7 (1.83%) InCopy
14 5 (1.31%) Adobe Captivate
15 2 (0.52%) CINEMA 4D
15 2 (0.52%) Spreadsheet
Business Applications
1 16 (4.19%) Magento
2 5 (1.31%) SAP Hybris
2 5 (1.31%) SAP S/4HANA
3 4 (1.05%) Adobe Campaign
3 4 (1.05%) SAP CRM
4 3 (0.79%) Carpe Diem
4 3 (0.79%) Eikon
4 3 (0.79%) Shopify
5 2 (0.52%) FastStats
6 1 (0.26%) Dynamics CRM
6 1 (0.26%) Elite 3E
6 1 (0.26%) NetSuite
6 1 (0.26%) SAP PP
6 1 (0.26%) Unica
6 1 (0.26%) Workfront
Cloud Services
1 84 (21.99%) Figma
2 29 (7.59%) Microsoft 365
2 29 (7.59%) Power Platform
3 28 (7.33%) Adobe Creative Cloud
4 25 (6.54%) Adobe Analytics
4 25 (6.54%) Azure
5 22 (5.76%) Google Analytics
6 18 (4.71%) AWS
7 15 (3.93%) GCP
7 15 (3.93%) SaaS
8 13 (3.40%) GitHub
8 13 (3.40%) Google Workspace
9 9 (2.36%) Google Ads
9 9 (2.36%) SAP Commerce Cloud
10 7 (1.83%) WhatsApp
11 6 (1.57%) Mimecast
12 5 (1.31%) Entra ID
12 5 (1.31%) MailChimp
12 5 (1.31%) OneDrive
13 3 (0.79%) Google Drive
Communications & Networking
1 11 (2.88%) LAN
2 10 (2.62%) DNS
3 9 (2.36%) DHCP
3 9 (2.36%) WAN
4 8 (2.09%) Wi-Fi
5 4 (1.05%) VPN
6 3 (0.79%) WebEx
7 2 (0.52%) Cisco ASA
7 2 (0.52%) IP Telephony
7 2 (0.52%) Remote Desktop
7 2 (0.52%) TCP/IP
8 1 (0.26%) 4G
8 1 (0.26%) Bluetooth
8 1 (0.26%) Cisco IOS
8 1 (0.26%) FTP
8 1 (0.26%) NAS
8 1 (0.26%) Network Security
8 1 (0.26%) VLAN
8 1 (0.26%) Wireless
8 1 (0.26%) WLAN
Database & Business Intelligence
1 29 (7.59%) Power BI
2 16 (4.19%) Tableau
3 13 (3.40%) SQL Server
4 10 (2.62%) Data Lake
5 8 (2.09%) SQL Server Reporting Services
6 6 (1.57%) Data Warehouse
6 6 (1.57%) Jackrabbit
7 5 (1.31%) Looker
7 5 (1.31%) SAP HANA
8 4 (1.05%) BigQuery
8 4 (1.05%) MySQL
9 3 (0.79%) Azure SQL Database
9 3 (0.79%) Relational Database
10 1 (0.26%) Big Data
10 1 (0.26%) Hadoop
10 1 (0.26%) Metadata
10 1 (0.26%) MongoDB
10 1 (0.26%) QlikView
Development Applications
1 21 (5.50%) Git
2 14 (3.66%) Jenkins
3 13 (3.40%) JIRA
4 8 (2.09%) Cypress.io
5 6 (1.57%) Cucumber
5 6 (1.57%) Jasmine
6 5 (1.31%) Axure RP
6 5 (1.31%) Bitbucket
7 3 (0.79%) Grunt
7 3 (0.79%) gulp
7 3 (0.79%) Karma Test Runner
7 3 (0.79%) PhantomJS
7 3 (0.79%) Protractor
7 3 (0.79%) Sonatype Nexus
7 3 (0.79%) Spinnaker
7 3 (0.79%) webpack
8 2 (0.52%) Dreamweaver
9 1 (0.26%) LSMW
9 1 (0.26%) MSI
9 1 (0.26%) Visual Studio
General
1 129 (33.77%) Social Skills
2 102 (26.70%) Marketing
3 57 (14.92%) Finance
4 33 (8.64%) Analytical Skills
5 27 (7.07%) Retail
6 25 (6.54%) Advertising
7 24 (6.28%) Legal
8 16 (4.19%) Inclusion and Diversity
9 15 (3.93%) Games
9 15 (3.93%) Law
10 14 (3.66%) Banking
11 12 (3.14%) Manufacturing
12 9 (2.36%) Publishing
13 8 (2.09%) Organisational Skills
14 4 (1.05%) Documentation Skills
14 4 (1.05%) Telecoms
15 3 (0.79%) Pharmaceutical
15 3 (0.79%) Presentation Skills
15 3 (0.79%) Public Sector
16 2 (0.52%) Health Technology
Job Titles
1 84 (21.99%) Designer
2 61 (15.97%) Developer
3 40 (10.47%) UX Designer
4 39 (10.21%) Analyst
4 39 (10.21%) Senior
5 31 (8.12%) Lead
6 30 (7.85%) UI Designer
7 28 (7.33%) Architect
8 26 (6.81%) Front-End Developer (Client-Side Developer)
9 20 (5.24%) UI/UX Designer
10 17 (4.45%) Support Engineer
11 16 (4.19%) Angular Developer
12 14 (3.66%) Senior Designer
13 13 (3.40%) 2nd Line Support
13 13 (3.40%) Digital Analyst
13 13 (3.40%) IT Support
14 11 (2.88%) Technical Architect
15 10 (2.62%) Full Stack Developer
15 10 (2.62%) Junior
16 9 (2.36%) Solutions Architect
Libraries, Frameworks & Software Standards
1 68 (17.80%) HTML
2 54 (14.14%) CSS
3 23 (6.02%) React
4 21 (5.50%) AngularJS
5 16 (4.19%) Unreal Engine
6 13 (3.40%) HTML5
6 13 (3.40%) Node.js
7 11 (2.88%) Sass
8 10 (2.62%) Twitter Bootstrap
9 9 (2.36%) jQuery
9 9 (2.36%) JSON
9 9 (2.36%) Unity (Game Engine)
10 8 (2.09%) CSS3
10 8 (2.09%) JSR 170
10 8 (2.09%) OSGi
10 8 (2.09%) XML
11 7 (1.83%) Flash
11 7 (1.83%) V-Ray
12 6 (1.57%) Jest
12 6 (1.57%) SAP Fiori
Miscellaneous
1 30 (7.85%) Social Media
2 25 (6.54%) Graphic Design
3 21 (5.50%) Product Ownership
4 16 (4.19%) Marketing Technology
4 16 (4.19%) Video Conferencing
5 11 (2.88%) Blog
6 9 (2.36%) Augmented Reality
6 9 (2.36%) e-Learning
6 9 (2.36%) Mobile App
6 9 (2.36%) Virtual Reality
7 8 (2.09%) Onboarding
8 7 (1.83%) Animation
9 6 (1.57%) Digital Media
9 6 (1.57%) HoloLens
9 6 (1.57%) HTC Vive
9 6 (1.57%) Motion Graphics
9 6 (1.57%) Oculus
9 6 (1.57%) Photography
9 6 (1.57%) Video Editing
9 6 (1.57%) Virtual Team
Operating Systems
1 66 (17.28%) Windows
2 27 (7.07%) Windows 10
3 22 (5.76%) Mac OS
4 15 (3.93%) Apple iOS
5 13 (3.40%) Android
6 11 (2.88%) Windows Server
7 7 (1.83%) Mac OS X
8 5 (1.31%) Linux
9 2 (0.52%) VMS
9 2 (0.52%) Windows Server 2012
10 1 (0.26%) Windows 7
Processes & Methodologies
1 117 (30.63%) User Experience
2 80 (20.94%) UX Design
3 66 (17.28%) Agile
4 55 (14.40%) Analytics
5 54 (14.14%) Problem-Solving
6 51 (13.35%) Front End Development
7 41 (10.73%) CRM
8 40 (10.47%) Wireframes
9 38 (9.95%) Business Intelligence
10 37 (9.69%) Digital Marketing
10 37 (9.69%) E-Commerce
11 33 (8.64%) Customer Service
12 32 (8.38%) User-Centered Design (UCD)
13 30 (7.85%) Software Engineering
14 28 (7.33%) Prototyping
14 28 (7.33%) Usability Testing
14 28 (7.33%) User Research
15 26 (6.81%) Cybersecurity
16 22 (5.76%) Computer Science
17 21 (5.50%) Content Management
Programming Languages
1 61 (15.97%) JavaScript
2 32 (8.38%) TypeScript
3 27 (7.07%) SQL
4 19 (4.97%) Python
5 17 (4.45%) Java
6 6 (1.57%) ABAP
6 6 (1.57%) PHP
7 5 (1.31%) R
7 5 (1.31%) Scala
8 4 (1.05%) Bash
8 4 (1.05%) C++
9 3 (0.79%) C
9 3 (0.79%) Groovy
9 3 (0.79%) PowerShell
10 2 (0.52%) C#
10 2 (0.52%) SAPscript
11 1 (0.26%) Go
11 1 (0.26%) Kotlin
Qualifications
1 75 (19.63%) Degree
2 10 (2.62%) Security Cleared
3 7 (1.83%) Computer Science Degree
3 7 (1.83%) SC Cleared
4 5 (1.31%) Master's Degree
4 5 (1.31%) Microsoft Certification
5 4 (1.05%) Azure Certification
5 4 (1.05%) BPSS Clearance
6 3 (0.79%) ITIL Certification
7 2 (0.52%) HND
7 2 (0.52%) MCP
7 2 (0.52%) Numerate Degree
8 1 (0.26%) A+ Certification
8 1 (0.26%) DV Cleared
8 1 (0.26%) HNC
8 1 (0.26%) PhD
8 1 (0.26%) Postgraduate
Quality Assurance & Compliance
1 15 (3.93%) Accessibility
2 14 (3.66%) QA
3 9 (2.36%) GDPR
4 8 (2.09%) Data Quality
4 8 (2.09%) ISO/IEC 27001
5 3 (0.79%) Actionable Recommendations
5 3 (0.79%) SLA
6 1 (0.26%) ITGC
6 1 (0.26%) PCI DSS
6 1 (0.26%) Sarbanes-Oxley
6 1 (0.26%) WCAG
System Software
1 39 (10.21%) Active Directory
2 8 (2.09%) Virtual Machines
3 6 (1.57%) Virtual Desktop
4 3 (0.79%) Docker
5 1 (0.26%) Hyper-V
5 1 (0.26%) VMware ESXi
5 1 (0.26%) VMware Infrastructure
5 1 (0.26%) VMware Workstation
Systems Management
1 14 (3.66%) SCCM
2 10 (2.62%) Jamf Pro
2 10 (2.62%) Microsoft Intune
3 9 (2.36%) Kubernetes
4 4 (1.05%) XenMobile
5 3 (0.79%) Progress Chef
5 3 (0.79%) Terraform
5 3 (0.79%) WSUS
6 1 (0.26%) AirWatch
6 1 (0.26%) vCenter Server
Vendors
1 90 (23.56%) Microsoft
2 59 (15.45%) Google
3 29 (7.59%) Apple
3 29 (7.59%) Salesforce
4 24 (6.28%) SAP
5 11 (2.88%) Citrix
6 10 (2.62%) Cisco
6 10 (2.62%) Facebook
7 9 (2.36%) Autodesk
8 8 (2.09%) Oracle
8 8 (2.09%) VMware
9 7 (1.83%) iManage
10 6 (1.57%) HubSpot
10 6 (1.57%) IBM
10 6 (1.57%) Vectorworks
11 5 (1.31%) Criteo
11 5 (1.31%) Dell
11 5 (1.31%) DoubleClick
11 5 (1.31%) Instagram
12 4 (1.05%) TikTok