Azure DevOps Jobs

Microsoft Azure DevOps
UK

The table below provides summary statistics for permanent job vacancies requiring Azure DevOps skills. It includes a benchmarking guide to the annual salaries offered in vacancies that cited Azure DevOps over the 6 months leading up to 9 October 2024, comparing them to the same period in the previous two years.

6 months to
9 Oct 2024
Same period 2023 Same period 2022
Rank 125 73 93
Rank change year-on-year -52 +20 0
Permanent jobs citing Azure DevOps 1,650 2,493 4,982
As % of all permanent jobs advertised in the UK 2.09% 4.09% 3.46%
As % of the Cloud Services category 6.71% 9.53% 7.54%
Number of salaries quoted 1,000 1,620 3,033
10th Percentile £43,750 £45,000 £42,500
25th Percentile £52,500 £52,500 £51,250
Median annual salary (50th Percentile) £65,000 £65,000 £65,000
Median % change year-on-year - - +8.33%
75th Percentile £80,500 £80,000 £81,250
90th Percentile £95,000 £95,000 £93,750
UK excluding London median annual salary £62,500 £60,000 £60,000
% change year-on-year +4.17% - +9.09%

All Cloud Skills
UK

Azure DevOps falls under the Cloud Services category. For comparison with the information above, the following table provides summary statistics for all permanent job vacancies requiring cloud computing skills.

Permanent vacancies with a requirement for cloud computing skills 24,598 26,158 66,096
As % of all permanent jobs advertised in the UK 31.20% 42.87% 45.87%
Number of salaries quoted 14,203 20,355 37,796
10th Percentile £35,000 £33,250 £34,197
25th Percentile £46,250 £45,653 £46,250
Median annual salary (50th Percentile) £63,929 £62,500 £62,500
Median % change year-on-year +2.29% - +4.17%
75th Percentile £82,500 £82,500 £83,750
90th Percentile £102,500 £100,000 £100,000
UK excluding London median annual salary £55,000 £55,000 £55,000
% change year-on-year - - +10.00%

Azure DevOps
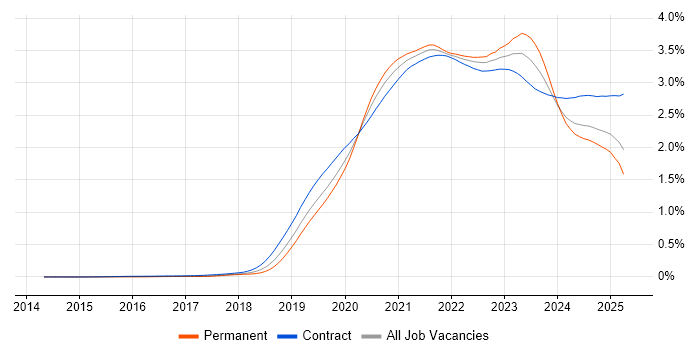
Job Vacancy Trend

Job postings citing Azure DevOps as a proportion of all IT jobs advertised.

Job vacancy trend for Azure DevOps in the UK

Azure DevOps
Salary Trend

3-month moving average salary quoted in jobs citing Azure DevOps.

Salary trend for Azure DevOps in the UK

Azure DevOps
Salary Histogram

Salary distribution for jobs citing Azure DevOps over the 6 months to 9 October 2024.

Salary histogram for Azure DevOps in the UK

Azure DevOps
Top 16 Job Locations

The table below looks at the demand and provides a guide to the median salaries quoted in IT jobs citing Azure DevOps within the UK over the 6 months to 9 October 2024. The 'Rank Change' column provides an indication of the change in demand within each location based on the same 6 month period last year.

Location Rank Change
on Same Period
Last Year
Matching
Permanent
IT Job Ads
Median Salary
Past 6 Months
Median Salary
% Change
on Same Period
Last Year
Live
Jobs
England -41 1,549 £67,500 +3.85% 400
UK excluding London -43 1,130 £62,500 +4.17% 298
Work from Home -56 687 £65,000 - 272
London -81 447 £75,000 - 122
South East -8 339 £67,500 +3.85% 89
North of England -68 251 £60,000 -4.00% 85
South West +25 212 £65,000 +4.00% 34
Midlands -24 203 £60,000 - 48
West Midlands +25 160 £60,000 +9.09% 35
North West -83 131 £60,000 -8.19% 48
Yorkshire -34 84 £67,225 +16.91% 29
East of England -18 62 £50,000 -9.09% 15
Scotland -65 50 £57,500 +2.22% 23
East Midlands -84 43 £51,000 -19.37% 13
North East -17 36 £55,000 -8.33% 8
Wales -28 28 £58,750 +23.68% 7

Azure DevOps
Co-occurring Skills and Capabilities by Category

The follow tables expand on the table above by listing co-occurrences grouped by category. The same employment type, locality and period is covered with up to 20 co-occurrences shown in each of the following categories:

Application Platforms
1 47 (2.85%) SharePoint
2 44 (2.67%) Confluence
3 33 (2.00%) IIS
4 23 (1.39%) Umbraco
5 20 (1.21%) CMS
6 19 (1.15%) Apache Spark
7 13 (0.79%) nginx
8 11 (0.67%) Sitecore CMS
9 9 (0.55%) Apache
10 6 (0.36%) Microsoft Exchange
11 3 (0.18%) Apache Solr
12 2 (0.12%) Apache Airflow
12 2 (0.12%) Moodle
12 2 (0.12%) OpenStack
13 1 (0.061%) Headless CMS
13 1 (0.061%) Kentico
13 1 (0.061%) NServiceBus
13 1 (0.061%) SAS
13 1 (0.061%) WebSphere
Applications
1 37 (2.24%) Microsoft Office
2 18 (1.09%) Microsoft Excel
3 13 (0.79%) MS Visio
4 12 (0.73%) Microsoft Project
5 6 (0.36%) Adobe XD
6 4 (0.24%) Trello
7 2 (0.12%) Microsoft PowerPoint
8 1 (0.061%) Chatbot
8 1 (0.061%) Revit
Business Applications
1 46 (2.79%) Dynamics CRM
2 7 (0.42%) Sparx Enterprise Architect
3 2 (0.12%) Dynamics NAV
3 2 (0.12%) Magento
3 2 (0.12%) SAP Business One
3 2 (0.12%) TIBCO iProcess
3 2 (0.12%) Unit4 Business World
4 1 (0.061%) Dynamics AX
4 1 (0.061%) Payment Gateway
4 1 (0.061%) Remedy ITSM
Cloud Services
1 1,649 (99.94%) Azure
2 348 (21.09%) Power Platform
3 264 (16.00%) Azure Logic Apps
4 252 (15.27%) PaaS
5 233 (14.12%) Serverless
6 217 (13.15%) IaaS
7 209 (12.67%) PowerApps
8 207 (12.55%) AWS
8 207 (12.55%) Power Automate
9 206 (12.48%) Azure Functions
10 167 (10.12%) Azure Service Bus
11 153 (9.27%) GitHub
12 126 (7.64%) SaaS
13 112 (6.79%) Dynamics 365
14 95 (5.76%) Azure Data Factory
15 89 (5.39%) Azure Cosmos DB
16 85 (5.15%) Azure Synapse Analytics
17 82 (4.97%) Entra ID
18 79 (4.79%) GCP
19 77 (4.67%) Azure API Management
Communications & Networking
1 42 (2.55%) DNS
2 39 (2.36%) Network Security
3 32 (1.94%) Firewall
4 15 (0.91%) WAN
5 13 (0.79%) LAN
6 12 (0.73%) MPLS
7 9 (0.55%) BGP
7 9 (0.55%) OSPF
8 7 (0.42%) VPN
8 7 (0.42%) Wireless
9 6 (0.36%) Internet
9 6 (0.36%) TCP/IP
10 4 (0.24%) SD-WAN
10 4 (0.24%) SSL
11 3 (0.18%) DHCP
11 3 (0.18%) VoIP
12 1 (0.061%) Extranet
12 1 (0.061%) FTP
12 1 (0.061%) HTTPS
12 1 (0.061%) Intranet
Database & Business Intelligence
1 480 (29.09%) SQL Server
2 173 (10.48%) Azure SQL Database
3 141 (8.55%) Power BI
4 100 (6.06%) Data Warehouse
5 78 (4.73%) NoSQL
6 73 (4.42%) Relational Database
7 67 (4.06%) PostgreSQL
8 64 (3.88%) MongoDB
9 44 (2.67%) Data Lake
10 42 (2.55%) Elasticsearch
11 38 (2.30%) SQL Server Integration Services
12 37 (2.24%) DB2
13 32 (1.94%) BigQuery
14 28 (1.70%) Looker
15 23 (1.39%) SQL Server Reporting Services
16 21 (1.27%) MySQL
17 15 (0.91%) RDBMS
18 14 (0.85%) Data Vault
19 10 (0.61%) BusinessObjects
19 10 (0.61%) Redis
Development Applications
1 337 (20.42%) Git
2 159 (9.64%) JIRA
3 124 (7.52%) Jenkins
4 119 (7.21%) Visual Studio
5 76 (4.61%) Selenium
6 73 (4.42%) Team Foundation Server
7 64 (3.88%) Octopus Deploy
8 46 (2.79%) MSBuild
9 42 (2.55%) SonarQube
10 41 (2.48%) GitLab
10 41 (2.48%) Postman
11 39 (2.36%) TeamCity
12 33 (2.00%) Visual Studio Code
13 29 (1.76%) SpecFlow
14 28 (1.70%) Bitbucket
15 23 (1.39%) NUnit
16 19 (1.15%) SQL Server Management Studio (SSMS)
17 18 (1.09%) Cypress.io
18 13 (0.79%) Jasmine
19 11 (0.67%) PyCharm
General
1 350 (21.21%) Social Skills
2 252 (15.27%) Finance
3 159 (9.64%) Inclusion and Diversity
4 127 (7.70%) Analytical Skills
5 105 (6.36%) Public Sector
6 54 (3.27%) Retail
7 38 (2.30%) Automotive
8 28 (1.70%) Billing
8 28 (1.70%) Manufacturing
9 27 (1.64%) Marketing
10 26 (1.58%) Law
11 24 (1.45%) Organisational Skills
12 21 (1.27%) Back Office
13 16 (0.97%) Tech for Good
14 15 (0.91%) Banking
15 11 (0.67%) Advertising
15 11 (0.67%) Legal
16 10 (0.61%) Documentation Skills
16 10 (0.61%) Presentation Skills
17 8 (0.48%) Multimedia
Job Titles
1 497 (30.12%) Developer
2 429 (26.00%) Senior
3 242 (14.67%) Lead
4 182 (11.03%) Senior Developer
5 181 (10.97%) Azure Engineer
6 159 (9.64%) .NET Developer
7 151 (9.15%) Software Engineer
8 148 (8.97%) Analyst
9 142 (8.61%) DevOps Engineer
10 131 (7.94%) Cloud Engineer
11 123 (7.45%) Architect
12 110 (6.67%) C# Developer
13 106 (6.42%) Full-Stack Developer
14 83 (5.03%) C# .NET Developer
15 81 (4.91%) Azure DevOps Engineer
15 81 (4.91%) Senior .NET Developer
16 80 (4.85%) Software Developer
17 70 (4.24%) Data Engineer
18 60 (3.64%) Azure Developer
19 59 (3.58%) Senior Software Engineer
Libraries, Frameworks & Software Standards
1 637 (38.61%) .NET
2 265 (16.06%) ASP.NET
3 232 (14.06%) React
4 219 (13.27%) HTML
5 213 (12.91%) .NET Framework
6 211 (12.79%) CSS
7 189 (11.45%) AngularJS
8 168 (10.18%) REST
9 149 (9.03%) .NET Core
10 141 (8.55%) Entity Framework
11 114 (6.91%) ARM Templates
12 108 (6.55%) Twitter Bootstrap
13 94 (5.70%) RESTful
14 93 (5.64%) Web Services
15 91 (5.52%) Node.js
16 90 (5.45%) jQuery
17 84 (5.09%) ASP.NET Core
17 84 (5.09%) XML
18 83 (5.03%) YAML
19 78 (4.73%) JSON
Miscellaneous
1 185 (11.21%) Data Structures
2 100 (6.06%) Product Ownership
3 62 (3.76%) Cloud Native
4 49 (2.97%) Management Information System
5 48 (2.91%) Greenfield Project
5 48 (2.91%) Hybrid Cloud
6 47 (2.85%) Algorithms
7 43 (2.61%) Blockchain
8 35 (2.12%) Onboarding
9 31 (1.88%) Mobile App
10 25 (1.52%) Distributed Systems
11 24 (1.45%) Self-Motivation
12 22 (1.33%) Legacy Systems
13 21 (1.27%) Data Centre
13 21 (1.27%) Public Cloud
14 17 (1.03%) Enterprise Software
15 16 (0.97%) Low-Code
16 14 (0.85%) Linux Command Line
17 13 (0.79%) Cyber Threat
17 13 (0.79%) IoT
Operating Systems
1 175 (10.61%) Windows
2 138 (8.36%) Linux
3 51 (3.09%) Android
4 49 (2.97%) Apple iOS
5 44 (2.67%) Windows Server
6 20 (1.21%) VMS
7 17 (1.03%) Unix
8 14 (0.85%) CentOS
9 7 (0.42%) Debian
9 7 (0.42%) Mac OS
10 6 (0.36%) Alpine Linux
10 6 (0.36%) Windows 10
10 6 (0.36%) Windows Server 2019
11 5 (0.30%) Windows Server 2008
12 4 (0.24%) Red Hat Enterprise Linux
13 3 (0.18%) AIX
14 2 (0.12%) Ubuntu
14 2 (0.12%) Windows Server 2016
15 1 (0.061%) CoreOS
15 1 (0.061%) Fedora
Processes & Methodologies
1 1,646 (99.76%) DevOps
2 707 (42.85%) CI/CD
3 693 (42.00%) Agile
4 317 (19.21%) Software Engineering
5 308 (18.67%) Problem-Solving
6 252 (15.27%) Infrastructure as Code
7 203 (12.30%) Mentoring
7 203 (12.30%) Scrum
8 195 (11.82%) MVC
9 189 (11.45%) Full-Stack Development
10 176 (10.67%) Test Automation
11 173 (10.48%) Continuous Integration
12 165 (10.00%) Microservices
13 158 (9.58%) Containerisation
14 131 (7.94%) SDLC
15 127 (7.70%) Continuous Improvement
16 125 (7.58%) Data Modelling
17 121 (7.33%) API Management
18 120 (7.27%) SOLID
19 114 (6.91%) Analytics
Programming Languages
1 711 (43.09%) SQL
2 636 (38.55%) C#
3 336 (20.36%) JavaScript
4 315 (19.09%) Python
5 309 (18.73%) PowerShell
6 135 (8.18%) Java
7 115 (6.97%) TypeScript
8 91 (5.52%) T-SQL
9 82 (4.97%) Bicep
10 71 (4.30%) Bash
11 52 (3.15%) C++
12 39 (2.36%) PHP
13 24 (1.45%) Kusto Query Language
14 23 (1.39%) VB.NET
15 21 (1.27%) C
16 20 (1.21%) Data Analysis Expressions
17 16 (0.97%) Objective-C
18 11 (0.67%) Go
18 11 (0.67%) Shell Script
18 11 (0.67%) VB
Qualifications
1 233 (14.12%) Azure Certification
2 189 (11.45%) Degree
3 112 (6.79%) Security Cleared
4 78 (4.73%) Microsoft Certification
5 69 (4.18%) Computer Science Degree
6 66 (4.00%) SC Cleared
7 40 (2.42%) BPSS Clearance
8 27 (1.64%) ISTQB
9 17 (1.03%) Cisco Certification
10 16 (0.97%) Master's Degree
11 13 (0.79%) ISEB
11 13 (0.79%) ISTQB Foundation Certification
12 12 (0.73%) CCNP
13 9 (0.55%) JNCIS
13 9 (0.55%) TOGAF Certification
14 8 (0.48%) DBS Check
14 8 (0.48%) DV Cleared
15 7 (0.42%) AWS Certification
15 7 (0.42%) MCSA
16 6 (0.36%) MCSE
Quality Assurance & Compliance
1 150 (9.09%) QA
2 46 (2.79%) Accessibility
3 43 (2.61%) Data Quality
4 42 (2.55%) GDPR
5 22 (1.33%) NCSC
6 14 (0.85%) NIST
7 13 (0.79%) ISO/IEC 27001
8 9 (0.55%) Cyber Essentials
8 9 (0.55%) Solvency II
9 8 (0.48%) SLA
10 7 (0.42%) HIPAA
11 6 (0.36%) ISO 9001
12 4 (0.24%) EMIR
12 4 (0.24%) MiFID
12 4 (0.24%) PCI DSS
12 4 (0.24%) SOC 2
13 3 (0.18%) PMO
14 2 (0.12%) Cyber Essentials PLUS
14 2 (0.12%) WCAG
15 1 (0.061%) ISO 20022
System Software
1 248 (15.03%) Docker
2 91 (5.52%) Virtual Machines
3 78 (4.73%) Active Directory
4 28 (1.70%) Virtual Desktop
5 8 (0.48%) VMware Infrastructure
6 7 (0.42%) Hyper-V
7 3 (0.18%) XenApp
7 3 (0.18%) XenDesktop
8 2 (0.12%) Microsoft Virtual Server
8 2 (0.12%) Virtual Servers
9 1 (0.061%) Shibboleth
9 1 (0.061%) VMware ESXi
9 1 (0.061%) vSphere
Systems Management
1 339 (20.55%) Terraform
2 252 (15.27%) Kubernetes
3 103 (6.24%) Ansible
4 30 (1.82%) Grafana
5 28 (1.70%) Prometheus
6 15 (0.91%) Progress Chef
7 14 (0.85%) Puppet
8 11 (0.67%) HP ALM
8 11 (0.67%) Istio
8 11 (0.67%) Packer
9 10 (0.61%) CASB
10 9 (0.55%) Microsoft Intune
11 6 (0.36%) Nagios
12 5 (0.30%) MIIS
12 5 (0.30%) Single Sign-On
13 4 (0.24%) Kibana
14 3 (0.18%) Active Directory Federation Services
15 2 (0.12%) CloudForms
15 2 (0.12%) HP Quality Center
15 2 (0.12%) vRealize
Vendors
1 700 (42.42%) Microsoft
2 100 (6.06%) Databricks
3 61 (3.70%) Google
4 51 (3.09%) Red Hat
5 44 (2.67%) IBM
6 43 (2.61%) Oracle
7 28 (1.70%) ServiceNow
8 23 (1.39%) Xamarin
9 22 (1.33%) Informatica
10 16 (0.97%) Salesforce
10 16 (0.97%) Sitecore
11 13 (0.79%) Atlassian
12 12 (0.73%) VMware
13 11 (0.67%) HP
14 10 (0.61%) Adobe
14 10 (0.61%) Cisco
14 10 (0.61%) Splunk
14 10 (0.61%) Veracode
15 9 (0.55%) Siemens
16 8 (0.48%) SAP