Microsoft Azure Engineer
UK

The median Microsoft Azure Engineer salary in the UK is £65,000 per year according to job vacancies posted during the 6 months to 7 December 2023.

The first table below provides salary benchmarking and summary statistics including a comparison to same period in the previous 2 years.

6 months to
7 Dec 2023
Same period 2022 Same period 2021
Rank 242 357 324
Rank change year-on-year +115 -33 -104
Permanent jobs requiring an Azure Engineer 734 1,166 1,420
As % of all permanent jobs advertised in the UK 1.39% 0.95% 1.11%
As % of the Job Titles category 1.45% 0.99% 1.16%
Number of salaries quoted 630 965 1,242
10th Percentile £47,250 £42,500 £40,000
25th Percentile £55,000 £55,000 £52,500
Median annual salary (50th Percentile) £65,000 £70,000 £62,500
Median % change year-on-year -7.14% +12.00% +17.92%
75th Percentile £77,500 £87,500 £75,000
90th Percentile £87,500 £95,000 £86,250
UK excluding London median annual salary £62,500 £61,500 £60,000
% change year-on-year +1.63% +2.50% +23.39%

All Permanent IT Job Vacancies
UK

The following table is for comparison with the above and includes summary statistics for all permanent IT job vacancies. Most job vacancies include a discernible job title that can be normalized. As such, the figures in the second row provide an indication of the number of permanent jobs in our overall sample.

Permanent vacancies in the UK with a recognized job title 50,561 117,203 121,950
% of permanent jobs with a recognized job title 95.43% 95.41% 95.16%
Number of salaries quoted 36,942 73,752 84,378
10th Percentile £31,250 £32,798 £32,125
25th Percentile £42,500 £45,000 £42,500
Median annual salary (50th Percentile) £60,000 £60,000 £57,500
Median % change year-on-year - +4.35% +4.55%
75th Percentile £80,000 £81,250 £77,500
90th Percentile £97,500 £98,750 £95,000
UK excluding London median annual salary £52,500 £52,500 £50,000
% change year-on-year - +5.00% +5.26%

Azure Engineer
Job Vacancy Trend

Job postings that featured Azure Engineer in the job title as a proportion of all IT jobs advertised.
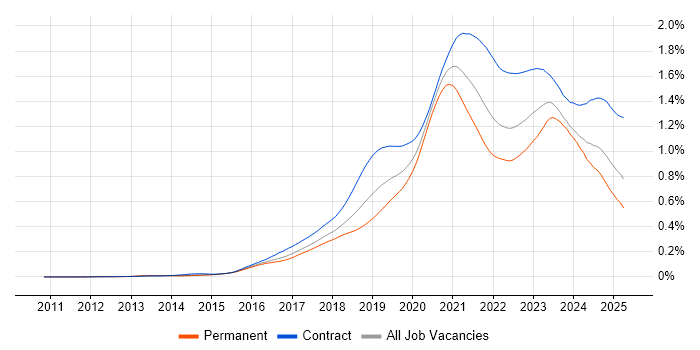
Job vacancy trend for Azure Engineer in the UK

Azure Engineer
Salary Trend

3-month moving average salary quoted in jobs citing Azure Engineer.

Salary trend for Azure Engineer in the UK

Azure Engineer
Salary Histogram

Salary distribution for jobs citing Azure Engineer over the 6 months to 7 December 2023.

Salary histogram for Azure Engineer in the UK

Azure Engineer
Top 17 Job Locations

The table below looks at the demand and provides a guide to the median salaries quoted in IT jobs citing Azure Engineer within the UK over the 6 months to 7 December 2023. The 'Rank Change' column provides an indication of the change in demand within each location based on the same 6 month period last year.

Location Rank Change
on Same Period
Last Year
Matching
Permanent
IT Job Ads
Median Salary
Past 6 Months
Median Salary
% Change
on Same Period
Last Year
Live
Jobs
England +102 657 £65,000 -7.14% 216
UK excluding London +115 346 £62,500 +1.63% 146
Work from Home +69 322 £65,000 -7.14% 136
London +96 317 £70,000 -12.50% 87
North of England +64 94 £65,351 -3.18% 47
South East +86 78 £57,500 - 32
Midlands +89 77 £60,000 -5.88% 15
East Midlands +72 57 £61,750 +2.92% 7
North West +114 50 £65,351 +13.65% 21
South West +84 49 £65,000 +18.18% 26
Yorkshire +35 38 £65,351 -20.79% 13
Scotland +47 26 £47,557 -36.59% 12
East of England +112 21 £80,000 +45.45% 12
West Midlands +66 20 £57,500 -16.36% 8
North East +27 6 £60,000 -14.29% 13
Wales +18 6 £60,000 -25.00% 5
Northern Ireland +39 5 £68,750 +14.58%

Azure Engineer Skill Set
Top 30 Co-occurring Skills and Capabilities

For the 6 months to 7 December 2023, Azure Engineer job roles required the following skills and capabilities in order of popularity. The figures indicate the absolute number co-occurrences and as a proportion of all permanent job ads featuring Azure Engineer in the job title.

1 733 (99.86%) Azure
2 383 (52.18%) DevOps
3 281 (38.28%) Azure DevOps
4 268 (36.51%) Terraform
5 265 (36.10%) PowerShell
6 253 (34.47%) Microsoft
7 225 (30.65%) Kubernetes
8 218 (29.70%) Infrastructure as Code
9 215 (29.29%) CI/CD
10 191 (26.02%) Agile
11 179 (24.39%) SQL
12 174 (23.71%) Docker
13 165 (22.48%) Python
14 153 (20.84%) Windows
15 148 (20.16%) Finance
16 144 (19.62%) AWS
17 136 (18.53%) Active Directory
18 131 (17.85%) Infrastructure Engineering
19 122 (16.62%) Microsoft 365
20 116 (15.80%) Social Skills
21 105 (14.31%) Problem-Solving
22 98 (13.35%) Migration
23 95 (12.94%) Containerisation
24 93 (12.67%) Ansible
24 93 (12.67%) PaaS
25 92 (12.53%) Windows Server
26 90 (12.26%) Bash
27 89 (12.13%) IaaS
28 87 (11.85%) Entra ID
29 84 (11.44%) Azure Data Factory

Azure Engineer Skill Set
Co-occurring Skills and Capabilities by Category

The follow tables expand on the table above by listing co-occurrences grouped by category. The same employment type, locality and period is covered with up to 20 co-occurrences shown in each of the following categories:

Application Platforms
1 28 (3.81%) SharePoint
2 24 (3.27%) MS Exchange
3 16 (2.18%) Confluence
4 6 (0.82%) NServiceBus
5 4 (0.54%) Apache Airflow
5 4 (0.54%) OpenStack
6 3 (0.41%) nginx
6 3 (0.41%) SAS
7 2 (0.27%) Apache Spark
7 2 (0.27%) IIS
7 2 (0.27%) Umbraco
8 1 (0.14%) Apache Synapse
8 1 (0.14%) CMS
Applications
1 4 (0.54%) Microsoft Office
2 2 (0.27%) Microsoft Excel
3 1 (0.14%) Microsoft PowerPoint
Business Applications
1 3 (0.41%) Dynamics NAV
2 1 (0.14%) Dynamics CRM
Cloud Services
1 733 (99.86%) Azure
2 281 (38.28%) Azure DevOps
3 144 (19.62%) AWS
4 122 (16.62%) Microsoft 365
5 93 (12.67%) PaaS
6 89 (12.13%) IaaS
7 87 (11.85%) Entra ID
8 84 (11.44%) Azure Data Factory
9 74 (10.08%) SaaS
10 59 (8.04%) GCP
11 56 (7.63%) Power Platform
12 54 (7.36%) GitHub
13 53 (7.22%) Azure AKS
14 51 (6.95%) Serverless
15 40 (5.45%) Azure Monitor
16 38 (5.18%) Azure Synapse Analytics
17 37 (5.04%) Azure Cosmos DB
18 35 (4.77%) Cloud Computing
19 33 (4.50%) Azure Service Bus
20 27 (3.68%) Azure Storage
Communications & Networking
1 63 (8.58%) DNS
2 45 (6.13%) Firewall
3 32 (4.36%) Network Security
4 31 (4.22%) DHCP
5 26 (3.54%) VPN
6 24 (3.27%) WAN
7 19 (2.59%) LAN
8 16 (2.18%) SAN
9 12 (1.63%) TCP/IP
10 9 (1.23%) Wi-Fi
11 8 (1.09%) Internet
11 8 (1.09%) VLAN
12 7 (0.95%) HTTP
13 6 (0.82%) NAS
14 4 (0.54%) 5G
14 4 (0.54%) iSCSI
14 4 (0.54%) SD-WAN
14 4 (0.54%) SMTP
14 4 (0.54%) VoIP
15 2 (0.27%) IPv4
Database & Business Intelligence
1 76 (10.35%) SQL Server
2 53 (7.22%) Azure SQL Database
3 50 (6.81%) Power BI
4 41 (5.59%) Data Warehouse
5 35 (4.77%) Data Lake
6 20 (2.72%) NoSQL
7 18 (2.45%) Delta Lake
7 18 (2.45%) Relational Database
8 14 (1.91%) MongoDB
8 14 (1.91%) SQL Server Integration Services
9 12 (1.63%) Big Data
9 12 (1.63%) InfluxDB
10 9 (1.23%) Redis
11 8 (1.09%) InterSystems Cache
12 7 (0.95%) BigQuery
13 6 (0.82%) Data Vault
13 6 (0.82%) Metadata
13 6 (0.82%) Microsoft Analysis Services
13 6 (0.82%) SQL Server Analysis Services
14 5 (0.68%) Parquet
Development Applications
1 77 (10.49%) Jenkins
2 53 (7.22%) Git
3 36 (4.90%) GitLab
4 18 (2.45%) JIRA
5 15 (2.04%) Bitbucket
6 14 (1.91%) Atlassian Bamboo
6 14 (1.91%) SonarQube
6 14 (1.91%) TeamCity
7 13 (1.77%) Team Foundation Server
8 11 (1.50%) Octopus Deploy
8 11 (1.50%) Sonatype Nexus
9 7 (0.95%) Artifactory
10 2 (0.27%) Chocolatey
10 2 (0.27%) Visual Studio
10 2 (0.27%) Visual Studio Team System
11 1 (0.14%) Axure RP
11 1 (0.14%) Burp Suite
11 1 (0.14%) git-flow
General
1 148 (20.16%) Finance
2 116 (15.80%) Social Skills
3 50 (6.81%) Inclusion and Diversity
4 44 (5.99%) Banking
5 40 (5.45%) Analytical Skills
6 38 (5.18%) Public Sector
7 34 (4.63%) Retail
8 23 (3.13%) Law
9 21 (2.86%) Marketing
10 17 (2.32%) Legal
11 14 (1.91%) Telecoms
12 12 (1.63%) Financial Institution
13 11 (1.50%) Manufacturing
14 10 (1.36%) Electronics
15 9 (1.23%) Pharmaceutical
16 7 (0.95%) Aerospace
16 7 (0.95%) Billing
16 7 (0.95%) Presentation Skills
17 6 (0.82%) Documentation Skills
18 5 (0.68%) Organisational Skills
Libraries, Frameworks & Software Standards
1 71 (9.67%) ARM Templates
2 47 (6.40%) .NET
3 33 (4.50%) Elastic Stack
4 26 (3.54%) JSON
4 26 (3.54%) Web Services
4 26 (3.54%) YAML
5 22 (3.00%) React
6 19 (2.59%) ASP.NET
6 19 (2.59%) XML
7 16 (2.18%) ADO
8 14 (1.91%) .NET Core
8 14 (1.91%) REST
9 13 (1.77%) PySpark
10 12 (1.63%) OAuth
10 12 (1.63%) RESTful
11 11 (1.50%) OpenID
12 10 (1.36%) .NET Framework
12 10 (1.36%) ASP.NET Core
12 10 (1.36%) Node.js
12 10 (1.36%) RabbitMQ
Miscellaneous
1 46 (6.27%) Public Cloud
2 40 (5.45%) Linux Command Line
3 38 (5.18%) Hybrid Cloud
4 31 (4.22%) Data Centre
5 24 (3.27%) Distributed Systems
6 19 (2.59%) Self-Motivation
7 17 (2.32%) Cloud Native
8 11 (1.50%) Greenfield Project
9 10 (1.36%) Private Cloud
10 7 (0.95%) Onboarding
10 7 (0.95%) Team-Oriented Environment
11 6 (0.82%) Enterprise Software
11 6 (0.82%) IoT
11 6 (0.82%) Management Information System
12 5 (0.68%) iSeries
12 5 (0.68%) Product Ownership
13 4 (0.54%) GNSS
13 4 (0.54%) Legacy Systems
13 4 (0.54%) Security Posture
13 4 (0.54%) Virtual Team
Operating Systems
1 153 (20.84%) Windows
2 92 (12.53%) Windows Server
3 80 (10.90%) Linux
4 22 (3.00%) Windows 10
5 17 (2.32%) Windows Server 2019
6 10 (1.36%) Windows Server 2003
6 10 (1.36%) Windows Server 2016
7 8 (1.09%) Red Hat Enterprise Linux
7 8 (1.09%) Unix
7 8 (1.09%) VMS
7 8 (1.09%) Windows Server 2012
8 5 (0.68%) Apple iOS
8 5 (0.68%) Mac OS
9 2 (0.27%) CentOS
9 2 (0.27%) Ubuntu
10 1 (0.14%) Debian
10 1 (0.14%) Windows 7
Processes & Methodologies
1 383 (52.18%) DevOps
2 218 (29.70%) Infrastructure as Code
3 215 (29.29%) CI/CD
4 191 (26.02%) Agile
5 131 (17.85%) Infrastructure Engineering
6 105 (14.31%) Problem-Solving
7 98 (13.35%) Migration
8 95 (12.94%) Containerisation
9 72 (9.81%) Software Engineering
10 68 (9.26%) Analytics
11 61 (8.31%) Data Engineering
12 58 (7.90%) ETL
13 57 (7.77%) Mentoring
13 57 (7.77%) Platform Engineering
14 56 (7.63%) Business Intelligence
14 56 (7.63%) Cloud Security
15 50 (6.81%) ITIL
16 49 (6.68%) Continuous Integration
17 48 (6.54%) Computer Science
17 48 (6.54%) Configuration Management
Programming Languages
1 265 (36.10%) PowerShell
2 179 (24.39%) SQL
3 165 (22.48%) Python
4 90 (12.26%) Bash
5 65 (8.86%) C#
6 62 (8.45%) Bicep
7 41 (5.59%) Java
8 32 (4.36%) Ruby
9 29 (3.95%) JavaScript
10 22 (3.00%) T-SQL
11 17 (2.32%) Groovy
12 11 (1.50%) Perl
13 8 (1.09%) Kusto Query Language
14 7 (0.95%) Shell Script
15 6 (0.82%) Data Analysis Expressions
16 5 (0.68%) U-SQL
17 4 (0.54%) C++
17 4 (0.54%) TypeScript
18 3 (0.41%) Go
19 2 (0.27%) R
Qualifications
1 82 (11.17%) Azure Certification
1 82 (11.17%) Degree
2 47 (6.40%) Security Cleared
3 36 (4.90%) Microsoft Certification
4 35 (4.77%) SC Cleared
5 32 (4.36%) Computer Science Degree
6 15 (2.04%) DV Cleared
7 14 (1.91%) MCSA
8 13 (1.77%) BPSS Clearance
9 10 (1.36%) Cisco Certification
10 9 (1.23%) AWS Certification
10 9 (1.23%) CISSP
11 6 (0.82%) CISM
12 5 (0.68%) Master's Degree
12 5 (0.68%) MCSE
13 4 (0.54%) (ISC)2 CCSP
13 4 (0.54%) AWS Certified Solutions Architect
13 4 (0.54%) CCSP
14 3 (0.41%) CCNP
14 3 (0.41%) PhD
Quality Assurance & Compliance
1 26 (3.54%) Data Quality
1 26 (3.54%) QA
2 12 (1.63%) ISO/IEC 27001
3 6 (0.82%) GDPR
4 5 (0.68%) NIST
4 5 (0.68%) SLA
5 2 (0.27%) Cyber Essentials
6 1 (0.14%) Cyber Essentials PLUS
6 1 (0.14%) NCSC
6 1 (0.14%) PMO
6 1 (0.14%) SOC 2
System Software
1 174 (23.71%) Docker
2 136 (18.53%) Active Directory
3 62 (8.45%) Virtual Machines
4 51 (6.95%) VMware Infrastructure
5 26 (3.54%) Hyper-V
6 15 (2.04%) Virtual Desktop
7 6 (0.82%) vSphere
8 5 (0.68%) BitLocker
8 5 (0.68%) Virtual Servers
8 5 (0.68%) VMware ESXi
9 4 (0.54%) Microsoft Virtual Server
9 4 (0.54%) XenApp
10 1 (0.14%) NFS
10 1 (0.14%) VMware NSX
Systems Management
1 268 (36.51%) Terraform
2 225 (30.65%) Kubernetes
3 93 (12.67%) Ansible
4 43 (5.86%) Grafana
4 43 (5.86%) Puppet
5 41 (5.59%) Prometheus
6 31 (4.22%) Microsoft Intune
7 27 (3.68%) Progress Chef
8 14 (1.91%) SCCM
9 13 (1.77%) Single Sign-On
10 12 (1.63%) Active Directory Federation Services
11 10 (1.36%) Packer
12 7 (0.95%) Salt
13 6 (0.82%) Istio
13 6 (0.82%) WSUS
14 5 (0.68%) Jamf Pro
14 5 (0.68%) Nagios
15 3 (0.41%) SCOM
16 2 (0.27%) Check_MK
17 1 (0.14%) Kibana
Vendors
1 253 (34.47%) Microsoft
2 68 (9.26%) VMware
3 55 (7.49%) Databricks
4 28 (3.81%) SAP
5 17 (2.32%) Citrix
5 17 (2.32%) Google
6 15 (2.04%) New Relic
7 14 (1.91%) Talend
8 13 (1.77%) HP
8 13 (1.77%) SaltStack
9 12 (1.63%) Atlassian
10 10 (1.36%) Cisco
10 10 (1.36%) Dynatrace
11 9 (1.23%) Meraki
11 9 (1.23%) SolarWinds
12 8 (1.09%) AppDynamics
13 5 (0.68%) Okta
13 5 (0.68%) OpenAI
13 5 (0.68%) Palo Alto
14 4 (0.54%) Sonatype