Data Engineering
UK

The following table provides summary statistics for permanent job vacancies with a requirement for Data Engineering skills. Included is a benchmarking guide to the salaries offered in vacancies that have cited Data Engineering over the 6 months to 28 November 2023 with a comparison to the same period in the previous 2 years.

6 months to
28 Nov 2023
Same period 2022 Same period 2021
Rank 210 150 229
Rank change year-on-year -60 +79 +97
Permanent jobs citing Data Engineering 903 3,090 2,088
As % of all permanent jobs advertised in the UK 1.66% 2.46% 1.63%
As % of the Processes & Methodologies category 1.77% 2.57% 1.70%
Number of salaries quoted 648 1,357 1,402
10th Percentile £43,750 £47,500 £41,375
25th Percentile £55,000 £57,500 £52,500
Median annual salary (50th Percentile) £70,000 £77,000 £69,500
Median % change year-on-year -9.09% +10.79% +15.83%
75th Percentile £92,500 £92,500 £87,500
90th Percentile £106,625 £108,750 £105,000
UK excluding London median annual salary £67,500 £67,500 £60,000
% change year-on-year - +12.50% +9.09%

All Process and Methodology Skills
UK

Data Engineering is in the Processes and Methodologies category. The following table is for comparison with the above and provides summary statistics for all permanent job vacancies with a requirement for process or methodology skills.

Permanent vacancies with a requirement for process or methodology skills 51,121 120,104 122,523
As % of all permanent jobs advertised in the UK 94.09% 95.72% 95.43%
Number of salaries quoted 36,956 73,203 81,032
10th Percentile £32,500 £34,313 £32,500
25th Percentile £43,750 £45,000 £42,500
Median annual salary (50th Percentile) £60,000 £60,000 £59,000
Median % change year-on-year - +1.69% +7.27%
75th Percentile £80,000 £81,250 £77,500
90th Percentile £98,750 £100,000 £95,000
UK excluding London median annual salary £52,500 £53,000 £50,000
% change year-on-year -0.94% +6.00% +4.17%

Data Engineering
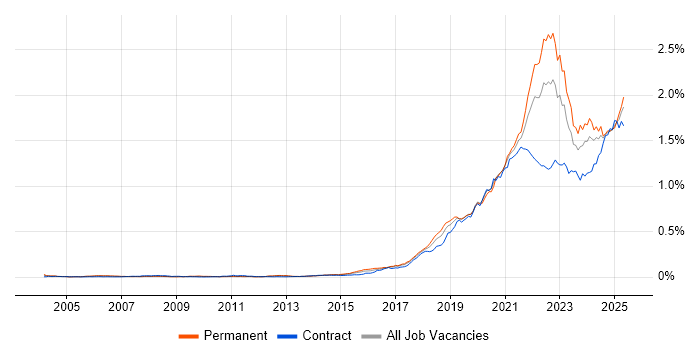
Job Vacancy Trend

Job postings citing Data Engineering as a proportion of all IT jobs advertised.

Job vacancy trend for Data Engineering in the UK

Data Engineering
Salary Trend

3-month moving average salary quoted in jobs citing Data Engineering.

Salary trend for Data Engineering in the UK

Data Engineering
Salary Histogram

Salary distribution for jobs citing Data Engineering over the 6 months to 28 November 2023.

Salary histogram for Data Engineering in the UK

Data Engineering
Top 17 Job Locations

The table below looks at the demand and provides a guide to the median salaries quoted in IT jobs citing Data Engineering within the UK over the 6 months to 28 November 2023. The 'Rank Change' column provides an indication of the change in demand within each location based on the same 6 month period last year.

Location Rank Change
on Same Period
Last Year
Matching
Permanent
IT Job Ads
Median Salary
Past 6 Months
Median Salary
% Change
on Same Period
Last Year
Live
Jobs
England -52 831 £70,576 -8.93% 410
Work from Home +13 451 £70,576 -13.93% 229
UK excluding London -83 446 £67,500 - 211
London -16 393 £80,000 -5.88% 239
North of England -88 121 £62,500 - 64
South West +14 118 £75,000 +7.14% 19
South East +8 74 £72,500 -3.33% 55
Midlands -54 63 £57,000 -8.80% 26
North West -75 60 £55,000 -15.34% 38
Yorkshire -41 53 £66,250 +9.34% 14
West Midlands -20 52 £57,000 -15.56% 8
East of England +54 29 £61,250 -5.77% 21
Scotland -67 21 £70,576 +8.58% 8
Wales -3 15 £46,060 -19.28% 15
East Midlands -19 11 £55,000 -8.33% 18
North East +33 8 £64,740 -7.51% 12
Northern Ireland +34 5 £70,000 +27.27% 4

Data Engineering
Co-occurring Skills and Capabilities by Category

The follow tables expand on the table above by listing co-occurrences grouped by category. The same employment type, locality and period is covered with up to 20 co-occurrences shown in each of the following categories:

Application Platforms
1 111 (12.29%) Apache Spark
2 74 (8.19%) Apache
3 70 (7.75%) Apache Airflow
4 17 (1.88%) Jupyter
5 11 (1.22%) nginx
6 10 (1.11%) Confluence
7 9 (1.00%) SharePoint
8 8 (0.89%) Luigi
9 5 (0.55%) Ethereum
9 5 (0.55%) SAS
10 1 (0.11%) Apache Pulsar
10 1 (0.11%) CMS
Applications
1 18 (1.99%) Microsoft Excel
2 8 (0.89%) Microsoft Office
3 5 (0.55%) MS Visio
Business Applications
1 4 (0.44%) Dynamics CRM
2 3 (0.33%) SAP S/4HANA
3 2 (0.22%) Dynamics NAV
3 2 (0.22%) NetSuite
3 2 (0.22%) Ripple
4 1 (0.11%) SAP BPC
4 1 (0.11%) SAP ERP
4 1 (0.11%) SAP Oil and Gas
Cloud Services
1 437 (48.39%) Azure
2 317 (35.11%) AWS
3 198 (21.93%) GCP
4 157 (17.39%) Power Platform
5 154 (17.05%) Azure Data Factory
6 113 (12.51%) Snowflake
7 81 (8.97%) Azure Synapse Analytics
8 71 (7.86%) Azure DevOps
9 63 (6.98%) Amazon S3
10 50 (5.54%) Serverless
11 46 (5.09%) GitHub
12 36 (3.99%) dbt
13 29 (3.21%) AWS Lambda
14 25 (2.77%) GitHub Actions
15 24 (2.66%) OpenShift
16 21 (2.33%) Dagster
17 20 (2.21%) Vertex AI
18 16 (1.77%) Amazon Kinesis
19 14 (1.55%) Azure Stack
20 13 (1.44%) Amazon EMR
Communications & Networking
1 6 (0.66%) SSH
2 5 (0.55%) Network Security
2 5 (0.55%) SMS
2 5 (0.55%) WAN
3 4 (0.44%) Firewall
3 4 (0.44%) VPN
4 3 (0.33%) Internet
5 1 (0.11%) FTP
5 1 (0.11%) HTTP
Database & Business Intelligence
1 240 (26.58%) Data Warehouse
2 166 (18.38%) Data Lake
3 155 (17.17%) Power BI
4 130 (14.40%) Big Data
5 106 (11.74%) SQL Server
6 101 (11.18%) Hadoop
7 79 (8.75%) Relational Database
8 73 (8.08%) Tableau
9 68 (7.53%) NoSQL
10 64 (7.09%) SQL Server Integration Services
11 63 (6.98%) BigQuery
12 56 (6.20%) Metadata
13 45 (4.98%) Delta Lake
14 43 (4.76%) Amazon Redshift
15 42 (4.65%) PostgreSQL
16 41 (4.54%) SQL Server Reporting Services
17 38 (4.21%) Looker
17 38 (4.21%) MongoDB
17 38 (4.21%) SQL Server Analysis Services
18 36 (3.99%) Azure SQL Database
Development Applications
1 64 (7.09%) Jenkins
2 59 (6.53%) Git
3 18 (1.99%) Cucumber
4 16 (1.77%) JIRA
5 14 (1.55%) Spinnaker
6 11 (1.22%) Atlassian Bamboo
6 11 (1.22%) Sonatype Nexus
6 11 (1.22%) SQL Server Management Studio (SSMS)
7 10 (1.11%) Selenium
8 9 (1.00%) GitLab
9 8 (0.89%) Ant
9 8 (0.89%) Artifactory
9 8 (0.89%) ERwin
9 8 (0.89%) Gradle
9 8 (0.89%) Maven
9 8 (0.89%) Mocha
9 8 (0.89%) SonarQube
9 8 (0.89%) Zephyr
10 7 (0.78%) JUnit
11 6 (0.66%) Xcode
General
1 280 (31.01%) Finance
2 277 (30.68%) Social Skills
3 155 (17.17%) Analytical Skills
4 94 (10.41%) Inclusion and Diversity
5 86 (9.52%) Banking
6 40 (4.43%) Retail
7 36 (3.99%) Public Sector
8 33 (3.65%) Marketing
9 24 (2.66%) Influencing Skills
10 17 (1.88%) Legal
11 12 (1.33%) Advertising
11 12 (1.33%) Health Technology
12 10 (1.11%) Telecoms
13 9 (1.00%) Presentation Skills
14 8 (0.89%) Financial Institution
14 8 (0.89%) Law
15 7 (0.78%) Aviation
15 7 (0.78%) Front Office
15 7 (0.78%) Investment Banking
15 7 (0.78%) Manufacturing
Job Titles
1 437 (48.39%) Data Engineer
2 153 (16.94%) Lead
3 150 (16.61%) Senior
4 98 (10.85%) Senior Data Engineer
5 78 (8.64%) Lead Data Engineer
6 57 (6.31%) Azure Engineer
7 56 (6.20%) Developer
8 54 (5.98%) Architect
9 47 (5.20%) Head of Engineering
10 46 (5.09%) Azure Data Engineer
11 45 (4.98%) Data Architect
12 37 (4.10%) Python Engineer
13 36 (3.99%) Data Scientist
14 35 (3.88%) DevOps Engineer
15 34 (3.77%) Analyst
16 33 (3.65%) Data Manager
17 30 (3.32%) Engineering Manager
17 30 (3.32%) Python Data Engineer
17 30 (3.32%) Software Engineer
18 22 (2.44%) Data Analyst
Libraries, Frameworks & Software Standards
1 85 (9.41%) Kafka
2 75 (8.31%) PySpark
3 44 (4.87%) Pandas
4 41 (4.54%) HTML
5 36 (3.99%) Node.js
6 34 (3.77%) .NET
7 33 (3.65%) NumPy
8 32 (3.54%) React
9 22 (2.44%) TensorFlow
10 19 (2.10%) Flask
10 19 (2.10%) YAML
11 18 (1.99%) Apache NiFi
12 15 (1.66%) Elastic Stack
12 15 (1.66%) REST
13 13 (1.44%) Apache Beam
14 12 (1.33%) Keras
14 12 (1.33%) RabbitMQ
14 12 (1.33%) RESTful
15 11 (1.22%) ActiveMQ
16 10 (1.11%) Great Expectations
Miscellaneous
1 70 (7.75%) Algorithms
2 62 (6.87%) Cyberattack
3 56 (6.20%) Product Ownership
4 48 (5.32%) Cloud Native
5 45 (4.98%) Data Structures
6 37 (4.10%) Self-Motivation
7 27 (2.99%) Greenfield Project
8 23 (2.55%) Linux Command Line
9 19 (2.10%) Hybrid Cloud
10 17 (1.88%) Distributed Systems
10 17 (1.88%) Management Information System
11 14 (1.55%) Public Cloud
12 11 (1.22%) Legacy Systems
13 10 (1.11%) Mobile App
14 9 (1.00%) Onboarding
15 8 (0.89%) Credit Risk
15 8 (0.89%) Renewable Energy
15 8 (0.89%) Taxonomies
16 7 (0.78%) Foreign Exchange (FX)
16 7 (0.78%) Reference Data
Operating Systems
1 62 (6.87%) Linux
2 12 (1.33%) Windows
3 9 (1.00%) Windows Server
4 6 (0.66%) Android
4 6 (0.66%) Apple iOS
4 6 (0.66%) CentOS
4 6 (0.66%) Red Hat Enterprise Linux
5 2 (0.22%) Unix
6 1 (0.11%) VMS
Processes & Methodologies
1 341 (37.76%) Analytics
2 314 (34.77%) ETL
3 312 (34.55%) Agile
4 266 (29.46%) Business Intelligence
4 266 (29.46%) Data Pipeline
5 226 (25.03%) Data Science
6 225 (24.92%) DevOps
7 224 (24.81%) Machine Learning
8 223 (24.70%) Data Modelling
9 183 (20.27%) CI/CD
10 175 (19.38%) Visualisation
11 144 (15.95%) Mentoring
12 132 (14.62%) Data Management
13 128 (14.17%) Problem-Solving
14 117 (12.96%) Software Engineering
15 109 (12.07%) Computer Science
16 108 (11.96%) Data Integration
17 103 (11.41%) Data Governance
18 102 (11.30%) Data Visualisation
19 98 (10.85%) Data Architecture
Programming Languages
1 487 (53.93%) Python
2 453 (50.17%) SQL
3 126 (13.95%) Java
4 67 (7.42%) JavaScript
5 56 (6.20%) T-SQL
6 51 (5.65%) Scala
7 44 (4.87%) Go
8 40 (4.43%) C#
9 37 (4.10%) R
10 33 (3.65%) Bash
11 24 (2.66%) Rust
12 23 (2.55%) Shell Script
13 21 (2.33%) PowerShell
14 16 (1.77%) C++
15 14 (1.55%) Data Analysis Expressions
15 14 (1.55%) TypeScript
16 13 (1.44%) MATLAB
17 7 (0.78%) Kusto Query Language
18 6 (0.66%) PL/SQL
19 5 (0.55%) PHP
Qualifications
1 149 (16.50%) Degree
2 128 (14.17%) Security Cleared
3 92 (10.19%) DV Cleared
4 73 (8.08%) Computer Science Degree
5 34 (3.77%) Master's Degree
6 30 (3.32%) AWS Certification
7 27 (2.99%) Azure Certification
8 26 (2.88%) SC Cleared
9 23 (2.55%) AWS Certified Cloud Practitioner
9 23 (2.55%) AWS Certified Developer
9 23 (2.55%) AWS Certified Solutions Architect
10 8 (0.89%) PhD
11 7 (0.78%) Microsoft Certification
12 6 (0.66%) OCP
12 6 (0.66%) Oracle Certification
13 3 (0.33%) AWS Certified DevOps Engineer
13 3 (0.33%) BPSS Clearance
14 2 (0.22%) ISTQB
14 2 (0.22%) MCSA
14 2 (0.22%) PMI Certification
Quality Assurance & Compliance
1 110 (12.18%) Data Quality
2 44 (4.87%) QA
3 17 (1.88%) GDPR
4 8 (0.89%) ISO/IEC 27001
5 6 (0.66%) Accessibility
6 2 (0.22%) Cyber Essentials
6 2 (0.22%) Cyber Essentials PLUS
7 1 (0.11%) California Consumer Privacy Act
7 1 (0.11%) GxP
7 1 (0.11%) HIPAA
7 1 (0.11%) Sarbanes-Oxley
7 1 (0.11%) SLA
System Software
1 98 (10.85%) Docker
2 7 (0.78%) HDFS
3 5 (0.55%) Active Directory
4 3 (0.33%) Apache Flume
Systems Management
1 108 (11.96%) Kubernetes
2 83 (9.19%) Terraform
3 19 (2.10%) Prometheus
4 18 (1.99%) Ansible
5 13 (1.44%) Puppet
6 11 (1.22%) Grafana
6 11 (1.22%) HAProxy
7 9 (1.00%) Kibana
8 8 (0.89%) Nagios
9 7 (0.78%) Oozie
10 5 (0.55%) Progress Chef
11 4 (0.44%) Microsoft Intune
12 2 (0.22%) Salt
13 1 (0.11%) Rancher
Vendors
1 168 (18.60%) Databricks
2 131 (14.51%) Microsoft
3 72 (7.97%) Google
4 49 (5.43%) Oracle
5 34 (3.77%) SAP
6 28 (3.10%) Informatica
7 18 (1.99%) Talend
8 14 (1.55%) Splunk
8 14 (1.55%) Teradata
9 13 (1.44%) Alteryx
10 11 (1.22%) Confluent
10 11 (1.22%) IBM
11 8 (0.89%) Dynatrace
11 8 (0.89%) New Relic
11 8 (0.89%) Veracode
12 6 (0.66%) Cloudera
12 6 (0.66%) MuleSoft
12 6 (0.66%) OpenAI
12 6 (0.66%) Red Hat
13 5 (0.55%) Facebook