Product Manager
UK > England
The median Product Manager salary in England is £70,774 per year, according to job vacancies posted during the 6 months leading to 31 May 2025.
The table below provides salary benchmarking and summary statistics, comparing them to the same period in the previous two years.
| 6 months to 31 May 2025 |
Same period 2024 | Same period 2023 | |
|---|---|---|---|
| Rank | 303 | 369 | 291 |
| Rank change year-on-year | +66 | -78 | -18 |
| Permanent jobs requiring a Product Manager | 483 | 615 | 1,041 |
| As % of all permanent jobs advertised in England | 0.98% | 0.68% | 1.22% |
| As % of the Job Titles category | 1.08% | 0.72% | 1.34% |
| Number of salaries quoted | 192 | 424 | 506 |
| 10th Percentile | £48,750 | £45,000 | £43,889 |
| 25th Percentile | £56,741 | £54,000 | £55,000 |
| Median annual salary (50th Percentile) | £70,774 | £70,000 | £67,500 |
| Median % change year-on-year | +1.11% | +3.70% | -3.57% |
| 75th Percentile | £86,250 | £82,500 | £81,250 |
| 90th Percentile | £95,000 | £96,750 | £95,625 |
| UK median annual salary | £70,047 | £70,000 | £67,500 |
| % change year-on-year | +0.07% | +3.70% | -3.57% |
All Permanent IT Job Vacancies
England
For comparison with the information above, the following table provides summary statistics for all permanent IT job vacancies in England. Most job vacancies include a discernible job title that can be normalized. As such, the figures in the second row provide an indication of the number of permanent jobs in our overall sample.
| Permanent vacancies in England with a recognized job title | 44,774 | 85,031 | 77,815 |
| % of permanent jobs with a recognized job title | 90.79% | 94.67% | 91.36% |
| Number of salaries quoted | 23,692 | 62,917 | 50,230 |
| 10th Percentile | £29,000 | £28,500 | £32,750 |
| 25th Percentile | £41,000 | £38,066 | £45,000 |
| Median annual salary (50th Percentile) | £56,000 | £52,500 | £60,567 |
| Median % change year-on-year | +6.67% | -13.32% | +0.95% |
| 75th Percentile | £75,000 | £71,250 | £81,250 |
| 90th Percentile | £96,250 | £90,000 | £100,000 |
| UK median annual salary | £55,000 | £52,500 | £60,000 |
| % change year-on-year | +4.76% | -12.50% | - |
Product Manager
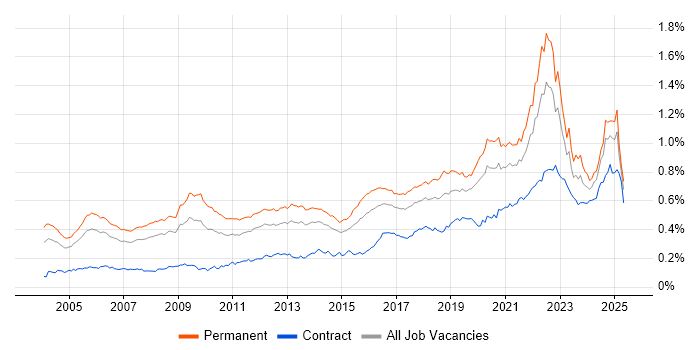
Job Vacancy Trend in England
Job postings that featured Product Manager in the job title as a proportion of all IT jobs advertised in England.

Product Manager
Salary Trend in England
3-month moving average salary quoted in jobs citing Product Manager in England.
Product Manager
Salary Histogram in England
Salary distribution for jobs citing Product Manager in England over the 6 months to 31 May 2025.
Product Manager
Job Locations in England
The table below looks at the demand and provides a guide to the median salaries quoted in IT jobs citing Product Manager within the England region over the 6 months to 31 May 2025. The 'Rank Change' column provides an indication of the change in demand within each location based on the same 6 month period last year.
| Location | Rank Change on Same Period Last Year |
Matching Permanent IT Job Ads |
Median Salary Past 6 Months |
Median Salary % Change on Same Period Last Year |
Live Jobs |
|---|---|---|---|---|---|
| North of England | +97 | 203 | £80,000 | +38.02% | 57 |
| London | +35 | 160 | £75,000 | -6.25% | 443 |
| Yorkshire | +117 | 100 | £78,750 | +21.15% | 18 |
| North East | +78 | 66 | £48,750 | -15.90% | 3 |
| South East | +38 | 45 | £60,000 | - | 32 |
| North West | -25 | 37 | £80,100 | +38.19% | 36 |
| South West | +70 | 32 | £60,000 | +4.35% | 19 |
| Midlands | +25 | 30 | £65,000 | +10.73% | 36 |
| West Midlands | +29 | 24 | £65,000 | +6.56% | 24 |
| East of England | +33 | 6 | £65,000 | +18.18% | 18 |
| East Midlands | +30 | 6 | £70,000 | +55.56% | 12 |
| Product Manager UK |
|||||
Product Manager Skill Set
Top 30 Co-occurring Skills and Capabilities in England
For the 6 months to 31 May 2025, Product Manager job roles required the following skills and capabilities in order of popularity. The figures indicate the absolute number co-occurrences and as a proportion of all permanent job ads across the England region featuring Product Manager in the job title.
|
|
Product Manager Skill Set
Co-occurring Skills and Capabilities in England by Category
The follow tables expand on the table above by listing co-occurrences grouped by category. The same employment type, locality and period is covered with up to 20 co-occurrences shown in each of the following categories:
|
|
|||||||||||||||||||||||||||||||||||||||||||||||||||||||||||||||||||||||||||||||||||||||||||||||||||
|
|
|||||||||||||||||||||||||||||||||||||||||||||||||||||||||||||||||||||||||||||||||||||||||||||||||||
|
|
|||||||||||||||||||||||||||||||||||||||||||||||||||||||||||||||||||||||||||||||||||||||||||||||||||
|
|
|||||||||||||||||||||||||||||||||||||||||||||||||||||||||||||||||||||||||||||||||||||||||||||||||||
|
|
|||||||||||||||||||||||||||||||||||||||||||||||||||||||||||||||||||||||||||||||||||||||||||||||||||
|
|
|||||||||||||||||||||||||||||||||||||||||||||||||||||||||||||||||||||||||||||||||||||||||||||||||||
|
|
|||||||||||||||||||||||||||||||||||||||||||||||||||||||||||||||||||||||||||||||||||||||||||||||||||
|
|
|||||||||||||||||||||||||||||||||||||||||||||||||||||||||||||||||||||||||||||||||||||||||||||||||||
