Cloud Computing Job Trends in England

Cloud Computing
UK > England

The table below provides summary statistics and salary benchmarking for jobs advertised in England requiring Cloud Computing skills. It covers permanent job vacancies from the 6 months leading up to 2 November 2025, with comparisons to the same periods in the previous two years.

6 months to
2 Nov 2025
Same period 2024 Same period 2023
Rank 421 333 286
Rank change year-on-year -88 -47 +2
Permanent jobs citing Cloud Computing 226 471 528
As % of all permanent jobs in England 0.52% 0.77% 1.09%
As % of the Cloud Services category 1.59% 2.35% 2.53%
Number of salaries quoted 143 218 394
10th Percentile £25,375 £30,000 £40,684
25th Percentile £26,125 £45,000 £51,250
Median annual salary (50th Percentile) £48,500 £67,500 £62,500
Median % change year-on-year -28.15% +8.00% -16.67%
75th Percentile £71,875 £88,438 £79,688
90th Percentile £98,500 £125,000 £107,000
UK median annual salary £48,122 £69,308 £62,500
% change year-on-year -30.57% +10.89% -16.67%

All Cloud Skills
England

Cloud Computing falls under the Cloud Services category. For comparison with the information above, the following table provides summary statistics for all permanent job vacancies requiring cloud computing skills in England.

Permanent vacancies with a requirement for cloud computing skills 14,226 20,053 20,879
As % of all permanent jobs advertised in England 32.66% 32.90% 43.28%
Number of salaries quoted 9,997 12,149 17,496
10th Percentile £28,750 £36,200 £32,750
25th Percentile £37,500 £47,500 £45,975
Median annual salary (50th Percentile) £57,500 £65,000 £62,500
Median % change year-on-year -11.54% +4.00% -3.10%
75th Percentile £80,000 £83,750 £82,500
90th Percentile £100,000 £105,000 £101,185
UK median annual salary £57,500 £65,000 £62,500
% change year-on-year -11.54% +4.00% -

Cloud Computing
Job Vacancy Trend in England

Historical trend showing the proportion of permanent IT job postings citing Cloud Computing relative to all permanent IT jobs advertised in England.
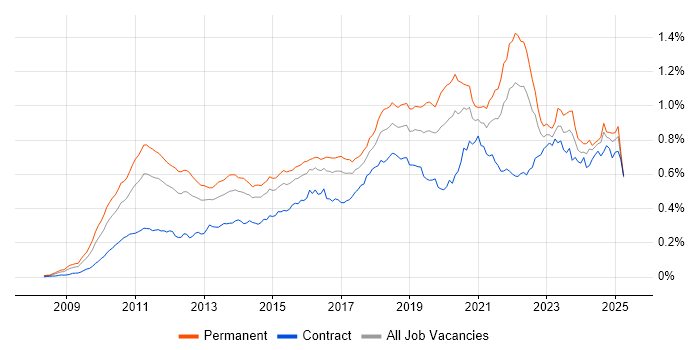
Cloud Computing job vacancy trend in England

Cloud Computing
Salary Trend in England

Salary distribution trend for jobs in England citing Cloud Computing.

Salary distribution trend for jobs in England citing Cloud Computing

Cloud Computing
Salary Histogram in England

Salary distribution for jobs citing Cloud Computing in England over the 6 months to 2 November 2025.

Salary histogram for Cloud Computing in England

Cloud Computing
Job Locations in England

The table below looks at the demand and provides a guide to the median salaries quoted in IT jobs citing Cloud Computing within the England region over the 6 months to 2 November 2025. The 'Rank Change' column provides an indication of the change in demand within each location based on the same 6 month period last year.

Location Rank Change
on Same Period
Last Year
Matching
Permanent
IT Job Ads
Median Salary
Past 6 Months
Median Salary
% Change
on Same Period
Last Year
Live
Jobs
London -34 107 £77,500 +1.97% 121
South East +19 47 £29,000 -48.68% 107
North of England -8 31 £50,000 -14.89% 36
Midlands +22 23 £25,750 -62.85% 23
North West -8 23 £48,000 +6.67% 22
West Midlands +32 16 £53,450 -22.88% 12
South West +12 12 £27,000 -36.84% 17
East of England +20 8 £52,500 -16.00% 31
East Midlands +17 7 £25,750 -57.79% 11
North East +8 7 £62,500 -3.33% 4
Yorkshire +6 1 £110,000 +64.18% 10
Cloud Computing
UK

Cloud Computing
Co-Occurring Skills & Capabilities in England by Category

The following tables expand on the one above by listing co-occurrences grouped by category. They cover the same employment type, locality and period, with up to 20 co-occurrences shown in each category:

Application Platforms
1 18 (7.96%) SharePoint
2 5 (2.21%) Microsoft Exchange
2 5 (2.21%) WordPress
3 4 (1.77%) Apache
4 1 (0.44%) Confluence
4 1 (0.44%) OpenStack
Applications
1 14 (6.19%) Maya
1 14 (6.19%) Microsoft Excel
2 1 (0.44%) Microsoft Office
Business Applications
1 5 (2.21%) Payment Gateway
2 1 (0.44%) Fidessa
Cloud Services
1 77 (34.07%) Azure
2 57 (25.22%) AWS
3 35 (15.49%) GCP
4 33 (14.60%) Microsoft 365
5 22 (9.73%) Entra ID
6 17 (7.52%) SaaS
7 13 (5.75%) Serverless
8 12 (5.31%) Power Platform
9 10 (4.42%) GitHub
10 9 (3.98%) Amazon S3
10 9 (3.98%) AWS Lambda
11 8 (3.54%) Amazon EC2
11 8 (3.54%) AWS CloudFormation
11 8 (3.54%) Mimecast
11 8 (3.54%) PaaS
12 7 (3.10%) Azure DevOps
13 6 (2.65%) Dynamics 365
13 6 (2.65%) OneDrive
13 6 (2.65%) Power Automate
14 4 (1.77%) dbt
Communications & Networking
1 22 (9.73%) Firewall
2 17 (7.52%) Internet
3 12 (5.31%) DHCP
4 11 (4.87%) DNS
5 9 (3.98%) Network Security
6 7 (3.10%) LAN
6 7 (3.10%) Wi-Fi
7 5 (2.21%) WAN
7 5 (2.21%) Wireless
8 4 (1.77%) TCP/IP
8 4 (1.77%) VLAN
9 3 (1.33%) NGFW
10 2 (0.88%) Intrusion Detection
10 2 (0.88%) VPN
11 1 (0.44%) DMARC
11 1 (0.44%) FIX Connectivity
11 1 (0.44%) HTTP
11 1 (0.44%) SD-WAN
11 1 (0.44%) VoIP
Database & Business Intelligence
1 20 (8.85%) Big Data
2 10 (4.42%) SQL Server
3 9 (3.98%) Data Warehouse
3 9 (3.98%) Power BI
4 8 (3.54%) Amazon RDS
4 8 (3.54%) DynamoDB
5 7 (3.10%) NoSQL
6 4 (1.77%) Amazon Athena
6 4 (1.77%) Apache Iceberg
7 3 (1.33%) Data Vault
7 3 (1.33%) GIS
7 3 (1.33%) MySQL
8 2 (0.88%) SQL Server Integration Services
9 1 (0.44%) Apache Cassandra
9 1 (0.44%) Azure SQL Database
9 1 (0.44%) MongoDB
9 1 (0.44%) PostgreSQL
9 1 (0.44%) Snowflake Schema
9 1 (0.44%) SQL Server Reporting Services
9 1 (0.44%) Tableau
Development Applications
1 9 (3.98%) GitLab
2 8 (3.54%) Git
3 7 (3.10%) Jenkins
4 4 (1.77%) CircleCI
5 2 (0.88%) Artifactory
5 2 (0.88%) JIRA
6 1 (0.44%) Cucumber
6 1 (0.44%) JMeter
6 1 (0.44%) PowerBuilder
General
1 88 (38.94%) Social Skills
2 83 (36.73%) Finance
3 46 (20.35%) Banking
4 38 (16.81%) Analytical Skills
4 38 (16.81%) Law
5 32 (14.16%) Inclusion and Diversity
6 15 (6.64%) Games
7 12 (5.31%) Marketing
8 11 (4.87%) Legal
9 10 (4.42%) Dutch Language
9 10 (4.42%) French Language
10 7 (3.10%) Public Sector
11 6 (2.65%) Telecoms
12 5 (2.21%) Manufacturing
12 5 (2.21%) Presentation Skills
13 4 (1.77%) Financial Institution
13 4 (1.77%) Local Government
14 3 (1.33%) Investment Banking
15 2 (0.88%) Retail
15 2 (0.88%) Retail Banking
Job Titles
1 26 (11.50%) Senior
2 23 (10.18%) Architect
3 22 (9.73%) Developer
3 22 (9.73%) IT Support
4 17 (7.52%) Consultant
5 16 (7.08%) Solutions Architect
6 14 (6.19%) Accountant
6 14 (6.19%) Financial Accountant
7 13 (5.75%) Support Engineer
8 11 (4.87%) Azure Engineer
8 11 (4.87%) Cloud Engineer
8 11 (4.87%) IT Engineer
8 11 (4.87%) Senior Architect
8 11 (4.87%) Senior Solutions Architect
9 10 (4.42%) Analyst
9 10 (4.42%) Infrastructure Engineer
9 10 (4.42%) Lecturer
10 9 (3.98%) IT Manager
11 8 (3.54%) IT Services Manager
11 8 (3.54%) SQL Developer
Libraries, Frameworks & Software Standards
1 12 (5.31%) .NET
2 9 (3.98%) HTML
2 9 (3.98%) React
3 7 (3.10%) AngularJS
3 7 (3.10%) CSS
3 7 (3.10%) Kafka
3 7 (3.10%) REST
4 6 (2.65%) Node.js
5 5 (2.21%) ASP.NET
5 5 (2.21%) GraphQL
5 5 (2.21%) Vue
6 4 (1.77%) Bootstrap
6 4 (1.77%) CSS3
6 4 (1.77%) HTML5
6 4 (1.77%) Material-UI
6 4 (1.77%) OAuth
6 4 (1.77%) RabbitMQ
6 4 (1.77%) RESTful
6 4 (1.77%) SAML
6 4 (1.77%) Tailwind CSS
Miscellaneous
1 38 (16.81%) Data Centre
2 30 (13.27%) Management Information System
2 30 (13.27%) Social Media
3 19 (8.41%) Blockchain
4 17 (7.52%) Enterprise Software
5 14 (6.19%) Onboarding
5 14 (6.19%) Social Network
6 12 (5.31%) IoT
6 12 (5.31%) Video Conferencing
7 11 (4.87%) Distributed Computing
8 10 (4.42%) Cloud Native
8 10 (4.42%) LIMS
9 7 (3.10%) Hybrid Cloud
9 7 (3.10%) Product Ownership
10 6 (2.65%) Analytical Mindset
10 6 (2.65%) EPoS
10 6 (2.65%) NHS
11 4 (1.77%) Driving Licence
11 4 (1.77%) Media Streaming
11 4 (1.77%) Spread Betting
Operating Systems
1 30 (13.27%) Windows
2 12 (5.31%) Windows 10
2 12 (5.31%) Windows Server
3 8 (3.54%) Linux
4 3 (1.33%) Windows Server 2019
5 2 (0.88%) Ubuntu
5 2 (0.88%) Unix
6 1 (0.44%) CentOS
6 1 (0.44%) Solaris
6 1 (0.44%) Windows Server 2008
6 1 (0.44%) Windows Server 2012
6 1 (0.44%) Windows Server 2016
Processes & Methodologies
1 70 (30.97%) Cybersecurity
2 63 (27.88%) Problem-Solving
3 56 (24.78%) AI
4 54 (23.89%) Agile
5 43 (19.03%) Customer Service
6 39 (17.26%) Containerisation
7 37 (16.37%) DevOps
8 36 (15.93%) Mentoring
9 35 (15.49%) Project Management
10 31 (13.72%) CI/CD
11 30 (13.27%) Infrastructure as Code
12 28 (12.39%) Analytics
12 28 (12.39%) Machine Learning
13 27 (11.95%) Risk Management
14 26 (11.50%) Continuous Improvement
14 26 (11.50%) Microservices
15 24 (10.62%) Computer Science
16 23 (10.18%) Data Security
17 22 (9.73%) Decision-Making
17 22 (9.73%) Software Engineering
Programming Languages
1 28 (12.39%) Python
2 27 (11.95%) SQL
3 25 (11.06%) PowerShell
4 15 (6.64%) C#
5 14 (6.19%) JavaScript
6 11 (4.87%) Java
7 6 (2.65%) PHP
8 4 (1.77%) C++
8 4 (1.77%) Go
9 3 (1.33%) ANSI SQL
10 2 (0.88%) Bash
10 2 (0.88%) Bicep
10 2 (0.88%) TypeScript
11 1 (0.44%) Perl
11 1 (0.44%) Scala
11 1 (0.44%) T-SQL
Qualifications
1 70 (30.97%) Degree
2 20 (8.85%) Computer Science Degree
3 16 (7.08%) Azure Certification
4 15 (6.64%) AWS Certification
5 14 (6.19%) ACCA
6 13 (5.75%) AWS Certified Solutions Architect
6 13 (5.75%) Master's Degree
7 10 (4.42%) PhD
7 10 (4.42%) Postgraduate
8 8 (3.54%) Security Cleared
9 7 (3.10%) SC Cleared
10 6 (2.65%) A+ Certification
11 5 (2.21%) CISSP
11 5 (2.21%) Microsoft Certification
12 4 (1.77%) AWS Certified Developer
12 4 (1.77%) PMI Certification
12 4 (1.77%) PMP
13 3 (1.33%) Cisco Certification
13 3 (1.33%) FFIEC
13 3 (1.33%) TOGAF Certification
Quality Assurance & Compliance
1 14 (6.19%) GAAP
2 11 (4.87%) IFRS
2 11 (4.87%) NIST
3 10 (4.42%) GLP
4 9 (3.98%) ISO/IEC 27001
5 7 (3.10%) Cyber Essentials
5 7 (3.10%) GDPR
6 6 (2.65%) Cyber Essentials PLUS
7 4 (1.77%) QA
8 2 (0.88%) COBIT
8 2 (0.88%) SOC 2
9 1 (0.44%) Accessibility
9 1 (0.44%) Data Quality
9 1 (0.44%) EU AI Act
9 1 (0.44%) Government Security Classifications
9 1 (0.44%) HIPAA
System Software
1 29 (12.83%) Active Directory
2 12 (5.31%) Docker
3 10 (4.42%) Firmware
4 6 (2.65%) VMware Infrastructure
5 4 (1.77%) Hyper-V
6 1 (0.44%) Dovecot
6 1 (0.44%) KVM
6 1 (0.44%) Postfix
6 1 (0.44%) QEMU
6 1 (0.44%) Virtual Machines
6 1 (0.44%) VMware ESXi
6 1 (0.44%) vSphere
Systems Management
1 31 (13.72%) Terraform
2 24 (10.62%) Kubernetes
3 17 (7.52%) Microsoft Intune
4 14 (6.19%) Ansible
4 14 (6.19%) SCCM
5 6 (2.65%) Prometheus
6 3 (1.33%) Grafana
6 3 (1.33%) Single Sign-On
7 2 (0.88%) Progress Chef
7 2 (0.88%) Sysdig
8 1 (0.44%) CASB
8 1 (0.44%) CSIRT
8 1 (0.44%) Kibana
8 1 (0.44%) QRadar
8 1 (0.44%) VxRail
Vendors
1 47 (20.80%) Microsoft
2 13 (5.75%) Cisco
3 12 (5.31%) Google
4 10 (4.42%) Oracle
5 7 (3.10%) Palo Alto
5 7 (3.10%) ServiceNow
5 7 (3.10%) VMware
6 6 (2.65%) Sophos
6 6 (2.65%) Splunk
7 5 (2.21%) Juniper
7 5 (2.21%) Ping Identity
8 4 (1.77%) Gigya
8 4 (1.77%) PayPal
9 3 (1.33%) Dell
9 3 (1.33%) Okta
10 2 (0.88%) Citrix
10 2 (0.88%) Duck Creek
10 2 (0.88%) ForgeRock
10 2 (0.88%) Guidewire
10 2 (0.88%) Red Hat