NHS Jobs in England

National Health Service (NHS)
UK > England

The table below looks at the prevalence of the term NHS in permanent job vacancies in England. Included is a benchmarking guide to the salaries offered in vacancies that cited NHS over the 6 months leading up to 31 May 2025, comparing them to the same period in the previous two years.

6 months to
31 May 2025
Same period 2024 Same period 2023
Rank 419 383 422
Rank change year-on-year -36 +39 -90
Permanent jobs citing NHS 275 590 620
As % of all permanent jobs advertised in England 0.56% 0.66% 0.73%
As % of the Miscellaneous category 1.48% 1.94% 1.65%
Number of salaries quoted 117 454 456
10th Percentile £31,250 £30,000 £30,500
25th Percentile £39,929 £37,500 £41,250
Median annual salary (50th Percentile) £57,500 £47,500 £51,525
Median % change year-on-year +21.05% -7.81% +2.96%
75th Percentile £65,000 £62,500 £65,000
90th Percentile £80,000 £74,769 £80,625
UK median annual salary £57,500 £50,000 £51,550
% change year-on-year +15.00% -3.01% +2.75%

All Generic Skills
England

NHS falls under the General and Transferable Skills category. For comparison with the information above, the following table provides summary statistics for all permanent job vacancies requiring generic IT skills in England.

Permanent vacancies with a requirement for generic IT skills 18,639 30,336 37,575
As % of all permanent jobs advertised in England 37.80% 33.77% 44.12%
Number of salaries quoted 8,618 20,935 20,403
10th Percentile £30,940 £28,000 £36,000
25th Percentile £42,000 £38,000 £46,686
Median annual salary (50th Percentile) £60,000 £55,000 £65,000
Median % change year-on-year +9.09% -15.38% +4.00%
75th Percentile £80,000 £75,000 £87,500
90th Percentile £110,000 £100,000 £110,000
UK median annual salary £60,000 £55,000 £65,000
% change year-on-year +9.09% -15.38% +4.00%

NHS
Job Vacancy Trend in England

Job postings citing NHS as a proportion of all IT jobs advertised in England.
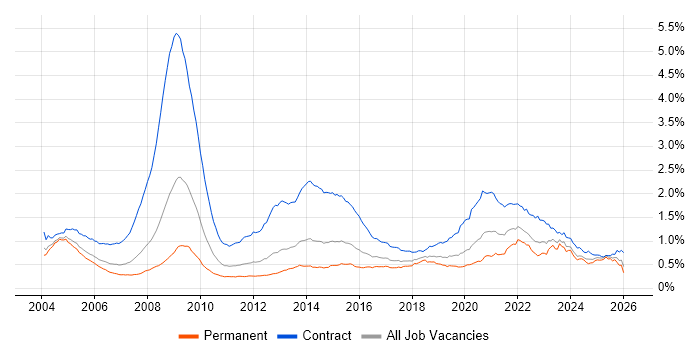
Job vacancy trend for NHS in England

NHS
Salary Trend in England

3-month moving average salary quoted in jobs citing NHS in England.

Salary trend for NHS in England

NHS
Salary Histogram in England

Salary distribution for jobs citing NHS in England over the 6 months to 31 May 2025.

Salary histogram for NHS in England

NHS
Job Locations in England

The table below looks at the demand and provides a guide to the median salaries quoted in IT jobs citing NHS within the England region over the 6 months to 31 May 2025. The 'Rank Change' column provides an indication of the change in demand within each location based on the same 6 month period last year.

Location Rank Change
on Same Period
Last Year
Matching
Permanent
IT Job Ads
Median Salary
Past 6 Months
Median Salary
% Change
on Same Period
Last Year
Live
Jobs
North of England -47 88 £32,500 -22.62% 118
London +54 65 £57,500 - 206
South East +5 42 £70,000 +40.00% 62
North East +51 33 - - 31
East of England +47 33 £60,000 +100.00% 42
North West -41 33 £32,500 -18.75% 50
Midlands +10 23 £60,000 +12.15% 62
Yorkshire -3 22 £47,500 +8.59% 41
West Midlands +4 15 £73,750 +37.85% 25
East Midlands +43 8 £60,000 +23.71% 36
South West +76 6 £42,500 +7.59% 36
NHS
UK

NHS
Co-occurring Skills and Capabilities in England by Category

The follow tables expand on the table above by listing co-occurrences grouped by category. The same employment type, locality and period is covered with up to 20 co-occurrences shown in each of the following categories:

Application Platforms
1 18 (6.55%) CMS
2 17 (6.18%) Umbraco
3 3 (1.09%) Confluence
3 3 (1.09%) SharePoint
4 2 (0.73%) ArcGIS
5 1 (0.36%) Apache Airflow
5 1 (0.36%) WordPress
Applications
1 14 (5.09%) Microsoft Office
2 13 (4.73%) Microsoft Excel
3 4 (1.45%) AutoCAD
4 3 (1.09%) Microsoft PowerPoint
4 3 (1.09%) MS Visio
5 2 (0.73%) Adobe Creative Suite
5 2 (0.73%) Adobe Illustrator
Business Applications
1 1 (0.36%) Dynamics NAV
1 1 (0.36%) Lorenzo
1 1 (0.36%) NetSuite
1 1 (0.36%) SystmOne
Cloud Services
1 98 (35.64%) Azure
2 90 (32.73%) Entra ID
3 41 (14.91%) AWS
4 28 (10.18%) Power Platform
5 19 (6.91%) SaaS
6 16 (5.82%) Azure DevOps
6 16 (5.82%) Azure Monitor
7 15 (5.45%) Azure AI
7 15 (5.45%) Azure ExpressRoute
7 15 (5.45%) Azure Key Vault
7 15 (5.45%) Azure Service Bus
7 15 (5.45%) IaaS
7 15 (5.45%) PaaS
7 15 (5.45%) Power Automate
8 5 (1.82%) Google Workspace
8 5 (1.82%) Microsoft 365
9 2 (0.73%) GCP
9 2 (0.73%) Slack
10 1 (0.36%) PowerApps
10 1 (0.36%) Serverless
Communications & Networking
1 19 (6.91%) WAN
2 17 (6.18%) Intranet
2 17 (6.18%) VPN
3 16 (5.82%) DNS
3 16 (5.82%) Firewall
4 15 (5.45%) SD-WAN
5 5 (1.82%) SSL
6 4 (1.45%) 4G
6 4 (1.45%) 5G
6 4 (1.45%) Unified Communications
7 3 (1.09%) Broadband
7 3 (1.09%) Internet
8 2 (0.73%) WPA
9 1 (0.36%) Cisco IOS
9 1 (0.36%) DHCP
9 1 (0.36%) IOS XR
9 1 (0.36%) MPLS
9 1 (0.36%) Software-Defined Networking
9 1 (0.36%) TCP/IP
9 1 (0.36%) VoIP
Database & Business Intelligence
1 34 (12.36%) MySQL
2 23 (8.36%) SQL Server
3 22 (8.00%) Power BI
4 19 (6.91%) Electronic Patient Records
5 16 (5.82%) Data Lake
6 4 (1.45%) Data Warehouse
7 3 (1.09%) PostgreSQL
7 3 (1.09%) SQL Server Reporting Services
7 3 (1.09%) Tableau
8 2 (0.73%) Data Mining
8 2 (0.73%) QlikView
8 2 (0.73%) SQL Server Integration Services
9 1 (0.36%) Airbyte
9 1 (0.36%) Metadata
9 1 (0.36%) MS Access
9 1 (0.36%) Qlik Sense
9 1 (0.36%) Relational Database
Development Applications
1 16 (5.82%) Git
2 4 (1.45%) JIRA
3 2 (0.73%) Jenkins
4 1 (0.36%) Balsamiq
4 1 (0.36%) Gatling
4 1 (0.36%) GitLab
4 1 (0.36%) JMeter
4 1 (0.36%) Locust
4 1 (0.36%) Postman
4 1 (0.36%) Rational Rhapsody
4 1 (0.36%) Robot Framework
4 1 (0.36%) SoapUI
4 1 (0.36%) Team Foundation Server
4 1 (0.36%) Visual Studio
General
1 81 (29.45%) Social Skills
2 42 (15.27%) Public Sector
3 23 (8.36%) Health Technology
4 20 (7.27%) Finance
5 19 (6.91%) Analytical Skills
6 17 (6.18%) Local Government
6 17 (6.18%) Marketing
7 13 (4.73%) Inclusion and Diversity
7 13 (4.73%) Pharmaceutical
8 12 (4.36%) Legal
9 7 (2.55%) Tech for Good
10 6 (2.18%) Games
10 6 (2.18%) Law
11 5 (1.82%) Digital Health
11 5 (1.82%) Digital Healthcare
11 5 (1.82%) Organisational Skills
12 4 (1.45%) Advertising
12 4 (1.45%) Influencing Skills
12 4 (1.45%) Presentation Skills
12 4 (1.45%) Telecoms
Job Titles
1 72 (26.18%) Technology Specialist
2 39 (14.18%) Identity Management Specialist
3 28 (10.18%) Lead
4 23 (8.36%) Developer
5 21 (7.64%) Senior
6 17 (6.18%) Umbraco Developer
7 15 (5.45%) Architect
7 15 (5.45%) Cloud Architect
8 13 (4.73%) Analyst
8 13 (4.73%) Civil Engineer
8 13 (4.73%) Development Engineer
8 13 (4.73%) Infrastructure Engineer
9 10 (3.64%) Consultant
9 10 (3.64%) Principal Engineer
9 10 (3.64%) Product Manager
10 9 (3.27%) IT Support
11 7 (2.55%) Sales Executive
12 6 (2.18%) Integration Specialist
12 6 (2.18%) Project Manager
13 5 (1.82%) Support Officer
Libraries, Frameworks & Software Standards
1 35 (12.73%) jQuery
2 22 (8.00%) HTML
3 21 (7.64%) CSS
3 21 (7.64%) React
4 19 (6.91%) HTML5
5 17 (6.18%) Ruby on Rails
6 9 (3.27%) Lightning Web Components
7 8 (2.91%) FHIR
8 4 (1.45%) .NET
9 3 (1.09%) Vue
10 2 (0.73%) .NET Core
10 2 (0.73%) AngularJS
10 2 (0.73%) ASP.NET
10 2 (0.73%) JSON
10 2 (0.73%) XML
11 1 (0.36%) Django
11 1 (0.36%) EDI
11 1 (0.36%) Symfony
11 1 (0.36%) Web Services
11 1 (0.36%) YAML
Miscellaneous
1 18 (6.55%) Data Centre
2 10 (3.64%) Management Information System
3 9 (3.27%) Housing Association
3 9 (3.27%) PACS
3 9 (3.27%) Self-Motivation
4 7 (2.55%) Social Media
5 5 (1.82%) Blog
6 4 (1.45%) Cloud Native
6 4 (1.45%) Digital Media
6 4 (1.45%) IoT
6 4 (1.45%) Legacy Systems
6 4 (1.45%) Onboarding
6 4 (1.45%) Operational Technology
7 3 (1.09%) Driving Licence
8 2 (0.73%) Algorithms
8 2 (0.73%) ASTM
8 2 (0.73%) Enterprise Software
8 2 (0.73%) Legacy Applications
8 2 (0.73%) Renewable Energy
8 2 (0.73%) Tandem
Operating Systems
1 11 (4.00%) Windows
2 7 (2.55%) Linux
3 2 (0.73%) Ubuntu
4 1 (0.36%) Android
4 1 (0.36%) Apple iOS
4 1 (0.36%) Unix
4 1 (0.36%) Windows Server
Processes & Methodologies
1 97 (35.27%) ITIL
2 72 (26.18%) Identity Management
3 40 (14.55%) Problem-Solving
3 40 (14.55%) Roadmaps
4 32 (11.64%) Project Management
5 31 (11.27%) Analytics
5 31 (11.27%) Mentoring
6 29 (10.55%) Artificial Intelligence
7 27 (9.82%) Agile
8 25 (9.09%) Migration
9 24 (8.73%) Project Delivery
9 24 (8.73%) Software Engineering
9 24 (8.73%) Stakeholder Management
10 23 (8.36%) Decision-Making
11 22 (8.00%) CI/CD
11 22 (8.00%) DevOps
12 21 (7.64%) Business Development
13 20 (7.27%) Continuous Improvement
13 20 (7.27%) Customer Requirements
14 19 (6.91%) Product Roadmap
Programming Languages
1 49 (17.82%) SQL
2 21 (7.64%) C#
3 18 (6.55%) Ruby
4 17 (6.18%) PowerShell
5 15 (5.45%) Bicep
6 12 (4.36%) Python
7 11 (4.00%) JavaScript
8 5 (1.82%) Java
9 3 (1.09%) Bash
10 2 (0.73%) PHP
10 2 (0.73%) R
10 2 (0.73%) T-SQL
11 1 (0.36%) C
11 1 (0.36%) TypeScript
11 1 (0.36%) VB.NET
Qualifications
1 127 (46.18%) Degree
2 95 (34.55%) DBS Check
3 15 (5.45%) Azure Certification
4 12 (4.36%) Security Cleared
5 11 (4.00%) SC Cleared
6 8 (2.91%) Postgraduate
7 7 (2.55%) HNC
8 3 (1.09%) HND
9 1 (0.36%) BPSS Clearance
9 1 (0.36%) Chartered Engineer
9 1 (0.36%) CISSP
9 1 (0.36%) CompTIA Security+
9 1 (0.36%) Computer Science Degree
9 1 (0.36%) ISTQB
9 1 (0.36%) ISTQB Foundation Certification
9 1 (0.36%) Master's Degree
9 1 (0.36%) PhD
9 1 (0.36%) PMI Certification
9 1 (0.36%) PMP
Quality Assurance & Compliance
1 33 (12.00%) Accessibility
2 23 (8.36%) GDPR
3 18 (6.55%) WCAG
4 15 (5.45%) QA
5 7 (2.55%) HL7
6 6 (2.18%) SNOMED CT
7 4 (1.45%) ISO/IEC 27001
8 3 (1.09%) DICOM
9 1 (0.36%) Data Quality
9 1 (0.36%) ISO 13485
9 1 (0.36%) ISO 9001
System Software
1 73 (26.55%) Active Directory
2 15 (5.45%) Virtual Machines
3 1 (0.36%) BitLocker
3 1 (0.36%) Hyper-V
3 1 (0.36%) VMware Infrastructure
Systems Management
1 15 (5.45%) Single Sign-On
2 3 (1.09%) Ansible
2 3 (1.09%) Kubernetes
2 3 (1.09%) SCCM
2 3 (1.09%) Terraform
Vendors
1 109 (39.64%) Microsoft
2 17 (6.18%) HP
3 15 (5.45%) Databricks
3 15 (5.45%) Meraki
4 10 (3.64%) Salesforce
5 8 (2.91%) Google
6 4 (1.45%) Oracle
7 3 (1.09%) Cerner
7 3 (1.09%) Siemens
7 3 (1.09%) TOWER Software
8 2 (0.73%) Adobe
8 2 (0.73%) Cisco
8 2 (0.73%) Facebook
8 2 (0.73%) Tenable
9 1 (0.36%) Foundry
9 1 (0.36%) MEDITECH
9 1 (0.36%) Monzo
9 1 (0.36%) Nexthink
9 1 (0.36%) Palantir
9 1 (0.36%) Splunk