Enterprise Software Jobs in England

Enterprise Application Software
UK > England

The table below looks at the prevalence of the term Enterprise Software in permanent job vacancies in England. Included is a benchmarking guide to the salaries offered in vacancies that cited Enterprise Software over the 6 months leading up to 26 July 2024, comparing them to the same period in the previous two years.

6 months to
26 Jul 2024
Same period 2023 Same period 2022
Rank 367 334 288
Rank change year-on-year -33 -46 +2
Permanent jobs citing Enterprise Software 537 681 2,145
As % of all permanent jobs advertised in England 0.69% 0.96% 1.46%
As % of the Miscellaneous category 2.08% 2.30% 3.08%
Number of salaries quoted 358 562 1,025
10th Percentile £38,925 £44,525 £42,500
25th Percentile £46,199 £54,063 £51,250
Median annual salary (50th Percentile) £62,783 £67,500 £65,000
Median % change year-on-year -6.99% +3.85% -
75th Percentile £83,750 £88,750 £87,500
90th Percentile £98,250 £105,000 £107,500
UK median annual salary £60,000 £65,000 £65,000
% change year-on-year -7.69% - -

All Generic Skills
England

Enterprise Software falls under the General and Transferable Skills category. For comparison with the information above, the following table provides summary statistics for all permanent job vacancies requiring generic IT skills in England.

Permanent vacancies with a requirement for generic IT skills 25,806 29,571 69,564
As % of all permanent jobs advertised in England 32.93% 41.60% 47.31%
Number of salaries quoted 16,283 18,664 32,310
10th Percentile £30,000 £35,408 £34,506
25th Percentile £40,523 £46,570 £46,000
Median annual salary (50th Percentile) £56,124 £65,000 £62,500
Median % change year-on-year -13.66% +4.00% +4.17%
75th Percentile £78,750 £85,000 £85,000
90th Percentile £102,500 £110,000 £105,000
UK median annual salary £55,000 £64,000 £62,500
% change year-on-year -14.06% +2.40% +4.17%

Enterprise Software
Job Vacancy Trend in England

Job postings citing Enterprise Software as a proportion of all IT jobs advertised in England.
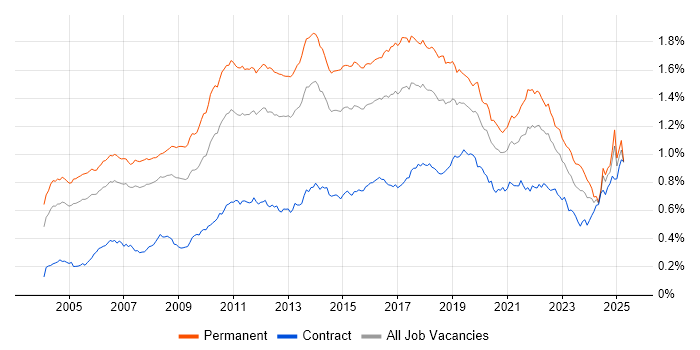
Job vacancy trend for Enterprise Software in England

Enterprise Software
Salary Trend in England

3-month moving average salary quoted in jobs citing Enterprise Software in England.

Salary trend for Enterprise Software in England

Enterprise Software
Salary Histogram in England

Salary distribution for jobs citing Enterprise Software in England over the 6 months to 26 July 2024.

Salary histogram for Enterprise Software in England

Enterprise Software
Job Locations in England

The table below looks at the demand and provides a guide to the median salaries quoted in IT jobs citing Enterprise Software within the England region over the 6 months to 26 July 2024. The 'Rank Change' column provides an indication of the change in demand within each location based on the same 6 month period last year.

Location Rank Change
on Same Period
Last Year
Matching
Permanent
IT Job Ads
Median Salary
Past 6 Months
Median Salary
% Change
on Same Period
Last Year
Live
Jobs
London -9 166 £80,000 - 26
South East -4 149 £53,000 -7.83% 20
North of England +1 92 £62,500 +8.70% 20
Midlands +12 81 £57,500 +9.52% 6
North West -19 57 £62,783 +0.45% 13
West Midlands +22 51 £70,000 -1.75% 3
East Midlands -18 30 £48,750 -2.50% 3
Yorkshire +53 29 £60,000 +9.09% 5
East of England -16 26 £56,250 -6.25% 6
South West -5 19 £47,500 -17.39% 4
North East - 6 £59,500 - 3
Enterprise Software
UK

Enterprise Software
Co-occurring Skills and Capabilities in England by Category

The follow tables expand on the table above by listing co-occurrences grouped by category. The same employment type, locality and period is covered with up to 20 co-occurrences shown in each of the following categories:

Application Platforms
1 30 (5.59%) WebLogic
2 19 (3.54%) Apache
3 16 (2.98%) Microsoft Exchange
4 14 (2.61%) SharePoint
5 12 (2.23%) Confluence
6 3 (0.56%) CMS
6 3 (0.56%) IBM Notes
7 2 (0.37%) Adobe Experience Manager
7 2 (0.37%) GlassFish
7 2 (0.37%) IIS
7 2 (0.37%) JCAPS
7 2 (0.37%) Magnolia
7 2 (0.37%) Oracle SOA Suite
7 2 (0.37%) WebSphere
7 2 (0.37%) WebSphere Application Server
8 1 (0.19%) Headless CMS
8 1 (0.19%) Moodle
8 1 (0.19%) SAS
8 1 (0.19%) Tomcat
Applications
1 23 (4.28%) Microsoft Office
2 17 (3.17%) Microsoft Excel
3 7 (1.30%) Siemens NX
4 6 (1.12%) MS Visio
5 1 (0.19%) Chatbot
5 1 (0.19%) Microsoft Project
5 1 (0.19%) Revit
Business Applications
1 36 (6.70%) Siebel CRM
2 28 (5.21%) Sparx Enterprise Architect
3 8 (1.49%) Dynamics CRM
3 8 (1.49%) Oracle EBS
3 8 (1.49%) Oracle ERP
3 8 (1.49%) PeopleSoft HCM
3 8 (1.49%) Teamcenter
4 4 (0.74%) Elite 3E
4 4 (0.74%) Primavera
4 4 (0.74%) SAP Hybris
5 3 (0.56%) Dynamics AX
5 3 (0.56%) Oracle Payables
5 3 (0.56%) Oracle Receivables
5 3 (0.56%) SAP ERP
5 3 (0.56%) Workday HCM
6 2 (0.37%) NetSuite
6 2 (0.37%) Oracle Assets
6 2 (0.37%) Oracle EBS R12
6 2 (0.37%) Oracle General Ledger
6 2 (0.37%) Temenos T24
Cloud Services
1 147 (27.37%) Azure
2 140 (26.07%) AWS
3 57 (10.61%) SaaS
4 36 (6.70%) Power Platform
5 28 (5.21%) Amazon EKS
5 28 (5.21%) Amazon SQS
5 28 (5.21%) Azure DevOps
6 26 (4.84%) Microsoft 365
7 21 (3.91%) Entra ID
8 18 (3.35%) Dynamics 365
8 18 (3.35%) PaaS
9 15 (2.79%) IaaS
10 11 (2.05%) Azure Data Factory
10 11 (2.05%) GitHub
11 10 (1.86%) Azure Data Lake Analytics
11 10 (1.86%) Azure Synapse Analytics
12 9 (1.68%) OCI
13 8 (1.49%) Azure Key Vault
14 7 (1.30%) AWS KMS
14 7 (1.30%) Smartsheet
Communications & Networking
1 51 (9.50%) DNS
2 31 (5.77%) TCP/IP
3 29 (5.40%) SSL
4 28 (5.21%) BGP
5 14 (2.61%) Network Security
6 10 (1.86%) Firewall
7 9 (1.68%) DHCP
8 8 (1.49%) NAS
9 7 (1.30%) Intranet
10 6 (1.12%) VPN
11 5 (0.93%) Intrusion Detection
11 5 (0.93%) LAN
11 5 (0.93%) OpenLDAP
11 5 (0.93%) Remote Desktop
11 5 (0.93%) WAN
12 4 (0.74%) CTI
12 4 (0.74%) IPsec
12 4 (0.74%) SNMP
13 3 (0.56%) Internet
13 3 (0.56%) SAN
Database & Business Intelligence
1 62 (11.55%) SQL Server
2 51 (9.50%) Relational Database
3 37 (6.89%) RDBMS
4 36 (6.70%) Oracle BI EE
4 36 (6.70%) Siebel EIM
5 35 (6.52%) MongoDB
6 33 (6.15%) Amazon RDS
7 31 (5.77%) Oracle Database
7 31 (5.77%) Power BI
8 28 (5.21%) PostgreSQL
9 19 (3.54%) MySQL
10 18 (3.35%) Redis
11 17 (3.17%) Data Lake
12 15 (2.79%) Azure SQL Database
13 12 (2.23%) Data Warehouse
13 12 (2.23%) NoSQL
14 10 (1.86%) Microsoft Analysis Services
15 9 (1.68%) SQLite
16 7 (1.30%) Tableau
17 4 (0.74%) Amazon QuickSight
Development Applications
1 29 (5.40%) JIRA
2 26 (4.84%) Git
3 22 (4.10%) JUnit
4 18 (3.35%) Jenkins
5 13 (2.42%) TeamCity
6 12 (2.23%) Selenium
7 10 (1.86%) SonarQube
8 8 (1.49%) Cypress.io
8 8 (1.49%) GitLab
8 8 (1.49%) Visual Studio
9 7 (1.30%) IntelliJ
9 7 (1.30%) Mockito
10 6 (1.12%) Octopus Deploy
11 5 (0.93%) Bugzilla
11 5 (0.93%) Zephyr
12 4 (0.74%) Appium
12 4 (0.74%) Bitbucket
12 4 (0.74%) Cucumber
12 4 (0.74%) Gradle
13 3 (0.56%) Maven
General
1 146 (27.19%) Social Skills
2 85 (15.83%) Finance
3 75 (13.97%) Analytical Skills
4 36 (6.70%) Aerospace
5 31 (5.77%) Law
6 30 (5.59%) Public Sector
7 29 (5.40%) Legal
8 24 (4.47%) Manufacturing
9 18 (3.35%) Turkish Language
10 17 (3.17%) Retail
11 16 (2.98%) Marketing
12 15 (2.79%) Organisational Skills
13 14 (2.61%) Inclusion and Diversity
14 13 (2.42%) Presentation Skills
15 12 (2.23%) Back Office
16 10 (1.86%) Telecoms
17 7 (1.30%) Advertising
18 6 (1.12%) Billing
18 6 (1.12%) Games
19 5 (0.93%) Banking
Job Titles
1 155 (28.86%) Developer
2 131 (24.39%) Senior
3 70 (13.04%) Architect
4 63 (11.73%) Senior Developer
5 56 (10.43%) Lead
6 46 (8.57%) Solutions Architect
7 41 (7.64%) Analyst
8 36 (6.70%) Senior Siebel Developer
8 36 (6.70%) Siebel Developer
9 35 (6.52%) Java Developer
10 28 (5.21%) Lead Architect
10 28 (5.21%) Lead Solutions Architect
11 26 (4.84%) Consultant
12 25 (4.66%) Applications Manager
13 20 (3.72%) Applications Support
13 20 (3.72%) Senior Manager
13 20 (3.72%) Software Developer
13 20 (3.72%) Support Engineer
14 18 (3.35%) Infrastructure Engineer
14 18 (3.35%) IT Manager
Libraries, Frameworks & Software Standards
1 77 (14.34%) .NET
2 51 (9.50%) Spring Boot
3 44 (8.19%) Web Services
4 40 (7.45%) REST
5 39 (7.26%) Spring
6 30 (5.59%) RabbitMQ
7 28 (5.21%) HTML
8 26 (4.84%) SOAP
9 24 (4.47%) AngularJS
10 21 (3.91%) React
11 18 (3.35%) .NET Framework
12 16 (2.98%) ASP.NET
12 16 (2.98%) Middleware
13 15 (2.79%) XML
14 14 (2.61%) .NET Core
14 14 (2.61%) CSS
14 14 (2.61%) HTML5
14 14 (2.61%) Node.js
14 14 (2.61%) RESTful
15 13 (2.42%) Hibernate
Miscellaneous
1 47 (8.75%) Public Cloud
2 25 (4.66%) Onboarding
3 13 (2.42%) Data Protection Act
3 13 (2.42%) Greenfield Project
3 13 (2.42%) Product Ownership
4 11 (2.05%) Hybrid Cloud
4 11 (2.05%) Linux Command Line
4 11 (2.05%) Management Information System
4 11 (2.05%) Mobile App
4 11 (2.05%) PKI
5 10 (1.86%) Data Centre
6 9 (1.68%) Legacy Code
7 8 (1.49%) Self-Motivation
8 7 (1.30%) Distributed Systems
9 6 (1.12%) BBC
9 6 (1.12%) Client/Server
9 6 (1.12%) CMDB
10 5 (0.93%) Algorithms
11 4 (0.74%) Cloud Native
11 4 (0.74%) LIMS
Operating Systems
1 73 (13.59%) Linux
2 43 (8.01%) Windows
3 28 (5.21%) Red Hat Enterprise Linux
4 18 (3.35%) AIX
5 16 (2.98%) Windows 10
5 16 (2.98%) Windows Server
6 9 (1.68%) Android
7 5 (0.93%) Apple iOS
7 5 (0.93%) Unix
7 5 (0.93%) Windows Server 2016
8 4 (0.74%) Oracle Linux
9 2 (0.37%) Windows Server 2019
10 1 (0.19%) Mac OS X
10 1 (0.19%) Windows 7
10 1 (0.19%) Windows Server 2012
Processes & Methodologies
1 192 (35.75%) Agile
2 105 (19.55%) Problem-Solving
3 89 (16.57%) DevOps
4 80 (14.90%) ERP
5 76 (14.15%) SDLC
6 71 (13.22%) Collaborative Working
7 69 (12.85%) Roadmaps
8 66 (12.29%) CRM
9 61 (11.36%) Scrum
10 59 (10.99%) Actionable Insight
11 55 (10.24%) Project Management
12 54 (10.06%) Microservices
13 53 (9.87%) CI/CD
14 48 (8.94%) Migration
15 43 (8.01%) TOGAF
16 42 (7.82%) Continuous Improvement
17 39 (7.26%) Business Intelligence
18 38 (7.08%) EAI
18 38 (7.08%) ITIL
18 38 (7.08%) Systems Engineering
Programming Languages
1 132 (24.58%) SQL
2 83 (15.46%) Java
3 76 (14.15%) C#
4 50 (9.31%) JavaScript
5 37 (6.89%) Python
6 27 (5.03%) C++
7 26 (4.84%) C
8 24 (4.47%) VB
9 22 (4.10%) Kotlin
9 22 (4.10%) TypeScript
10 19 (3.54%) PowerShell
11 16 (2.98%) PHP
12 14 (2.61%) T-SQL
13 10 (1.86%) Data Analysis Expressions
13 10 (1.86%) U-SQL
14 9 (1.68%) Bash
15 6 (1.12%) Go
15 6 (1.12%) R
16 5 (0.93%) VB.NET
17 4 (0.74%) PL/SQL
Qualifications
1 90 (16.76%) Security Cleared
2 74 (13.78%) Degree
3 69 (12.85%) SC Cleared
4 32 (5.96%) Azure Certification
5 30 (5.59%) AWS Certification
6 28 (5.21%) AWS Certified Solutions Architect
7 18 (3.35%) Computer Science Degree
8 14 (2.61%) Microsoft Certification
9 12 (2.23%) Master's Degree
10 11 (2.05%) TOGAF Certification
11 4 (0.74%) Oracle Certification
12 3 (0.56%) MCSA
12 3 (0.56%) MCSE
13 2 (0.37%) PRINCE2 Certification
13 2 (0.37%) PRINCE2 Practitioner
14 1 (0.19%) DV Cleared
14 1 (0.19%) ISTQB
14 1 (0.19%) Numerate Degree
14 1 (0.19%) PMI Certification
14 1 (0.19%) PMP
Quality Assurance & Compliance
1 17 (3.17%) QA
2 11 (2.05%) Cyber Essentials
3 8 (1.49%) Data Quality
3 8 (1.49%) ISO/IEC 27001
4 6 (1.12%) PCI DSS
5 5 (0.93%) NIST
5 5 (0.93%) SLA
6 2 (0.37%) Cyber Essentials PLUS
6 2 (0.37%) GDPR
7 1 (0.19%) Accessibility
7 1 (0.19%) HIPAA
7 1 (0.19%) PMBOK
7 1 (0.19%) Sarbanes-Oxley
System Software
1 50 (9.31%) Active Directory
2 38 (7.08%) Docker
3 8 (1.49%) VMware Infrastructure
4 5 (0.93%) Hyper-V
4 5 (0.93%) NFS
5 1 (0.19%) Firmware
5 1 (0.19%) VMware ESXi
Systems Management
1 20 (3.72%) Single Sign-On
2 14 (2.61%) Kubernetes
3 13 (2.42%) Terraform
4 9 (1.68%) Active Directory Federation Services
5 7 (1.30%) CA Single Sign-On
6 6 (1.12%) Progress Chef
7 5 (0.93%) WSUS
8 4 (0.74%) HP Quality Center
9 2 (0.37%) Ansible
9 2 (0.37%) Control-M
9 2 (0.37%) Microsoft Intune
9 2 (0.37%) SCCM
10 1 (0.19%) vCenter Server
Vendors
1 131 (24.39%) Microsoft
2 109 (20.30%) Oracle
3 36 (6.70%) Siebel
4 28 (5.21%) Sparx
5 18 (3.35%) Salesforce
5 18 (3.35%) SAP
6 17 (3.17%) Databricks
6 17 (3.17%) VMware
7 14 (2.61%) ServiceNow
8 11 (2.05%) CyberArk
9 10 (1.86%) Google
9 10 (1.86%) HP
9 10 (1.86%) PeopleSoft
10 9 (1.68%) Cisco
11 8 (1.49%) Hyperion
11 8 (1.49%) JD Edwards
11 8 (1.49%) Siemens
12 7 (1.30%) CA
12 7 (1.30%) Facebook
12 7 (1.30%) iManage