Social Media Jobs in England

Social Media
UK > England

The table below looks at the prevalence of the term Social Media in permanent job vacancies in England. Included is a benchmarking guide to the salaries offered in vacancies that cited Social Media over the 6 months leading up to 26 July 2024, comparing them to the same period in the previous two years.

6 months to
26 Jul 2024
Same period 2023 Same period 2022
Rank 258 489 252
Rank change year-on-year +231 -237 +36
Permanent jobs citing Social Media 848 379 2,412
As % of all permanent jobs advertised in England 1.08% 0.53% 1.64%
As % of the Miscellaneous category 3.29% 1.28% 3.47%
Number of salaries quoted 503 258 923
10th Percentile £24,250 £28,375 £29,750
25th Percentile £27,945 £35,500 £38,221
Median annual salary (50th Percentile) £37,500 £45,000 £57,500
Median % change year-on-year -16.67% -21.74% +9.52%
75th Percentile £50,000 £69,250 £86,250
90th Percentile £65,000 £92,500 £87,500
UK median annual salary £38,000 £45,000 £55,000
% change year-on-year -15.56% -18.18% +4.76%

All Generic Skills
England

Social Media falls under the General and Transferable Skills category. For comparison with the information above, the following table provides summary statistics for all permanent job vacancies requiring generic IT skills in England.

Permanent vacancies with a requirement for generic IT skills 25,806 29,571 69,564
As % of all permanent jobs advertised in England 32.93% 41.60% 47.31%
Number of salaries quoted 16,283 18,664 32,310
10th Percentile £30,000 £35,408 £34,506
25th Percentile £40,523 £46,570 £46,000
Median annual salary (50th Percentile) £56,124 £65,000 £62,500
Median % change year-on-year -13.66% +4.00% +4.17%
75th Percentile £78,750 £85,000 £85,000
90th Percentile £102,500 £110,000 £105,000
UK median annual salary £55,000 £64,000 £62,500
% change year-on-year -14.06% +2.40% +4.17%

Social Media
Job Vacancy Trend in England

Job postings citing Social Media as a proportion of all IT jobs advertised in England.
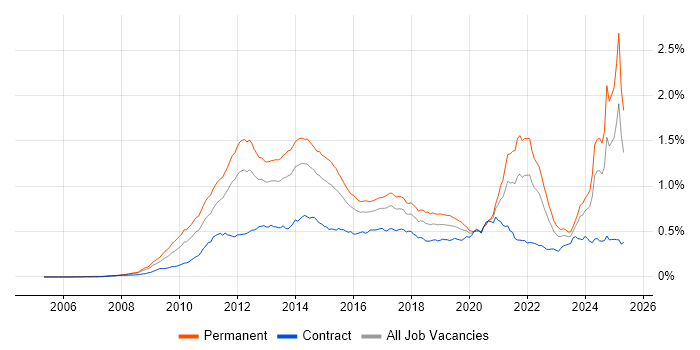
Job vacancy trend for Social Media in England

Social Media
Salary Trend in England

3-month moving average salary quoted in jobs citing Social Media in England.

Salary trend for Social Media in England

Social Media
Salary Histogram in England

Salary distribution for jobs citing Social Media in England over the 6 months to 26 July 2024.

Salary histogram for Social Media in England

Social Media
Job Locations in England

The table below looks at the demand and provides a guide to the median salaries quoted in IT jobs citing Social Media within the England region over the 6 months to 26 July 2024. The 'Rank Change' column provides an indication of the change in demand within each location based on the same 6 month period last year.

Location Rank Change
on Same Period
Last Year
Matching
Permanent
IT Job Ads
Median Salary
Past 6 Months
Median Salary
% Change
on Same Period
Last Year
Live
Jobs
London +200 402 £39,434 -12.37% 64
South East +93 172 £35,000 -12.50% 71
North of England +87 112 £43,000 +32.31% 76
Midlands +47 76 £30,000 -40.00% 65
North West +38 64 £42,500 -62.22% 47
East of England +14 45 £28,250 +2.73% 27
Yorkshire +86 43 £45,000 +38.46% 24
West Midlands +29 39 £29,000 -28.40% 41
East Midlands +9 37 £35,750 - 25
South West +15 36 £27,500 -26.67% 39
North East - 5 £50,000 - 8
Social Media
UK

Social Media
Co-occurring Skills and Capabilities in England by Category

The follow tables expand on the table above by listing co-occurrences grouped by category. The same employment type, locality and period is covered with up to 20 co-occurrences shown in each of the following categories:

Application Platforms
1 47 (5.54%) CMS
2 39 (4.60%) WordPress
3 9 (1.06%) Confluence
4 6 (0.71%) SharePoint
5 5 (0.59%) Microsoft Exchange
6 4 (0.47%) Drupal
6 4 (0.47%) Headless CMS
7 2 (0.24%) Apache Spark
8 1 (0.12%) Adobe Experience Manager
Applications
1 87 (10.26%) Microsoft Office
2 60 (7.08%) Photoshop
3 47 (5.54%) Adobe Illustrator
4 43 (5.07%) Adobe Creative Suite
5 40 (4.72%) Microsoft Excel
6 33 (3.89%) InDesign
7 24 (2.83%) Microsoft PowerPoint
8 20 (2.36%) Adobe Premiere
9 19 (2.24%) Adobe After Effects
10 7 (0.83%) Trello
11 4 (0.47%) Adobe XD
12 3 (0.35%) Microsoft Project
13 2 (0.24%) Avid Media Composer
13 2 (0.24%) CapCut
13 2 (0.24%) Sketch
13 2 (0.24%) Spreadsheet
14 1 (0.12%) Acrobat
14 1 (0.12%) Adobe Captivate
14 1 (0.12%) Blender
14 1 (0.12%) SketchUp
Business Applications
1 10 (1.18%) Shopify
2 8 (0.94%) Magento
3 3 (0.35%) Sage 200
3 3 (0.35%) Salesforce CRM
4 2 (0.24%) Dynamics CRM
5 1 (0.12%) Sprinklr
5 1 (0.12%) WebTrends
Cloud Services
1 263 (31.01%) Azure
2 212 (25.00%) Entra ID
3 54 (6.37%) Google Analytics
4 26 (3.07%) Microsoft 365
5 22 (2.59%) Google Ads
5 22 (2.59%) SaaS
6 20 (2.36%) dbt
7 17 (2.00%) Canva
7 17 (2.00%) Power Platform
8 10 (1.18%) Adobe Creative Cloud
8 10 (1.18%) MailChimp
9 9 (1.06%) Google Data Studio
10 7 (0.83%) Asana
10 7 (0.83%) Google Docs
10 7 (0.83%) Google Workspace
11 6 (0.71%) Adobe Analytics
12 5 (0.59%) Figma
13 4 (0.47%) Azure Cosmos DB
13 4 (0.47%) GitHub
13 4 (0.47%) Google Sheets
Communications & Networking
1 215 (25.35%) Broadband
2 210 (24.76%) 5G
3 13 (1.53%) Internet
3 13 (1.53%) Wi-Fi
4 9 (1.06%) Intranet
5 4 (0.47%) Unified Communications
5 4 (0.47%) VoIP
6 2 (0.24%) DNS
6 2 (0.24%) SNA
7 1 (0.12%) ISDN
7 1 (0.12%) VPN
Database & Business Intelligence
1 15 (1.77%) Power BI
2 9 (1.06%) SQL Server
3 6 (0.71%) MySQL
4 5 (0.59%) Data Warehouse
4 5 (0.59%) Tableau
5 4 (0.47%) Azure SQL Database
5 4 (0.47%) MongoDB
5 4 (0.47%) NoSQL
5 4 (0.47%) Power Query
5 4 (0.47%) Relational Database
6 2 (0.24%) Amazon Redshift
6 2 (0.24%) PostgreSQL
6 2 (0.24%) SQLite
7 1 (0.12%) Data Lake
7 1 (0.12%) Metadata
7 1 (0.12%) Mixpanel
Development Applications
1 19 (2.24%) JIRA
2 6 (0.71%) Visual Studio
3 5 (0.59%) Selenium
4 4 (0.47%) Cucumber
4 4 (0.47%) Jenkins
5 2 (0.24%) Git
6 1 (0.12%) Dreamweaver
6 1 (0.12%) JMeter
6 1 (0.12%) JUnit
6 1 (0.12%) WebDriver
General
1 372 (43.87%) Marketing
2 317 (37.38%) Analytical Skills
3 258 (30.42%) Inclusion and Diversity
4 219 (25.83%) Social Skills
5 107 (12.62%) Advertising
6 79 (9.32%) Retail
7 63 (7.43%) German Language
8 59 (6.96%) Finance
9 53 (6.25%) Organisational Skills
10 39 (4.60%) Public Sector
11 31 (3.66%) Local Government
12 20 (2.36%) Digital Economy
13 17 (2.00%) Legal
13 17 (2.00%) Publishing
14 16 (1.89%) Brand Awareness
15 14 (1.65%) Presentation Skills
16 13 (1.53%) Law
17 12 (1.42%) Multimedia
18 11 (1.30%) Influencing Skills
18 11 (1.30%) Spanish Language
Job Titles
1 210 (24.76%) Linux Specialist
1 210 (24.76%) Technical Specialist
2 167 (19.69%) Senior
3 130 (15.33%) Senior Data Warehouse Specialist
4 127 (14.98%) Senior Linux Specialist
4 127 (14.98%) Senior Technical Specialist
4 127 (14.98%) Senior Unix Technical Specialist
5 61 (7.19%) Graduate
6 54 (6.37%) Designer
7 53 (6.25%) Developer
8 32 (3.77%) .NET Developer
9 29 (3.42%) Graphic Designer
9 29 (3.42%) Social Media Developer
10 27 (3.18%) Communications Manager
11 21 (2.48%) Communications Officer
12 20 (2.36%) Analyst
12 20 (2.36%) Lead
13 17 (2.00%) Business Manager
14 16 (1.89%) Development Manager
14 16 (1.89%) IT Support
Libraries, Frameworks & Software Standards
1 53 (6.25%) HTML
2 40 (4.72%) CSS
3 34 (4.01%) .NET
4 31 (3.66%) .NET Framework
4 31 (3.66%) ASP.NET Web API
4 31 (3.66%) Entity Framework
5 12 (1.42%) HTML5
6 8 (0.94%) JSON
7 7 (0.83%) React
8 6 (0.71%) ASP.NET
8 6 (0.71%) ASP.NET MVC
8 6 (0.71%) Django
8 6 (0.71%) RESTful
9 5 (0.59%) .NET Core
9 5 (0.59%) AngularJS
9 5 (0.59%) Twitter Bootstrap
10 4 (0.47%) Play Framework
10 4 (0.47%) Spring
11 3 (0.35%) jQuery
11 3 (0.35%) Web Services
Miscellaneous
1 89 (10.50%) Self-Motivation
2 74 (8.73%) Blog
3 67 (7.90%) Photography
4 56 (6.60%) Analytical Mindset
5 51 (6.01%) Graphic Design
6 22 (2.59%) Video Editing
7 15 (1.77%) Animation
7 15 (1.77%) Digital Media
8 14 (1.65%) Driving Licence
9 10 (1.18%) Management Information System
10 9 (1.06%) e-Learning
11 8 (0.94%) Motion Graphics
11 8 (0.94%) Security Operations Centre
12 7 (0.83%) Legacy Systems
12 7 (0.83%) Onboarding
12 7 (0.83%) Podcast
12 7 (0.83%) Taxonomies
13 6 (0.71%) NHS
14 5 (0.59%) Algorithms
14 5 (0.59%) BBC
Operating Systems
1 214 (25.24%) Linux
2 210 (24.76%) Ubuntu
3 43 (5.07%) Windows
4 21 (2.48%) Windows Vista
5 14 (1.65%) Android
5 14 (1.65%) Mac OS
6 12 (1.42%) Apple iOS
7 11 (1.30%) Windows 10
8 2 (0.24%) Mac OS X
9 1 (0.12%) Windows Server
9 1 (0.12%) Windows Server 2003
Processes & Methodologies
1 276 (32.55%) CRM
2 238 (28.07%) Cybersecurity
3 216 (25.47%) Artificial Intelligence
4 210 (24.76%) IT Strategy
4 210 (24.76%) Technology Strategy
5 101 (11.91%) Analytics
6 99 (11.67%) Digital Marketing
7 92 (10.85%) SEO
8 58 (6.84%) Strategic Planning
9 57 (6.72%) User Experience
10 53 (6.25%) E-Commerce
11 50 (5.90%) Project Management
12 44 (5.19%) Business Development
13 43 (5.07%) Marketing Strategy
14 41 (4.83%) Decision-Making
15 40 (4.72%) Pay per click
16 39 (4.60%) B2B
16 39 (4.60%) Copywriting
16 39 (4.60%) Customer Service
17 36 (4.25%) Email Marketing
Programming Languages
1 210 (24.76%) Bash
2 36 (4.25%) JavaScript
3 28 (3.30%) C#
4 24 (2.83%) SQL
5 16 (1.89%) Python
6 8 (0.94%) PHP
7 6 (0.71%) Java
8 4 (0.47%) Ruby
8 4 (0.47%) Scala
9 3 (0.35%) T-SQL
9 3 (0.35%) VBA
10 2 (0.24%) C
10 2 (0.24%) C++
10 2 (0.24%) R
10 2 (0.24%) Rust
10 2 (0.24%) TypeScript
11 1 (0.12%) Google Apps Script
11 1 (0.12%) PowerShell
Qualifications
1 146 (17.22%) Degree
2 92 (10.85%) DBS Check
3 9 (1.06%) BPSS Clearance
4 8 (0.94%) Computer Science Degree
5 5 (0.59%) Security Cleared
6 4 (0.47%) CCNA
6 4 (0.47%) CCNA CyberOps
6 4 (0.47%) CCNP
6 4 (0.47%) Cisco Certification
7 3 (0.35%) ACCA
7 3 (0.35%) CIMA
8 2 (0.24%) CISA
8 2 (0.24%) CRISC
8 2 (0.24%) ISACA
8 2 (0.24%) Postgraduate
8 2 (0.24%) SC Cleared
9 1 (0.12%) CISM
9 1 (0.12%) NVQ Level 4
9 1 (0.12%) PMI Certification
9 1 (0.12%) PRINCE2 Practitioner
Quality Assurance & Compliance
1 17 (2.00%) Accessibility
2 10 (1.18%) QA
3 2 (0.24%) Disclosure Scotland
3 2 (0.24%) NIST
4 1 (0.12%) Actionable Recommendations
4 1 (0.12%) Cyber Essentials
4 1 (0.12%) GDPR
4 1 (0.12%) WCAG
System Software
1 212 (25.00%) Active Directory
2 3 (0.35%) Docker
3 2 (0.24%) Firmware
Systems Management
1 211 (24.88%) Jamf Pro
2 210 (24.76%) Microsoft Intune
3 4 (0.47%) Progress Chef
3 4 (0.47%) Puppet
4 3 (0.35%) Active Directory Federation Services
5 1 (0.12%) Core Impact
5 1 (0.12%) Terraform
Vendors
1 295 (34.79%) Microsoft
2 210 (24.76%) CyberArk
2 210 (24.76%) Tanium
3 97 (11.44%) Google
4 82 (9.67%) Adobe
5 56 (6.60%) Facebook
6 46 (5.42%) Instagram
7 33 (3.89%) Twitter
8 26 (3.07%) TikTok
9 19 (2.24%) Salesforce
10 15 (1.77%) YouTube
11 13 (1.53%) Apple
12 10 (1.18%) Ahrefs
13 8 (0.94%) Pinterest
14 7 (0.83%) Screaming Frog
15 6 (0.71%) HubSpot
16 5 (0.59%) Snapchat
16 5 (0.59%) Sony
16 5 (0.59%) Yahoo!
17 4 (0.47%) Cisco