MS Visio Jobs in London

Microsoft Visio
England > London

The table below provides summary statistics for permanent job vacancies advertised in London requiring MS Visio skills. It includes a benchmarking guide to the annual salaries offered in vacancies that cited MS Visio over the 6 months leading up to 11 May 2025, comparing them to the same period in the previous two years.

6 months to
11 May 2025
Same period 2024 Same period 2023
Rank 294 395 435
Rank change year-on-year +101 +40 +89
Permanent jobs citing MS Visio 99 108 189
As % of all permanent jobs advertised in London 0.77% 0.46% 0.55%
As % of the Applications category 6.27% 4.62% 7.03%
Number of salaries quoted 63 79 135
10th Percentile £47,250 £41,400 £33,000
25th Percentile £57,875 £55,695 £45,207
Median annual salary (50th Percentile) £72,500 £70,073 £64,402
Median % change year-on-year +3.46% +8.81% -0.92%
75th Percentile £92,500 £85,000 £80,000
90th Percentile £95,800 £87,500 £86,200
England median annual salary £60,000 £55,000 £51,500
% change year-on-year +9.09% +6.80% -6.36%

All Software Application Skills
London

MS Visio falls under the Software Applications category. For comparison with the information above, the following table provides summary statistics for all permanent job vacancies requiring software application skills in London.

Permanent vacancies with a requirement for software application skills 1,579 2,339 2,688
As % of all permanent jobs advertised in London 12.29% 9.90% 7.83%
Number of salaries quoted 649 1,383 1,799
10th Percentile £30,625 £27,965 £31,250
25th Percentile £40,000 £32,625 £38,063
Median annual salary (50th Percentile) £52,500 £47,500 £55,000
Median % change year-on-year +10.53% -13.64% -
75th Percentile £75,000 £67,000 £71,250
90th Percentile £93,250 £81,850 £90,000
England median annual salary £47,683 £37,500 £45,000
% change year-on-year +27.15% -16.67% -

MS Visio
Job Vacancy Trend in London

Job postings citing MS Visio as a proportion of all IT jobs advertised in London.
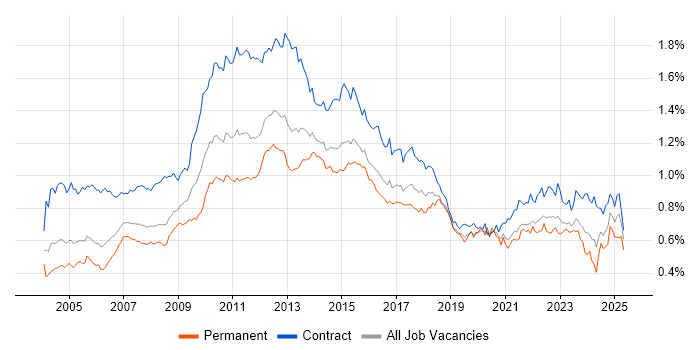
Job vacancy trend for MS Visio in London

MS Visio
Salary Trend in London

3-month moving average salary quoted in jobs citing MS Visio in London.

Salary trend for MS Visio in London

MS Visio
Salary Histogram in London

Salary distribution for jobs citing MS Visio in London over the 6 months to 11 May 2025.

Salary histogram for MS Visio in London

MS Visio
Job Locations in London

The table below looks at the demand and provides a guide to the median salaries quoted in IT jobs citing MS Visio within the London region over the 6 months to 11 May 2025. The 'Rank Change' column provides an indication of the change in demand within each location based on the same 6 month period last year.

Location Rank Change
on Same Period
Last Year
Matching
Permanent
IT Job Ads
Median Salary
Past 6 Months
Median Salary
% Change
on Same Period
Last Year
Live
Jobs
Central London +20 11 £65,000 -13.33% 6
East London -2 1 £31,000 -54.07% 2
West London - 1 £62,500 - 6
MS Visio
England

MS Visio
Co-occurring Skills and Capabilities in London by Category

The follow tables expand on the table above by listing co-occurrences grouped by category. The same employment type, locality and period is covered with up to 20 co-occurrences shown in each of the following categories:

Application Platforms
1 12 (12.12%) Microsoft Exchange
2 11 (11.11%) Confluence
3 7 (7.07%) SharePoint
4 2 (2.02%) Skype for Business
Applications
1 42 (42.42%) Microsoft Excel
2 32 (32.32%) Microsoft Office
3 23 (23.23%) Microsoft PowerPoint
4 8 (8.08%) Microsoft Project
5 2 (2.02%) Adobe XD
Business Applications
1 5 (5.05%) Infor SunSystems
1 5 (5.05%) Salesforce CRM
2 2 (2.02%) Aladdin
Cloud Services
1 25 (25.25%) Azure
2 21 (21.21%) AWS
3 13 (13.13%) Microsoft 365
4 11 (11.11%) SaaS
5 10 (10.10%) Entra ID
6 8 (8.08%) GCP
6 8 (8.08%) IaaS
6 8 (8.08%) PaaS
7 6 (6.06%) Lucidchart
7 6 (6.06%) Power Platform
8 4 (4.04%) Miro
9 3 (3.03%) Google Sheets
10 2 (2.02%) Asana
10 2 (2.02%) AWS CloudFormation
10 2 (2.02%) Azure DevOps
10 2 (2.02%) Figma
10 2 (2.02%) Microsoft Copilot
10 2 (2.02%) Serverless
10 2 (2.02%) Snowflake
10 2 (2.02%) Virtual Private Cloud
Communications & Networking
1 9 (9.09%) LAN
2 8 (8.08%) Cisco IOS
2 8 (8.08%) DHCP
2 8 (8.08%) DNS
2 8 (8.08%) FTP
2 8 (8.08%) IPv4
2 8 (8.08%) Network Security
2 8 (8.08%) PBX
2 8 (8.08%) SAN
2 8 (8.08%) SMTP
2 8 (8.08%) Structured Cabling
2 8 (8.08%) VLAN
3 7 (7.07%) Ethernet VPN
4 3 (3.03%) Firewall
4 3 (3.03%) MPLS
4 3 (3.03%) SD-WAN
4 3 (3.03%) VPN
4 3 (3.03%) WAN
5 2 (2.02%) VXLAN
5 2 (2.02%) Wi-Fi
Database & Business Intelligence
1 9 (9.09%) Amazon RDS
2 6 (6.06%) Tableau
3 5 (5.05%) Power BI
4 4 (4.04%) Data Lake
4 4 (4.04%) Data Warehouse
4 4 (4.04%) SQL Server
5 2 (2.02%) Qlik Sense
5 2 (2.02%) QlikView
6 1 (1.01%) Amazon Redshift
6 1 (1.01%) Big Data
6 1 (1.01%) BusinessObjects
6 1 (1.01%) DynamoDB
6 1 (1.01%) FileMaker
6 1 (1.01%) Looker
6 1 (1.01%) MySQL
6 1 (1.01%) NoSQL
6 1 (1.01%) Oracle Reports
6 1 (1.01%) Pentaho
6 1 (1.01%) Power Query
Development Applications
1 14 (14.14%) JIRA
2 3 (3.03%) ERwin
2 3 (3.03%) FitNesse
2 3 (3.03%) Git
2 3 (3.03%) Octopus Deploy
2 3 (3.03%) Selenium
2 3 (3.03%) SonarQube
2 3 (3.03%) TeamCity
3 1 (1.01%) Postman
3 1 (1.01%) Visual Studio
General
1 50 (50.51%) Social Skills
2 39 (39.39%) Finance
3 20 (20.20%) Analytical Skills
4 13 (13.13%) Presentation Skills
5 12 (12.12%) Banking
5 12 (12.12%) Telecoms
6 9 (9.09%) Documentation Skills
7 6 (6.06%) Marketing
7 6 (6.06%) Organisational Skills
8 4 (4.04%) Inclusion and Diversity
9 3 (3.03%) Investment Banking
9 3 (3.03%) Law
9 3 (3.03%) Publishing
10 1 (1.01%) Front Office
10 1 (1.01%) Influencing Skills
10 1 (1.01%) Legal
Job Titles
1 44 (44.44%) Analyst
2 34 (34.34%) Business Analyst
3 30 (30.30%) Senior
4 16 (16.16%) Senior Analyst
4 16 (16.16%) Senior Business Analyst
5 13 (13.13%) Architect
6 11 (11.11%) Consultant
7 10 (10.10%) Network Engineer
8 9 (9.09%) Senior Consultant
9 8 (8.08%) Infrastructure Consultant
9 8 (8.08%) Lead
9 8 (8.08%) Senior Infrastructure Consultant
10 7 (7.07%) Business Systems Analyst
10 7 (7.07%) Solutions Architect
11 6 (6.06%) Financial Analyst
11 6 (6.06%) Insurance Business Analyst
11 6 (6.06%) Salesforce Analyst
11 6 (6.06%) Salesforce Business Analyst
12 5 (5.05%) CRM Analyst
12 5 (5.05%) CRM Business Analyst
Libraries, Frameworks & Software Standards
1 6 (6.06%) XML
2 5 (5.05%) .NET
3 4 (4.04%) ASP.NET
4 3 (3.03%) .NET Framework
4 3 (3.03%) AngularJS
4 3 (3.03%) ASP.NET MVC
4 3 (3.03%) ASP.NET MVC 4
4 3 (3.03%) Entity Framework
4 3 (3.03%) HTML
4 3 (3.03%) LINQ
4 3 (3.03%) NHibernate
4 3 (3.03%) Playwright
4 3 (3.03%) Web Services
5 2 (2.02%) CSS
5 2 (2.02%) Elastic Stack
5 2 (2.02%) FpML
5 2 (2.02%) Kafka
5 2 (2.02%) Middleware
5 2 (2.02%) Oracle Fusion
6 1 (1.01%) ADO
Miscellaneous
1 11 (11.11%) Management Information System
2 8 (8.08%) Private Cloud
2 8 (8.08%) Public Cloud
3 5 (5.05%) Legacy Applications
3 5 (5.05%) Product Ownership
4 3 (3.03%) Analytical Mindset
5 2 (2.02%) Cloud Native
5 2 (2.02%) Distributed Denial-of-Service
5 2 (2.02%) DTCC
5 2 (2.02%) Enterprise Software
5 2 (2.02%) Foreign Exchange (FX)
5 2 (2.02%) Market Risk
5 2 (2.02%) Onboarding
5 2 (2.02%) PMI
5 2 (2.02%) SWIFT Messaging Network
6 1 (1.01%) Distributed Architecture
6 1 (1.01%) Distributed Systems
6 1 (1.01%) IoT
6 1 (1.01%) Reference Data
6 1 (1.01%) Virtual Team
Operating Systems
1 11 (11.11%) Windows
2 9 (9.09%) Windows 10
2 9 (9.09%) Windows Server
3 8 (8.08%) Android
4 1 (1.01%) Windows Server 2016
Processes & Methodologies
1 27 (27.27%) Agile
1 27 (27.27%) Change Management
2 23 (23.23%) Project Management
3 22 (22.22%) Problem-Solving
4 18 (18.18%) Business Analysis
5 15 (15.15%) User Stories
6 14 (14.14%) Data Modelling
6 14 (14.14%) Workshop Facilitation
7 13 (13.13%) Continuous Improvement
7 13 (13.13%) ERP
8 12 (12.12%) Requirements Gathering
8 12 (12.12%) Use Case
9 11 (11.11%) Business Transformation
9 11 (11.11%) Change Control
9 11 (11.11%) Validation
9 11 (11.11%) Waterfall
10 10 (10.10%) Workflow
11 9 (9.09%) Business Intelligence
11 9 (9.09%) CRM
11 9 (9.09%) Scrum
Programming Languages
1 13 (13.13%) Python
2 10 (10.10%) PowerShell
3 7 (7.07%) SQL
4 6 (6.06%) VBA
5 5 (5.05%) C#
5 5 (5.05%) Java
6 2 (2.02%) Bash
6 2 (2.02%) JavaScript
7 1 (1.01%) Apex Code
7 1 (1.01%) PHP
7 1 (1.01%) Ruby
Qualifications
1 44 (44.44%) Degree
2 20 (20.20%) Cisco Certification
3 11 (11.11%) CCNP
4 10 (10.10%) CCNA
5 8 (8.08%) Microsoft Certification
5 8 (8.08%) Network+ Certification
6 5 (5.05%) CCSA
6 5 (5.05%) Check Point Certification
7 4 (4.04%) CCIE
7 4 (4.04%) CCSE
8 3 (3.03%) AWS Certification
8 3 (3.03%) CBAP
8 3 (3.03%) PRINCE2 Practitioner
8 3 (3.03%) TOGAF Certification
9 2 (2.02%) AWS Certified Solutions Architect
9 2 (2.02%) Azure Certification
9 2 (2.02%) PMI Certification
10 1 (1.01%) CISA
10 1 (1.01%) CISSP
10 1 (1.01%) ITIL Certification
Quality Assurance & Compliance
1 7 (7.07%) PMO
2 5 (5.05%) ISO/IEC 27001
3 4 (4.04%) QA
4 3 (3.03%) GDPR
5 2 (2.02%) Cyber Essentials
5 2 (2.02%) EMIR
5 2 (2.02%) HIPAA
5 2 (2.02%) ISO 20022
5 2 (2.02%) MiFID
5 2 (2.02%) SEPA
5 2 (2.02%) SOC 2
6 1 (1.01%) COBIT
6 1 (1.01%) GRC
6 1 (1.01%) ISO 9001
6 1 (1.01%) NIST
6 1 (1.01%) NIST 800
6 1 (1.01%) Solvency II
System Software
1 10 (10.10%) Active Directory
2 8 (8.08%) Hyper-V
2 8 (8.08%) Virtual Desktop
2 8 (8.08%) VMware ESXi
2 8 (8.08%) VMware Infrastructure
3 3 (3.03%) Docker
Systems Management
1 8 (8.08%) Microsoft Intune
1 8 (8.08%) SCCM
1 8 (8.08%) WSUS
2 4 (4.04%) Terraform
3 3 (3.03%) Control-M
3 3 (3.03%) Kubernetes
4 2 (2.02%) Grafana
4 2 (2.02%) Prometheus
5 1 (1.01%) Computer Emergency Response Teams
5 1 (1.01%) RSA Archer
Vendors
1 35 (35.35%) Microsoft
2 19 (19.19%) Cisco
3 17 (17.17%) Salesforce
4 10 (10.10%) CheckPoint
4 10 (10.10%) F5
5 8 (8.08%) Citrix
5 8 (8.08%) Veeam
5 8 (8.08%) VMware
6 5 (5.05%) Fortinet
6 5 (5.05%) Infor
6 5 (5.05%) Sun
7 4 (4.04%) Arista
7 4 (4.04%) Google
7 4 (4.04%) SAP
7 4 (4.04%) ServiceNow
8 3 (3.03%) Oracle
9 2 (2.02%) Adobe
9 2 (2.02%) Bloomberg
9 2 (2.02%) Calypso
9 2 (2.02%) Murex