Web Services Jobs in London

Web Services
England > London

The table below provides summary statistics for permanent job vacancies advertised in London requiring Web Services skills. It includes a benchmarking guide to the annual salaries offered in vacancies that cited Web Services over the 6 months leading up to 26 July 2024, comparing them to the same period in the previous two years.

6 months to
26 Jul 2024
Same period 2023 Same period 2022
Rank 211 172 142
Rank change year-on-year -39 -30 -38
Permanent jobs citing Web Services 319 540 2,238
As % of all permanent jobs advertised in London 1.54% 1.99% 2.98%
As % of the Libraries, Frameworks & Software Standards category 6.22% 6.28% 6.73%
Number of salaries quoted 178 460 848
10th Percentile £41,250 £52,500 £50,000
25th Percentile £51,250 £61,180 £57,500
Median annual salary (50th Percentile) £62,500 £76,325 £70,000
Median % change year-on-year -18.11% +9.04% -
75th Percentile £78,138 £92,500 £90,000
90th Percentile £92,875 £103,750 £105,375
England median annual salary £55,000 £65,000 £60,000
% change year-on-year -15.38% +8.33% +9.09%

All Software Libraries and Frameworks
London

Web Services falls under the Software Libraries and Frameworks category. For comparison with the information above, the following table provides summary statistics for all permanent job vacancies requiring technical specification, industry standards, software libraries and framework skills in London.

Permanent vacancies with a requirement for technical specification, industry standards, software libraries and framework skills 5,129 8,605 33,255
As % of all permanent jobs advertised in London 24.73% 31.73% 44.33%
Number of salaries quoted 3,874 7,101 12,543
10th Percentile £48,750 £50,000 £47,500
25th Percentile £62,500 £62,500 £58,250
Median annual salary (50th Percentile) £85,000 £80,000 £75,000
Median % change year-on-year +6.25% +6.67% +3.45%
75th Percentile £112,500 £100,000 £95,000
90th Percentile £142,500 £120,000 £115,000
England median annual salary £60,000 £67,500 £65,000
% change year-on-year -11.11% +3.85% +8.33%

Web Services
Job Vacancy Trend in London

Job postings citing Web Services as a proportion of all IT jobs advertised in London.
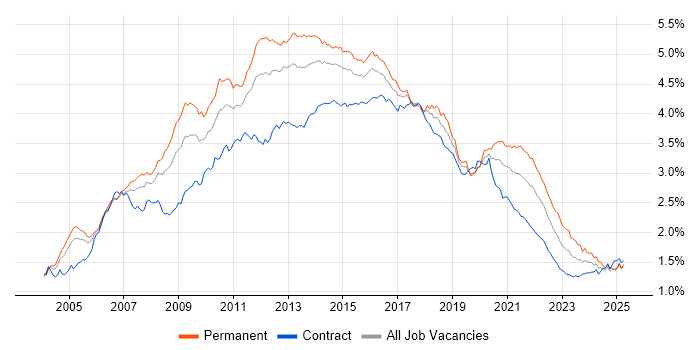
Job vacancy trend for Web Services in London

Web Services
Salary Trend in London

3-month moving average salary quoted in jobs citing Web Services in London.

Salary trend for Web Services in London

Web Services
Salary Histogram in London

Salary distribution for jobs citing Web Services in London over the 6 months to 26 July 2024.

Salary histogram for Web Services in London

Web Services
Job Locations in London

The table below looks at the demand and provides a guide to the median salaries quoted in IT jobs citing Web Services within the London region over the 6 months to 26 July 2024. The 'Rank Change' column provides an indication of the change in demand within each location based on the same 6 month period last year.

Location Rank Change
on Same Period
Last Year
Matching
Permanent
IT Job Ads
Median Salary
Past 6 Months
Median Salary
% Change
on Same Period
Last Year
Live
Jobs
Central London -2 58 £58,750 -26.56% 11
South London -23 19 £82,500 +17.86%
East London +19 2 £68,750 +25.00% 2
West London -14 1 £41,686 -25.89% 1
Web Services
England

Web Services
Co-occurring Skills and Capabilities in London by Category

The follow tables expand on the table above by listing co-occurrences grouped by category. The same employment type, locality and period is covered with up to 20 co-occurrences shown in each of the following categories:

Application Platforms
1 37 (11.60%) CMS
2 31 (9.72%) IIS
3 19 (5.96%) SharePoint
4 11 (3.45%) JBoss
5 9 (2.82%) Apache
6 8 (2.51%) Tomcat
7 7 (2.19%) OpenStack
8 5 (1.57%) Confluence
8 5 (1.57%) Oracle Workflow
8 5 (1.57%) Red Hat Fuse
9 4 (1.25%) ArcGIS
9 4 (1.25%) Drupal
10 2 (0.63%) Cloud Foundry
10 2 (0.63%) EPiServer
10 2 (0.63%) SAS
11 1 (0.31%) Apache Spark
11 1 (0.31%) Appian
11 1 (0.31%) Documentum
11 1 (0.31%) WebLogic
11 1 (0.31%) WebSphere
Applications
1 17 (5.33%) Photoshop
2 7 (2.19%) Microsoft Office
3 6 (1.88%) Microsoft Excel
3 6 (1.88%) Microsoft PowerPoint
4 1 (0.31%) Spreadsheet
Business Applications
1 33 (10.34%) SDL Web 8
2 15 (4.70%) Remedy ITSM
3 13 (4.08%) Adobe Campaign
4 8 (2.51%) NEC Housing
5 5 (1.57%) Dynamics CRM
5 5 (1.57%) Temenos T24
6 4 (1.25%) NetSuite
7 2 (0.63%) Maximo
7 2 (0.63%) SAP CX
7 2 (0.63%) SAP GRC
7 2 (0.63%) Teamcenter
8 1 (0.31%) Elite 3E
8 1 (0.31%) HFM
8 1 (0.31%) Oracle FAH
8 1 (0.31%) Oracle Receivables
8 1 (0.31%) Payment Gateway
8 1 (0.31%) SAP CRM
8 1 (0.31%) Towers Watson Igloo
Cloud Services
1 79 (24.76%) Azure
2 68 (21.32%) AWS
3 39 (12.23%) Azure DevOps
4 31 (9.72%) Serverless
5 28 (8.78%) GCP
6 23 (7.21%) GitHub
7 20 (6.27%) Amazon EKS
8 19 (5.96%) Amazon ECS
8 19 (5.96%) Power Platform
9 17 (5.33%) Adobe Creative Cloud
9 17 (5.33%) NuGet
10 13 (4.08%) Azure Service Bus
10 13 (4.08%) SaaS
11 12 (3.76%) Azure Logic Apps
12 11 (3.45%) Azure API Management
12 11 (3.45%) Azure Functions
12 11 (3.45%) PowerApps
13 10 (3.13%) IBM Cloud
14 9 (2.82%) Microsoft 365
14 9 (2.82%) Power Automate
Communications & Networking
1 5 (1.57%) Firewall
2 4 (1.25%) 5G
3 3 (0.94%) DNS
3 3 (0.94%) SSH
4 2 (0.63%) Internet
5 1 (0.31%) HTTP
5 1 (0.31%) HTTPS
5 1 (0.31%) Network Security
5 1 (0.31%) SSL
5 1 (0.31%) VPN
Database & Business Intelligence
1 106 (33.23%) SQL Server
2 48 (15.05%) Relational Database
3 41 (12.85%) PostgreSQL
4 23 (7.21%) NoSQL
5 16 (5.02%) MongoDB
6 15 (4.70%) MySQL
7 14 (4.39%) Power BI
8 12 (3.76%) DB2
9 9 (2.82%) SQL Server Integration Services
10 8 (2.51%) Oracle Database
11 7 (2.19%) Oracle Reports
11 7 (2.19%) RDBMS
12 6 (1.88%) Data Warehouse
13 5 (1.57%) Data Lake
13 5 (1.57%) Tableau
14 4 (1.25%) GIS
14 4 (1.25%) HDInsight
14 4 (1.25%) Looker
14 4 (1.25%) QlikView
14 4 (1.25%) SQL Server Reporting Services
Development Applications
1 90 (28.21%) Git
2 54 (16.93%) Visual Studio
3 47 (14.73%) JIRA
4 41 (12.85%) Moq
5 36 (11.29%) GitLab
6 35 (10.97%) TeamCity
7 33 (10.34%) Jenkins
7 33 (10.34%) NUnit
8 19 (5.96%) JUnit
9 18 (5.64%) Octopus Deploy
10 17 (5.33%) git-flow
10 17 (5.33%) Sourcetree
10 17 (5.33%) SpecFlow
11 10 (3.13%) Team Foundation Server
12 9 (2.82%) Mockito
13 8 (2.51%) IntelliJ
13 8 (2.51%) JMeter
13 8 (2.51%) MSTest
14 6 (1.88%) SoapUI
15 5 (1.57%) Oracle APEX
General
1 104 (32.60%) Finance
2 83 (26.02%) Social Skills
3 61 (19.12%) Marketing
4 34 (10.66%) Public Sector
5 23 (7.21%) Analytical Skills
5 23 (7.21%) Inclusion and Diversity
6 16 (5.02%) Retail
7 15 (4.70%) Law
8 14 (4.39%) Local Government
9 13 (4.08%) Banking
9 13 (4.08%) Publishing
10 9 (2.82%) Electronics
11 8 (2.51%) Legal
11 8 (2.51%) Police
12 4 (1.25%) Advertising
12 4 (1.25%) Back Office
12 4 (1.25%) Billing
12 4 (1.25%) General Ledger
12 4 (1.25%) Investment Banking
13 3 (0.94%) Presentation Skills
Job Titles
1 190 (59.56%) Developer
2 70 (21.94%) Senior
3 66 (20.69%) Full Stack Developer
4 45 (14.11%) C# Developer
5 40 (12.54%) Senior Developer
6 34 (10.66%) Consultant
7 32 (10.03%) .NET Developer
8 31 (9.72%) Java Developer
9 27 (8.46%) Senior C# Developer
9 27 (8.46%) Software Engineer
10 23 (7.21%) Senior Software Engineer
11 18 (5.64%) Junior
11 18 (5.64%) Senior Full Stack Developer
11 18 (5.64%) ServiceNow Developer
12 17 (5.33%) Architect
12 17 (5.33%) Full-Stack C# Developer
12 17 (5.33%) Junior Developer
13 16 (5.02%) Full Stack Java Developer
14 15 (4.70%) Junior .NET Developer
14 15 (4.70%) Technical Consultant
Libraries, Frameworks & Software Standards
1 146 (45.77%) HTML
2 126 (39.50%) .NET
3 121 (37.93%) REST
4 112 (35.11%) CSS
5 106 (33.23%) XML
6 99 (31.03%) ASP.NET
7 84 (26.33%) RESTful
8 79 (24.76%) jQuery
9 77 (24.14%) SOAP
10 71 (22.26%) AngularJS
11 62 (19.44%) .NET Framework
12 59 (18.50%) JSON
13 53 (16.61%) React
14 52 (16.30%) ASP.NET MVC
15 45 (14.11%) Entity Framework
15 45 (14.11%) Twitter Bootstrap
16 34 (10.66%) Spring
17 33 (10.34%) ASP.NET MVC 5
17 33 (10.34%) Semantic HTML
18 29 (9.09%) Spring Boot
Miscellaneous
1 33 (10.34%) Legacy Code
2 22 (6.90%) Self-Motivation
3 20 (6.27%) Distributed Systems
4 17 (5.33%) Greenfield Project
5 16 (5.02%) Algorithms
5 16 (5.02%) CMDB
5 16 (5.02%) Management Information System
6 14 (4.39%) Data Structures
6 14 (4.39%) Public Cloud
7 13 (4.08%) Product Ownership
8 11 (3.45%) Cloud Native
8 11 (3.45%) Hybrid Cloud
9 10 (3.13%) Blockchain
10 9 (2.82%) Legacy Systems
10 9 (2.82%) Onboarding
11 8 (2.51%) Enterprise Software
12 6 (1.88%) Client/Server
12 6 (1.88%) Mobile App
12 6 (1.88%) PropTech
13 5 (1.57%) Marketing Technology
Operating Systems
1 35 (10.97%) Windows
2 32 (10.03%) Linux
3 17 (5.33%) Unix
4 11 (3.45%) Android
4 11 (3.45%) Apple iOS
5 9 (2.82%) Solaris
6 6 (1.88%) AIX
7 3 (0.94%) Windows Server
8 2 (0.63%) Windows 10
8 2 (0.63%) Windows Server 2016
Processes & Methodologies
1 149 (46.71%) Agile
2 101 (31.66%) Full Stack Development
3 94 (29.47%) Problem-Solving
4 92 (28.84%) DevOps
5 74 (23.20%) Computer Science
6 69 (21.63%) MVC
7 68 (21.32%) Scrum
8 66 (20.69%) TDD
9 56 (17.55%) Test Automation
10 55 (17.24%) Mentoring
11 54 (16.93%) Unit Testing
12 53 (16.61%) Software Engineering
13 50 (15.67%) SOLID
14 47 (14.73%) Design Patterns
14 47 (14.73%) OO
15 46 (14.42%) CI/CD
16 44 (13.79%) Continuous Integration
17 43 (13.48%) Microservices
17 43 (13.48%) Responsive Web Design
18 39 (12.23%) E-Commerce
Programming Languages
1 159 (49.84%) JavaScript
2 123 (38.56%) SQL
3 120 (37.62%) C#
4 92 (28.84%) Java
5 53 (16.61%) T-SQL
6 41 (12.85%) Python
7 26 (8.15%) XPath
8 21 (6.58%) Scala
9 19 (5.96%) Kotlin
10 18 (5.64%) Shell Script
11 14 (4.39%) TypeScript
12 12 (3.76%) PowerShell
13 8 (2.51%) PHP
14 6 (1.88%) Apex Code
15 5 (1.57%) Perl
15 5 (1.57%) SOQL
15 5 (1.57%) VB.NET
16 4 (1.25%) C++
17 3 (0.94%) C
17 3 (0.94%) Ruby
Qualifications
1 101 (31.66%) Degree
2 33 (10.34%) Computer Science Degree
3 27 (8.46%) Security Cleared
4 18 (5.64%) SC Cleared
5 6 (1.88%) DV Cleared
6 4 (1.25%) Master's Degree
7 3 (0.94%) CISM
7 3 (0.94%) CISSP
7 3 (0.94%) CRISC
7 3 (0.94%) GIAC
7 3 (0.94%) ISSMP
7 3 (0.94%) MBA
7 3 (0.94%) Microsoft Certification
8 2 (0.63%) MCAD
9 1 (0.31%) AWS Certification
9 1 (0.31%) Azure Certification
9 1 (0.31%) IBM Certification
9 1 (0.31%) ITIL Foundation Certificate
9 1 (0.31%) PMP
Quality Assurance & Compliance
1 17 (5.33%) QA
2 8 (2.51%) Accessibility
3 5 (1.57%) SLA
4 4 (1.25%) California Consumer Privacy Act
4 4 (1.25%) EMIR
4 4 (1.25%) GDPR
4 4 (1.25%) MiFID
5 3 (0.94%) COBIT
5 3 (0.94%) GRC
6 2 (0.63%) Data Quality
7 1 (0.31%) ISO 15022
7 1 (0.31%) ISO 20022
System Software
1 52 (16.30%) Docker
2 2 (0.63%) Active Directory
Systems Management
1 38 (11.91%) Kubernetes
2 18 (5.64%) Ansible
3 16 (5.02%) Single Sign-On
4 10 (3.13%) Kibana
5 5 (1.57%) CloudHub
6 4 (1.25%) Puppet
6 4 (1.25%) Terraform
7 3 (0.94%) Grafana
8 2 (0.63%) Active Directory Federation Services
8 2 (0.63%) RSA Archer
9 1 (0.31%) Control-M
9 1 (0.31%) HP UCMDB
9 1 (0.31%) MIIS
9 1 (0.31%) Oracle Identity Management
9 1 (0.31%) Progress Chef
9 1 (0.31%) Prometheus
Vendors
1 38 (11.91%) Microsoft
2 37 (11.60%) Oracle
3 31 (9.72%) Adobe
4 24 (7.52%) ServiceNow
5 17 (5.33%) Cognizant
6 15 (4.70%) BMC
6 15 (4.70%) Google
6 15 (4.70%) Remedy
7 14 (4.39%) HP
8 12 (3.76%) IBM
9 11 (3.45%) Red Hat
10 10 (3.13%) Sybase
11 8 (2.51%) NEC
12 7 (2.19%) Dynatrace
12 7 (2.19%) Salesforce
12 7 (2.19%) SAP
12 7 (2.19%) Splunk
13 6 (1.88%) MuleSoft
13 6 (1.88%) WSO2
14 5 (1.57%) Atlassian