Internal Audit Jobs with Work from Home Options

Internal Auditing
UK > Work from Home

The table below provides summary statistics for permanent job vacancies with an option to work from home (WFH) and a requirement for Internal Audit skills. Included is a benchmarking guide to the salaries offered in vacancies that have cited Internal Audit over the 6 months to 6 May 2024 with a comparison to the same period in the previous 2 years.

6 months to
6 May 2024
Same period 2023 Same period 2022
Rank 471 560 723
Rank change year-on-year +89 +163 -190
Permanent jobs citing Internal Audit 112 102 121
As % of all permanent jobs with a WFH option 0.33% 0.24% 0.18%
As % of the Processes & Methodologies category 0.36% 0.25% 0.18%
Number of salaries quoted 76 92 65
10th Percentile £43,409 £38,500 £35,050
25th Percentile £48,125 £45,000 £40,500
Median annual salary (50th Percentile) £56,250 £58,000 £60,000
Median % change year-on-year -3.02% -3.33% +12.15%
75th Percentile £68,750 £81,250 £77,500
90th Percentile £77,500 £96,857 £102,500
UK median annual salary £52,500 £55,554 £59,064
% change year-on-year -5.50% -5.94% +7.39%

All Process and Methodology Skills
Work from Home

Internal Audit is in the Processes and Methodologies category. The following table is for comparison with the above and provides summary statistics for all permanent job vacancies with a WFH option and a requirement for process or methodology skills.

Permanent vacancies with a requirement for process or methodology skills 31,014 40,730 66,290
As % of all permanent jobs with a WFH option 91.60% 96.10% 96.92%
Number of salaries quoted 23,557 28,305 41,490
10th Percentile £33,750 £37,500 £36,250
25th Percentile £42,500 £47,500 £45,750
Median annual salary (50th Percentile) £57,500 £62,500 £60,000
Median % change year-on-year -8.00% +4.17% +9.09%
75th Percentile £75,000 £82,500 £80,000
90th Percentile £95,000 £100,000 £95,000
UK median annual salary £55,000 £61,500 £60,000
% change year-on-year -10.57% +2.50% +9.09%

Internal Audit
Trend for Jobs with a WFH Option

Job vacancies with a work from home option citing Internal Audit as a proportion of all IT jobs advertised.
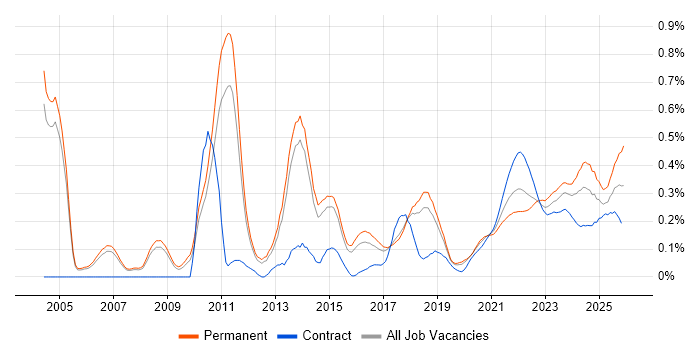
Internal Audit trend for jobs with a WFH option

Internal Audit
Salary Trend for Jobs with a WFH Option

3-month moving average salary quoted in job vacancies with a work from home option citing Internal Audit.

Internal Audit salary trend for jobs with a WFH option

Internal Audit
Salary Histogram for Jobs with a WFH Option

Salary distribution for jobs with a work from home option citing Internal Audit over the 6 months to 6 May 2024.

Internal Audit salary histogram for jobs with a WFH option

Internal Audit
Co-occurring Skills and Capabilities with WFH Options by Category

The follow tables expand on the table above by listing co-occurrences grouped by category. The same employment type, locality and period is covered with up to 20 co-occurrences shown in each of the following categories:

Application Platforms
1 5 (4.46%) SharePoint
2 2 (1.79%) SAS
3 1 (0.89%) IBM Domino
Applications
1 9 (8.04%) Microsoft Excel
2 8 (7.14%) Microsoft PowerPoint
3 7 (6.25%) Microsoft Office
4 2 (1.79%) MS Visio
Cloud Services
1 13 (11.61%) Power Platform
2 9 (8.04%) GCP
3 6 (5.36%) Microsoft 365
4 4 (3.57%) AWS
5 3 (2.68%) Azure
6 2 (1.79%) Entra ID
6 2 (1.79%) OneDrive
7 1 (0.89%) Cloud Computing
7 1 (0.89%) Google Docs
7 1 (0.89%) Google Workspace
Communications & Networking
1 6 (5.36%) Cisco IPT
2 2 (1.79%) Cisco IOS
2 2 (1.79%) Intranet
2 2 (1.79%) Intrusion Detection
2 2 (1.79%) VPN
2 2 (1.79%) Wireless
Database & Business Intelligence
1 13 (11.61%) Power BI
2 6 (5.36%) Tableau
3 1 (0.89%) Data Warehouse
Development Applications
1 1 (0.89%) Appium
1 1 (0.89%) Cucumber
1 1 (0.89%) JIRA
1 1 (0.89%) JUnit
1 1 (0.89%) Selenium
1 1 (0.89%) SoapUI
1 1 (0.89%) TestNG
1 1 (0.89%) TestRail
1 1 (0.89%) WebDriver
General
1 44 (39.29%) Finance
2 40 (35.71%) Social Skills
3 20 (17.86%) Inclusion and Diversity
4 18 (16.07%) Analytical Skills
5 12 (10.71%) Legal
6 6 (5.36%) Manufacturing
7 4 (3.57%) Marketing
7 4 (3.57%) Presentation Skills
8 3 (2.68%) Law
8 3 (2.68%) Organisational Skills
8 3 (2.68%) Public Sector
9 2 (1.79%) Banking
9 2 (1.79%) Electronics
9 2 (1.79%) Games
9 2 (1.79%) Influencing Skills
9 2 (1.79%) Retail
9 2 (1.79%) Telecoms
10 1 (0.89%) Agriculture
10 1 (0.89%) Fire and Rescue
10 1 (0.89%) Front Office
Job Titles
1 31 (27.68%) Audit Manager
2 20 (17.86%) Analyst
2 20 (17.86%) Senior
3 19 (16.96%) IT Manager
4 15 (13.39%) Senior Audit Manager
4 15 (13.39%) Senior Manager
5 14 (12.50%) Quality Manager
5 14 (12.50%) Security Analyst
6 12 (10.71%) Information Analyst
6 12 (10.71%) Information Security Analyst
7 9 (8.04%) Auditor
7 9 (8.04%) Data Manager
7 9 (8.04%) IT Audit Manager
7 9 (8.04%) IT Auditor
8 8 (7.14%) Compliance Manager
8 8 (7.14%) Data Science Manager
9 7 (6.25%) IT Security Manager
9 7 (6.25%) Security Manager
10 6 (5.36%) Engineering Manager
10 6 (5.36%) Senior Quality Manager
Libraries, Frameworks & Software Standards
1 2 (1.79%) Django
1 2 (1.79%) jQuery
1 2 (1.79%) Twitter Bootstrap
2 1 (0.89%) EDI
2 1 (0.89%) Gherkin
Miscellaneous
1 25 (22.32%) Management Information System
2 11 (9.82%) Security Posture
3 10 (8.93%) Data Protection Act
4 6 (5.36%) Data Centre
5 5 (4.46%) Reinsurance
6 2 (1.79%) BYOD
6 2 (1.79%) Cloud Native
6 2 (1.79%) Housing Association
6 2 (1.79%) PMI
7 1 (0.89%) Foreign Exchange (FX)
7 1 (0.89%) Learning Management System
7 1 (0.89%) Market Risk
7 1 (0.89%) Mobile App
7 1 (0.89%) Onboarding
7 1 (0.89%) Self-Motivation
Operating Systems
1 3 (2.68%) Windows
2 1 (0.89%) Android
2 1 (0.89%) Apple iOS
2 1 (0.89%) Linux
2 1 (0.89%) Mac OS
Processes & Methodologies
1 51 (45.54%) Risk Management
2 42 (37.50%) Information Security
3 36 (32.14%) Continuous Improvement
4 26 (23.21%) IT Audit
5 19 (16.96%) Data Protection
5 19 (16.96%) Root Cause Analysis
6 17 (15.18%) Analytics
7 16 (14.29%) Problem-Solving
8 15 (13.39%) Data Analytics
9 14 (12.50%) Project Management
9 14 (12.50%) Stakeholder Management
10 12 (10.71%) Business Continuity
11 11 (9.82%) Incident Management
11 11 (9.82%) ITIL
12 10 (8.93%) Due Diligence
12 10 (8.93%) Risk Assessment
12 10 (8.93%) Risk Register
12 10 (8.93%) Security Management
13 9 (8.04%) Data Science
13 9 (8.04%) Impact Assessments
Programming Languages
1 10 (8.93%) Python
2 9 (8.04%) SQL
3 2 (1.79%) PowerShell
3 2 (1.79%) R
Qualifications
1 15 (13.39%) Degree
2 14 (12.50%) CISA
2 14 (12.50%) CISSP
3 7 (6.25%) CRISC
4 6 (5.36%) ISEB
5 4 (3.57%) CISM
5 4 (3.57%) ISO 27001 Lead Auditor
6 3 (2.68%) ACCA
6 3 (2.68%) PMI Certification
7 2 (1.79%) (ISC)2 CCSP
7 2 (1.79%) BPSS Clearance
7 2 (1.79%) Cisco Certification
7 2 (1.79%) DBS Check
7 2 (1.79%) Master's Degree
8 1 (0.89%) AAT
8 1 (0.89%) CIMA
8 1 (0.89%) HNC
8 1 (0.89%) HND
8 1 (0.89%) PMP
8 1 (0.89%) SANS
Quality Assurance & Compliance
1 30 (26.79%) ISO/IEC 27001
2 19 (16.96%) IFRS
3 14 (12.50%) GDPR
4 12 (10.71%) GRC
5 8 (7.14%) Cyber Essentials
5 8 (7.14%) ISO 9001
6 6 (5.36%) PCI DSS
7 5 (4.46%) NIST
7 5 (4.46%) QA
7 5 (4.46%) Solvency II
8 4 (3.57%) Cyber Essentials PLUS
8 4 (3.57%) ISO 14001
8 4 (3.57%) ISO 22301
8 4 (3.57%) Sarbanes-Oxley
9 2 (1.79%) ISO 13485
9 2 (1.79%) ISO/IEC 27002 (supersedes ISO/IEC 17799)
9 2 (1.79%) SOC 2
9 2 (1.79%) SOX 404
10 1 (0.89%) Accessibility
10 1 (0.89%) NCSC
System Software
1 3 (2.68%) Active Directory
Systems Management
1 3 (2.68%) Microsoft Intune
2 2 (1.79%) Terraform
Vendors
1 13 (11.61%) Microsoft
2 11 (9.82%) Google
3 5 (4.46%) SAP
4 3 (2.68%) Apple
5 2 (1.79%) Cisco
6 1 (0.89%) Atlassian
6 1 (0.89%) CA
6 1 (0.89%) Facebook
6 1 (0.89%) ServiceNow
6 1 (0.89%) Twitter