Validation Jobs with Work from Home Options

Validation
UK > Work from Home

The table below provides summary statistics for permanent job vacancies with an option to work from home (WFH) and a requirement for Validation skills. Included is a benchmarking guide to the salaries offered in vacancies that have cited Validation over the 6 months to 6 May 2024 with a comparison to the same period in the previous 2 years.

6 months to
6 May 2024
Same period 2023 Same period 2022
Rank 216 239 247
Rank change year-on-year +23 +8 +8
Permanent jobs citing Validation 503 606 1,090
As % of all permanent jobs with a WFH option 1.49% 1.43% 1.59%
As % of the Processes & Methodologies category 1.62% 1.49% 1.64%
Number of salaries quoted 288 210 397
10th Percentile £37,500 £40,000 £35,745
25th Percentile £43,750 £45,313 £43,023
Median annual salary (50th Percentile) £55,000 £59,408 £60,000
Median % change year-on-year -7.42% -0.99% +20.00%
75th Percentile £71,500 £77,715 £80,000
90th Percentile £80,000 £87,125 £87,500
UK median annual salary £55,000 £62,500 £60,000
% change year-on-year -12.00% +4.17% +9.09%

All Process and Methodology Skills
Work from Home

Validation is in the Processes and Methodologies category. The following table is for comparison with the above and provides summary statistics for all permanent job vacancies with a WFH option and a requirement for process or methodology skills.

Permanent vacancies with a requirement for process or methodology skills 31,014 40,730 66,290
As % of all permanent jobs with a WFH option 91.60% 96.10% 96.92%
Number of salaries quoted 23,557 28,305 41,490
10th Percentile £33,750 £37,500 £36,250
25th Percentile £42,500 £47,500 £45,750
Median annual salary (50th Percentile) £57,500 £62,500 £60,000
Median % change year-on-year -8.00% +4.17% +9.09%
75th Percentile £75,000 £82,500 £80,000
90th Percentile £95,000 £100,000 £95,000
UK median annual salary £55,000 £61,500 £60,000
% change year-on-year -10.57% +2.50% +9.09%

Validation
Trend for Jobs with a WFH Option

Job vacancies with a work from home option citing Validation as a proportion of all IT jobs advertised.
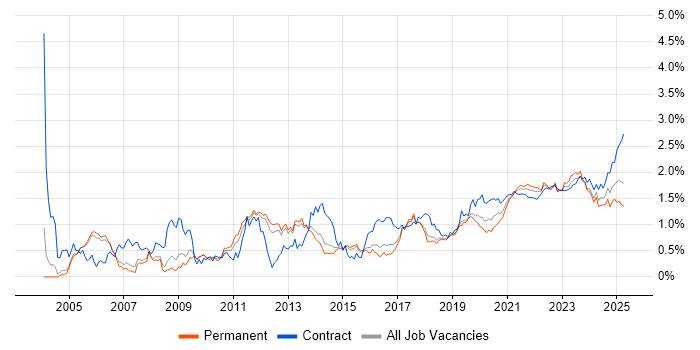
Validation trend for jobs with a WFH option

Validation
Salary Trend for Jobs with a WFH Option

3-month moving average salary quoted in job vacancies with a work from home option citing Validation.

Validation salary trend for jobs with a WFH option

Validation
Salary Histogram for Jobs with a WFH Option

Salary distribution for jobs with a work from home option citing Validation over the 6 months to 6 May 2024.

Validation salary histogram for jobs with a WFH option

Validation
Co-occurring Skills and Capabilities with WFH Options by Category

The follow tables expand on the table above by listing co-occurrences grouped by category. The same employment type, locality and period is covered with up to 20 co-occurrences shown in each of the following categories:

Application Platforms
1 18 (3.58%) SAS
2 13 (2.58%) Documentum
3 12 (2.39%) Anypoint
4 10 (1.99%) Apache
4 10 (1.99%) Apache Spark
5 2 (0.40%) Confluence
5 2 (0.40%) Jupyter
5 2 (0.40%) SharePoint
6 1 (0.20%) CMS
6 1 (0.20%) WordPress
Applications
1 40 (7.95%) Microsoft Excel
2 27 (5.37%) Microsoft Office
3 21 (4.17%) Microsoft PowerPoint
4 13 (2.58%) OrCAD
5 11 (2.19%) Simulink
6 10 (1.99%) Microsoft Project
7 5 (0.99%) SOLIDWORKS
8 4 (0.80%) Stateflow
9 2 (0.40%) EViews
9 2 (0.40%) SPSS
10 1 (0.20%) Acrobat
10 1 (0.20%) CATIA
10 1 (0.20%) Trello
Business Applications
1 13 (2.58%) TrackWise
2 8 (1.59%) Salesforce CRM
3 4 (0.80%) NetSuite
4 1 (0.20%) Aladdin
4 1 (0.20%) Dynamics AX
4 1 (0.20%) Oracle Financials
4 1 (0.20%) SAP CRM
4 1 (0.20%) SAP PP
4 1 (0.20%) SAP S/4HANA
4 1 (0.20%) thinkFolio
Cloud Services
1 96 (19.09%) Azure
2 79 (15.71%) AWS
3 23 (4.57%) Azure DevOps
4 19 (3.78%) Power Platform
5 16 (3.18%) GCP
6 15 (2.98%) Cloud Computing
7 13 (2.58%) Azure Sentinel
7 13 (2.58%) Microsoft 365
7 13 (2.58%) Microsoft Purview
8 12 (2.39%) GitHub
9 11 (2.19%) Salesforce Service Cloud
10 7 (1.39%) Mavenlink
11 6 (1.19%) SaaS
12 4 (0.80%) dbt
12 4 (0.80%) Prefect
12 4 (0.80%) Vertex AI
13 3 (0.60%) Asana
13 3 (0.60%) Azure Synapse Analytics
13 3 (0.60%) Salesforce Sales Cloud
14 2 (0.40%) Azure Data Factory
Communications & Networking
1 29 (5.77%) Firewall
2 20 (3.98%) Ethernet
2 20 (3.98%) TCP/IP
3 19 (3.78%) 5G
4 17 (3.38%) WAN
5 16 (3.18%) VPN
6 15 (2.98%) LAN
7 14 (2.78%) Network Security
7 14 (2.78%) Wireshark
8 12 (2.39%) RS-232
9 11 (2.19%) DHCP
9 11 (2.19%) DNS
10 9 (1.79%) Internet
11 6 (1.19%) IPv4
11 6 (1.19%) Wireless
12 5 (0.99%) Bluetooth
13 3 (0.60%) SD-WAN
14 2 (0.40%) 4G
14 2 (0.40%) Cisco Nexus
15 1 (0.20%) Radio Access Network
Database & Business Intelligence
1 17 (3.38%) Power BI
2 13 (2.58%) SQL Server
3 12 (2.39%) SQL Server Reporting Services
4 7 (1.39%) Relational Database
5 6 (1.19%) Big Data
5 6 (1.19%) Data Warehouse
5 6 (1.19%) Tableau
6 5 (0.99%) Oracle Reports
7 3 (0.60%) Data Lake
8 2 (0.40%) Amazon Athena
8 2 (0.40%) Amazon Redshift
8 2 (0.40%) BigQuery
8 2 (0.40%) Metadata
8 2 (0.40%) OLAP
8 2 (0.40%) Power Query
8 2 (0.40%) SQL Server Integration Services
9 1 (0.20%) Data Mining
9 1 (0.20%) Data Vault
9 1 (0.20%) Metadata Repository
9 1 (0.20%) MySQL
Development Applications
1 81 (16.10%) JIRA
2 28 (5.57%) Rational DOORS
3 14 (2.78%) Git
3 14 (2.78%) Rational Rhapsody
4 12 (2.39%) Jenkins
5 11 (2.19%) Selenium
6 10 (1.99%) Trac
6 10 (1.99%) Visual Studio
7 5 (0.99%) GitLab
7 5 (0.99%) LabVIEW
7 5 (0.99%) Postman
8 4 (0.80%) Katalon Studio
9 3 (0.60%) Eclipse
9 3 (0.60%) Maven
10 2 (0.40%) Apache Continuum
10 2 (0.40%) Appium
10 2 (0.40%) Sonatype Nexus
11 1 (0.20%) CircleCI
11 1 (0.20%) Tricentis qTest
11 1 (0.20%) Vagrant
General
1 179 (35.59%) Social Skills
2 95 (18.89%) Finance
3 83 (16.50%) Analytical Skills
4 67 (13.32%) Aerospace
5 43 (8.55%) Electronics
6 39 (7.75%) Retail
7 36 (7.16%) Manufacturing
8 28 (5.57%) Banking
9 26 (5.17%) Military
10 23 (4.57%) Pharmaceutical
10 23 (4.57%) Telecoms
11 19 (3.78%) Automotive
11 19 (3.78%) Public Sector
12 14 (2.78%) Influencing Skills
13 13 (2.58%) Games
13 13 (2.58%) Presentation Skills
14 12 (2.39%) Marketing
15 7 (1.39%) Aviation
15 7 (1.39%) Billing
15 7 (1.39%) Organisational Skills
Job Titles
1 79 (15.71%) Lead
2 75 (14.91%) Analyst
3 73 (14.51%) Senior
4 52 (10.34%) DevOps Engineer
4 52 (10.34%) Systems Engineer
5 29 (5.77%) Software Engineer
6 24 (4.77%) Business Analyst
7 21 (4.17%) Hardware Engineer
8 20 (3.98%) Architect
9 18 (3.58%) Developer
9 18 (3.58%) Senior Analyst
10 17 (3.38%) Consultant
10 17 (3.38%) IT Manager
10 17 (3.38%) Solutions Architect
11 15 (2.98%) Salesforce Analyst
12 14 (2.78%) QA Manager
12 14 (2.78%) Systems Manager
13 13 (2.58%) Design Engineer
13 13 (2.58%) Security Engineer
13 13 (2.58%) Team Leader
Libraries, Frameworks & Software Standards
1 8 (1.59%) HTML
2 7 (1.39%) .NET
3 6 (1.19%) Middleware
3 6 (1.19%) Pandas
3 6 (1.19%) XGBoost
3 6 (1.19%) XML
4 5 (0.99%) Kafka
4 5 (0.99%) Oracle Fusion
5 4 (0.80%) CSS
5 4 (0.80%) Gherkin
5 4 (0.80%) PySpark
5 4 (0.80%) PyTorch
5 4 (0.80%) Spring
5 4 (0.80%) Spring Boot
5 4 (0.80%) TensorFlow
5 4 (0.80%) Vue
5 4 (0.80%) Web Services
5 4 (0.80%) XSLT
6 3 (0.60%) Lightning Web Components
6 3 (0.60%) React
Miscellaneous
1 43 (8.55%) Management Information System
2 40 (7.95%) Self-Motivation
3 20 (3.98%) Algorithms
4 19 (3.78%) Credit Risk
5 17 (3.38%) Life Science
5 17 (3.38%) Taxonomies
6 14 (2.78%) FPGA
7 13 (2.58%) LIMS
7 13 (2.58%) Security Operations Centre
8 12 (2.39%) Analytical Mindset
9 11 (2.19%) Analogue Electronics
10 10 (1.99%) Product Ownership
11 9 (1.79%) Data Structures
12 8 (1.59%) PCIe
13 7 (1.39%) Greenfield Project
13 7 (1.39%) IoT
14 6 (1.19%) Robotics
15 4 (0.80%) Augmented Reality
15 4 (0.80%) NHS
15 4 (0.80%) Virtual Reality
Operating Systems
1 85 (16.90%) Linux
2 24 (4.77%) Windows
3 15 (2.98%) Android
4 13 (2.58%) Apple iOS
5 10 (1.99%) Windows Server
6 1 (0.20%) Unix
Processes & Methodologies
1 182 (36.18%) Agile
2 105 (20.87%) Verification and Validation
3 104 (20.68%) Problem-Solving
4 90 (17.89%) Decision-Making
4 90 (17.89%) DevOps
5 87 (17.30%) Actionable Insight
5 87 (17.30%) Systems Engineering
6 70 (13.92%) CI/CD
7 69 (13.72%) Data Validation
8 65 (12.92%) SDLC
9 64 (12.72%) Continuous Integration
10 63 (12.52%) Scrum
11 55 (10.93%) Project Management
12 54 (10.74%) Kanban
12 54 (10.74%) Software Engineering
13 52 (10.34%) Continuous Deployment
14 47 (9.34%) Collaborative Working
15 46 (9.15%) Process Improvement
16 42 (8.35%) Mentoring
17 40 (7.95%) Continuous Improvement
Programming Languages
1 81 (16.10%) Python
2 55 (10.93%) SQL
3 34 (6.76%) C#
4 26 (5.17%) MATLAB
5 24 (4.77%) PowerShell
6 22 (4.37%) C
7 19 (3.78%) R
8 16 (3.18%) JavaScript
9 13 (2.58%) Java
10 11 (2.19%) C++
11 7 (1.39%) Ada
12 4 (0.80%) Bash
12 4 (0.80%) Groovy
12 4 (0.80%) T-SQL
12 4 (0.80%) TypeScript
13 3 (0.60%) Apex Code
13 3 (0.60%) Kotlin
13 3 (0.60%) Perl
13 3 (0.60%) PHP
14 2 (0.40%) VBA
Qualifications
1 183 (36.38%) Security Cleared
2 127 (25.25%) Degree
3 82 (16.30%) BPSS Clearance
4 59 (11.73%) DV Cleared
5 48 (9.54%) SC Cleared
6 16 (3.18%) Cisco Certification
7 14 (2.78%) CCSP
7 14 (2.78%) SANS
8 13 (2.58%) (ISC)2 CCSP
8 13 (2.58%) CEH
8 13 (2.58%) CISSP
8 13 (2.58%) SSCP
9 8 (1.59%) ISEB
10 6 (1.19%) DBS Check
10 6 (1.19%) Master's Degree
10 6 (1.19%) PhD
10 6 (1.19%) PMI Certification
10 6 (1.19%) PMP
11 4 (0.80%) CIPD
11 4 (0.80%) Numerate Degree
Quality Assurance & Compliance
1 30 (5.96%) QA
2 16 (3.18%) ISO/IEC 27001
3 15 (2.98%) GxP
3 15 (2.98%) NIST
4 13 (2.58%) GMP
4 13 (2.58%) Good Clinical Practice
4 13 (2.58%) IFRS
4 13 (2.58%) IFRS 9
4 13 (2.58%) PCI DSS
5 10 (1.99%) Data Quality
6 9 (1.79%) CRD IV
7 5 (0.99%) PMO
8 3 (0.60%) Accessibility
8 3 (0.60%) Def Stans
9 2 (0.40%) Actionable Recommendations
9 2 (0.40%) AUTOSAR
9 2 (0.40%) ECSS
9 2 (0.40%) ISO 14001
10 1 (0.20%) GAMP
10 1 (0.20%) Sarbanes-Oxley
System Software
1 63 (12.52%) Docker
2 18 (3.58%) Virtual Machines
3 16 (3.18%) Hyper-V
3 16 (3.18%) pfSense
4 15 (2.98%) Firmware
5 13 (2.58%) Virtual Desktop
6 10 (1.99%) Active Directory
6 10 (1.99%) NFS
7 4 (0.80%) VMware Infrastructure
7 4 (0.80%) VMware Server
8 1 (0.20%) Embedded Firmware
Systems Management
1 62 (12.33%) Ansible
2 58 (11.53%) Terraform
3 53 (10.54%) Kubernetes
4 16 (3.18%) Grafana
4 16 (3.18%) ZABBIX
5 14 (2.78%) Nmap
6 13 (2.58%) Microsoft Intune
7 10 (1.99%) Microsoft Data Protection Manager
7 10 (1.99%) SCDPM
8 2 (0.40%) Functional Safety
9 1 (0.20%) Consul
9 1 (0.20%) OpenNMS
9 1 (0.20%) Packer
9 1 (0.20%) Podman
9 1 (0.20%) Progress Chef
9 1 (0.20%) Puppet
9 1 (0.20%) Salt
Vendors
1 68 (13.52%) Microsoft
2 36 (7.16%) Salesforce
3 23 (4.57%) VMware
4 18 (3.58%) Google
5 16 (3.18%) Fortinet
5 16 (3.18%) Juniper
6 15 (2.98%) Databricks
7 13 (2.58%) Qualys
7 13 (2.58%) Rapid7
7 13 (2.58%) Splunk
7 13 (2.58%) Thycotic
8 12 (2.39%) MuleSoft
9 11 (2.19%) EMC
10 10 (1.99%) McAfee
10 10 (1.99%) Veeam
11 9 (1.79%) IBM
12 8 (1.59%) Oracle
13 5 (0.99%) Alteryx
14 4 (0.80%) Cisco
14 4 (0.80%) SAP