Hybrid/Remote e-Learning Job Trends

e-Learning
UK > Work from Home

The table below looks at the prevalence of the term e-Learning in remote or hybrid work. Included is a benchmarking guide to the salaries offered in vacancies that cited e-Learning over the 6 months leading up to 18 November 2025, comparing them to the same period in the previous two years.

6 months to
18 Nov 2025
Same period 2024 Same period 2023
Rank 197 398 460
Rank change year-on-year +201 +62 +66
Permanent jobs citing e-Learning 184 60 31
As % of all permanent jobs with remote/hybrid work options 1.21% 0.31% 0.14%
As % of the Miscellaneous category 3.37% 0.86% 0.36%
Number of salaries quoted 20 20 29
10th Percentile £30,750 £24,000 £30,000
25th Percentile £33,125 £34,250 £33,000
Median annual salary (50th Percentile) £39,000 £51,250 £50,000
Median % change year-on-year -23.90% +2.50% -
75th Percentile £45,938 £65,000 £55,000
90th Percentile £81,886 £66,407 £87,000
UK median annual salary £37,000 £47,500 £50,000
% change year-on-year -22.11% -5.00% -4.76%

All Generic Skills
Work from Home

e-Learning falls under the General and Transferable Skills category. For comparison with the information above, the following table provides summary statistics for all permanent job vacancies with remote or hybrid options requiring generic IT skills.

Permanent vacancies with a requirement for generic IT skills 5,467 6,982 8,552
As % of all permanent jobs with a WFH option 36.01% 35.71% 39.45%
Number of salaries quoted 3,558 3,913 6,706
10th Percentile £28,000 £36,250 £37,500
25th Percentile £38,750 £47,500 £48,750
Median annual salary (50th Percentile) £57,500 £62,783 £65,000
Median % change year-on-year -8.41% -3.41% -
75th Percentile £81,188 £86,250 £84,056
90th Percentile £110,000 £117,500 £102,500
UK median annual salary £54,000 £60,000 £62,500
% change year-on-year -10.00% -4.00% -

e-Learning
Job Vacancy Trend for Remote/Hybrid Jobs

Historical trend showing the proportion of permanent IT job postings citing e-Learning and offering remote or hybrid work options relative to all permanent IT jobs advertised.
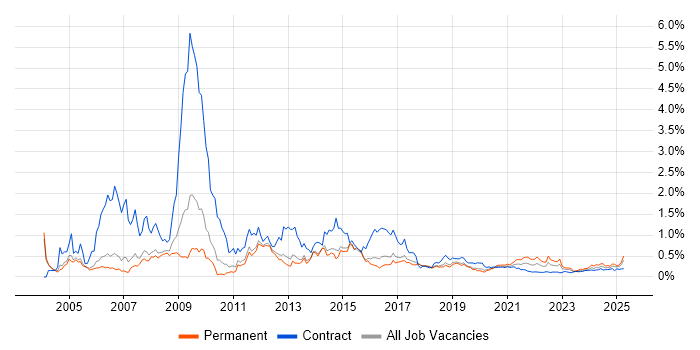
e-Learning job vacancy trend for remote/hybrid jobs

e-Learning
Salary Trend for Remote/Hybrid Jobs

Salary distribution trend for jobs with remote/hybrid work options citing e-Learning.

Salary distribution trend for jobs with remote/hybrid work options citing e-Learning

e-Learning
Salary Histogram for Remote/Hybrid Jobs

Salary distribution for jobs with remote/hybrid work options citing e-Learning over the 6 months to 18 November 2025.

e-Learning salary histogram for jobs with remote/hybrid work options

e-Learning
Co-Occurring Skills & Capabilities in Remote/Hybrid Jobs by Category

The following tables expand on the one above by listing co-occurrences grouped by category. They cover the same employment type, locality and period, with up to 20 co-occurrences shown in each category:

Application Platforms
1 2 (1.09%) Microsoft Exchange
1 2 (1.09%) Moodle
1 2 (1.09%) SharePoint
2 1 (0.54%) Alfresco
2 1 (0.54%) CMS
Applications
1 9 (4.89%) Microsoft Office
2 6 (3.26%) Microsoft PowerPoint
3 5 (2.72%) InDesign
4 4 (2.17%) Adobe Creative Suite
4 4 (2.17%) Microsoft Excel
5 3 (1.63%) Chatbot
6 2 (1.09%) Adobe After Effects
6 2 (1.09%) Adobe Illustrator
6 2 (1.09%) Adobe Premiere
6 2 (1.09%) Photoshop
7 1 (0.54%) Adobe Captivate
7 1 (0.54%) Simulink
Business Applications
1 31 (16.85%) Sparx Enterprise Architect
2 3 (1.63%) SAP S/4HANA
3 2 (1.09%) Q-Pulse
Cloud Services
1 7 (3.80%) Azure
2 6 (3.26%) Microsoft 365
3 5 (2.72%) AWS
4 3 (1.63%) GCP
4 3 (1.63%) SaaS
5 2 (1.09%) Canva
5 2 (1.09%) Google Workspace
5 2 (1.09%) OneDrive
6 1 (0.54%) OCI
6 1 (0.54%) SuccessFactors
Communications & Networking
1 23 (12.50%) Software-Defined Radio
1 23 (12.50%) Wireless
2 4 (2.17%) TCP/IP
3 3 (1.63%) DNS
3 3 (1.63%) HTTP
4 1 (0.54%) BGP
4 1 (0.54%) Cisco ASA
4 1 (0.54%) Firewall
4 1 (0.54%) Internet
4 1 (0.54%) LAN
4 1 (0.54%) MPLS
4 1 (0.54%) Network Security
4 1 (0.54%) NGFW
4 1 (0.54%) OSPF
4 1 (0.54%) SD-WAN
4 1 (0.54%) VLAN
4 1 (0.54%) VoIP
4 1 (0.54%) VPN
4 1 (0.54%) WAN
Database & Business Intelligence
1 3 (1.63%) SAP HANA
Development Applications
1 3 (1.63%) Rational Rhapsody
General
1 145 (78.80%) Finance
2 33 (17.93%) Analytical Skills
3 26 (14.13%) Social Skills
4 9 (4.89%) Legal
5 7 (3.80%) Multimedia
5 7 (3.80%) Organisational Skills
6 5 (2.72%) Aviation
7 4 (2.17%) Inclusion and Diversity
7 4 (2.17%) Law
7 4 (2.17%) Military
7 4 (2.17%) Public Sector
8 2 (1.09%) Aerospace
8 2 (1.09%) Automotive
8 2 (1.09%) Marketing
8 2 (1.09%) Telecoms
9 1 (0.54%) Advertising
9 1 (0.54%) Games
9 1 (0.54%) Police
9 1 (0.54%) Presentation Skills
9 1 (0.54%) Retail
Job Titles
1 61 (33.15%) Systems Engineer
2 41 (22.28%) Administrator
3 40 (21.74%) Systems Administrator
4 26 (14.13%) Software Engineer
5 23 (12.50%) Embedded Engineer
5 23 (12.50%) Embedded Software Engineer
6 8 (4.35%) Designer
7 6 (3.26%) Content Designer
7 6 (3.26%) Coordinator
8 4 (2.17%) Architect
8 4 (2.17%) e-Learning Designer
8 4 (2.17%) e-Learning Specialist
8 4 (2.17%) Product Specialist
8 4 (2.17%) Technical Coordinator
8 4 (2.17%) Trainer
8 4 (2.17%) Training Coordinator
9 3 (1.63%) Data Architect
9 3 (1.63%) Principal Architect
9 3 (1.63%) Principal Data Architect
9 3 (1.63%) Technology Specialist
Libraries, Frameworks & Software Standards
1 3 (1.63%) SAP Basis
2 2 (1.09%) XML
3 1 (0.54%) CSS
3 1 (0.54%) EDI
3 1 (0.54%) HTML
3 1 (0.54%) React
3 1 (0.54%) Web Services
Miscellaneous
1 23 (12.50%) Embedded Systems
1 23 (12.50%) MicroBlaze
1 23 (12.50%) RISC-V
2 19 (10.33%) Learning Management System
3 8 (4.35%) Onboarding
4 7 (3.80%) Web Conferencing
5 6 (3.26%) Animation
5 6 (3.26%) Management Information System
6 4 (2.17%) Product Ownership
6 4 (2.17%) Video Editing
7 3 (1.63%) Data Protection Act
7 3 (1.63%) Educational Technology
7 3 (1.63%) Graphic Design
7 3 (1.63%) Mobile App
7 3 (1.63%) SCORM
7 3 (1.63%) Video Conferencing
8 2 (1.09%) Digital Media
8 2 (1.09%) FPGA
8 2 (1.09%) Motion Graphics
8 2 (1.09%) Reference Data
Operating Systems
1 64 (34.78%) Linux
2 25 (13.59%) Unix
3 23 (12.50%) Embedded Linux
4 5 (2.72%) Windows
5 3 (1.63%) Windows 10
Processes & Methodologies
1 134 (72.83%) Innovative Thinking
2 40 (21.74%) High Availability
3 35 (19.02%) Model-Based Systems Engineering
4 34 (18.48%) SysML
5 32 (17.39%) Systems Engineering
6 31 (16.85%) DoDAF
6 31 (16.85%) Problem-Solving
6 31 (16.85%) Scenario Testing
6 31 (16.85%) Trade-off Analysis
6 31 (16.85%) UML
7 30 (16.30%) Agile
8 26 (14.13%) Software Engineering
9 25 (13.59%) Mathematics
9 25 (13.59%) Physics
9 25 (13.59%) Trend Analysis
10 23 (12.50%) Digital Signal Processing
10 23 (12.50%) Signal Processing
11 14 (7.61%) AI
11 14 (7.61%) Continuous Improvement
11 14 (7.61%) Instructional Design
Programming Languages
1 24 (13.04%) C
1 24 (13.04%) C++
2 3 (1.63%) PowerShell
3 2 (1.09%) JavaScript
3 2 (1.09%) PL/SQL
3 2 (1.09%) Python
3 2 (1.09%) SQL
4 1 (0.54%) Bash
4 1 (0.54%) Java
4 1 (0.54%) MATLAB
4 1 (0.54%) Tcl
4 1 (0.54%) TypeScript
Qualifications
1 138 (75.00%) Security Cleared
2 133 (72.28%) SC Cleared
3 66 (35.87%) DV Cleared
4 42 (22.83%) CCNP
4 42 (22.83%) Cisco Certification
5 34 (18.48%) Degree
6 26 (14.13%) CCNA
7 15 (8.15%) RHCSA
8 4 (2.17%) CIPD
9 3 (1.63%) Azure Certification
9 3 (1.63%) DBS Check
10 1 (0.54%) ACCA
10 1 (0.54%) BPSS Clearance
10 1 (0.54%) Computer Science Degree
10 1 (0.54%) Master's Degree
Quality Assurance & Compliance
1 12 (6.52%) Accessibility
2 8 (4.35%) GDPR
3 6 (3.26%) WCAG
4 2 (1.09%) Data Quality
4 2 (1.09%) QA
5 1 (0.54%) AQAP
5 1 (0.54%) ISO 9001
5 1 (0.54%) SLA
5 1 (0.54%) Software Quality Assurance
System Software
1 23 (12.50%) Embedded Firmware
1 23 (12.50%) Firmware
2 3 (1.63%) VMware Infrastructure
Systems Management
1 3 (1.63%) Microsoft Intune
2 1 (0.54%) Ansible
2 1 (0.54%) Single Sign-On
2 1 (0.54%) Terraform
Vendors
1 42 (22.83%) Cisco
2 31 (16.85%) Sparx
3 15 (8.15%) Red Hat
4 14 (7.61%) Microsoft
5 9 (4.89%) Adobe
6 3 (1.63%) Google
6 3 (1.63%) SAP
6 3 (1.63%) VMware
7 1 (0.54%) Blackboard
7 1 (0.54%) Fortinet
7 1 (0.54%) Palo Alto
7 1 (0.54%) Saba
7 1 (0.54%) Salesforce