Hybrid/Remote Data Management Job Trends

Data Management
UK > Work from Home

The table below provides summary statistics and salary benchmarking for remote or hybrid work requiring Data Management skills. It covers permanent job vacancies from the 6 months leading up to 13 November 2025, with comparisons to the same periods in the previous two years.

6 months to
13 Nov 2025
Same period 2024 Same period 2023
Rank 125 149 122
Rank change year-on-year +24 -27 +42
Permanent jobs citing Data Management 368 440 589
As % of all permanent jobs with remote/hybrid work options 2.35% 2.22% 2.72%
As % of the Processes & Methodologies category 2.55% 2.51% 2.87%
Number of salaries quoted 214 250 418
10th Percentile £30,500 £40,900 £42,500
25th Percentile £42,500 £45,000 £52,500
Median annual salary (50th Percentile) £63,425 £65,000 £63,750
Median % change year-on-year -2.42% +1.96% -5.56%
75th Percentile £93,438 £82,500 £96,529
90th Percentile £112,500 £107,500 £110,000
UK median annual salary £60,000 £60,000 £64,000
% change year-on-year - -6.25% -5.19%

All Process and Methodology Skills
Work from Home

Data Management falls under the Processes and Methodologies category. For comparison with the information above, the following table provides summary statistics for all permanent job vacancies with remote or hybrid options requiring process or methodology skills.

Permanent vacancies with a requirement for process or methodology skills 14,440 17,513 20,538
As % of all permanent jobs with a WFH option 92.05% 88.55% 95.00%
Number of salaries quoted 8,780 10,412 16,602
10th Percentile £29,250 £36,250 £36,750
25th Percentile £40,000 £46,250 £46,750
Median annual salary (50th Percentile) £57,500 £62,500 £62,500
Median % change year-on-year -8.00% - -
75th Percentile £77,500 £81,250 £80,500
90th Percentile £98,000 £100,000 £97,500
UK median annual salary £54,537 £60,000 £60,000
% change year-on-year -9.11% - -

Data Management
Job Vacancy Trend for Remote/Hybrid Jobs

Historical trend showing the proportion of permanent IT job postings citing Data Management and offering remote or hybrid work options relative to all permanent IT jobs advertised.
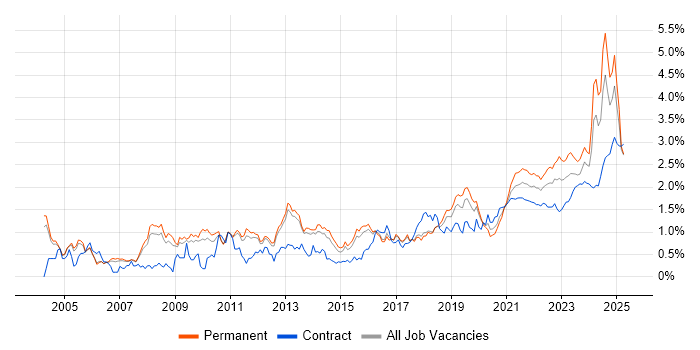
Data Management job vacancy trend for remote/hybrid jobs

Data Management
Salary Trend for Remote/Hybrid Jobs

Salary distribution trend for jobs with remote/hybrid work options citing Data Management.

Salary distribution trend for jobs with remote/hybrid work options citing Data Management

Data Management
Salary Histogram for Remote/Hybrid Jobs

Salary distribution for jobs with remote/hybrid work options citing Data Management over the 6 months to 13 November 2025.

Data Management salary histogram for jobs with remote/hybrid work options

Data Management
Co-Occurring Skills & Capabilities in Remote/Hybrid Jobs by Category

The following tables expand on the one above by listing co-occurrences grouped by category. They cover the same employment type, locality and period, with up to 20 co-occurrences shown in each category:

Application Platforms
1 8 (2.17%) Confluence
2 5 (1.36%) Apache
2 5 (1.36%) IIS
2 5 (1.36%) SAS
2 5 (1.36%) SharePoint
3 3 (0.82%) Apache Airflow
3 3 (0.82%) ArcGIS
4 2 (0.54%) Apache Spark
5 1 (0.27%) GeoServer
5 1 (0.27%) Oracle Workflow
5 1 (0.27%) WordPress
Applications
1 32 (8.70%) Microsoft Excel
2 7 (1.90%) Oracle Smart View
3 6 (1.63%) Microsoft Office
4 3 (0.82%) Microsoft PowerPoint
5 1 (0.27%) Adobe Creative Suite
5 1 (0.27%) Spreadsheet
Business Applications
1 14 (3.80%) Oracle Assets
1 14 (3.80%) Oracle Financials
1 14 (3.80%) Oracle General Ledger
1 14 (3.80%) Oracle Payables
1 14 (3.80%) Oracle Receivables
2 11 (2.99%) Dynamics CRM
2 11 (2.99%) Oracle ERP
3 8 (2.17%) Adaptiv
4 7 (1.90%) Hyperion Planning
5 5 (1.36%) Salesforce CRM
6 4 (1.09%) Oracle EBS
6 4 (1.09%) SAP S/4HANA
7 3 (0.82%) Dynamics GP
7 3 (0.82%) Sparx Enterprise Architect
8 2 (0.54%) Infor SunSystems
8 2 (0.54%) Markit EDM
8 2 (0.54%) NetSuite
9 1 (0.27%) iTrent
9 1 (0.27%) Primavera
Cloud Services
1 133 (36.14%) Azure
2 72 (19.57%) Power Platform
3 46 (12.50%) Snowflake
4 35 (9.51%) GCP
5 33 (8.97%) AWS
6 18 (4.89%) Azure DevOps
7 13 (3.53%) Dynamics 365
7 13 (3.53%) Microsoft Purview
8 11 (2.99%) Azure Data Factory
9 9 (2.45%) SaaS
10 8 (2.17%) GitHub
10 8 (2.17%) PowerApps
11 6 (1.63%) Alation
11 6 (1.63%) Collibra
11 6 (1.63%) Power Automate
12 5 (1.36%) Cloud Composer
12 5 (1.36%) iPaaS
13 4 (1.09%) Azure Stack
13 4 (1.09%) Azure Synapse Analytics
13 4 (1.09%) Microsoft 365
Communications & Networking
1 3 (0.82%) DHCP
1 3 (0.82%) DNS
1 3 (0.82%) InfiniBand
2 2 (0.54%) Broadband
3 1 (0.27%) ADSL
3 1 (0.27%) Internet
Database & Business Intelligence
1 81 (22.01%) Data Warehouse
2 66 (17.93%) Power BI
3 38 (10.33%) Tableau
4 28 (7.61%) Metadata
5 26 (7.07%) SQL Server
6 21 (5.71%) Data Lake
7 20 (5.43%) SQL Server Reporting Services
8 18 (4.89%) SQL Server Integration Services
9 11 (2.99%) BigQuery
9 11 (2.99%) NoSQL
10 10 (2.72%) Amazon Redshift
10 10 (2.72%) Tick Data
11 9 (2.45%) BusinessObjects
12 7 (1.90%) Azure SQL Data Warehouse
12 7 (1.90%) Essbase
12 7 (1.90%) Geospatial Data
12 7 (1.90%) MySQL
12 7 (1.90%) Oracle BI Publisher
13 6 (1.63%) QlikView
14 5 (1.36%) Azure SQL Database
Development Applications
1 14 (3.80%) Oracle Forms
2 11 (2.99%) JIRA
3 8 (2.17%) Git
4 6 (1.63%) ERwin
5 4 (1.09%) ER Studio
5 4 (1.09%) PowerDesigner
6 2 (0.54%) GitLab
7 1 (0.27%) Jenkins
7 1 (0.27%) JUnit
7 1 (0.27%) Mockito
7 1 (0.27%) Postman
General
1 145 (39.40%) Social Skills
2 140 (38.04%) Finance
3 91 (24.73%) Analytical Skills
4 37 (10.05%) Marketing
5 32 (8.70%) Inclusion and Diversity
6 30 (8.15%) Banking
7 27 (7.34%) Organisational Skills
8 22 (5.98%) Retail
9 18 (4.89%) Manufacturing
10 15 (4.08%) Influencing Skills
10 15 (4.08%) Public Sector
11 12 (3.26%) Legal
12 10 (2.72%) Games
13 9 (2.45%) Billing
13 9 (2.45%) Law
14 6 (1.63%) Advertising
14 6 (1.63%) Aerospace
14 6 (1.63%) Local Government
15 5 (1.36%) Telecoms
16 4 (1.09%) Back Office
Job Titles
1 69 (18.75%) Analyst
2 63 (17.12%) Architect
3 49 (13.32%) Senior
4 46 (12.50%) Developer
5 42 (11.41%) Data Architect
6 32 (8.70%) Lead
7 26 (7.07%) Data Analyst
8 25 (6.79%) Business Analyst
9 24 (6.52%) Administrator
10 22 (5.98%) Data Manager
11 20 (5.43%) Data Engineer
11 20 (5.43%) Senior Analyst
12 15 (4.08%) Consultant
13 14 (3.80%) Oracle Analyst
13 14 (3.80%) Senior Oracle Analyst
14 13 (3.53%) Data Administrator
14 13 (3.53%) Solutions Architect
15 12 (3.26%) Data Warehouse Developer
15 12 (3.26%) ETL Developer
16 11 (2.99%) Python Developer
Libraries, Frameworks & Software Standards
1 11 (2.99%) .NET
2 8 (2.17%) .NET Framework
3 5 (1.36%) Entity Framework
3 5 (1.36%) Middleware
3 5 (1.36%) WinForms
4 4 (1.09%) CSS
4 4 (1.09%) HTML
5 3 (0.82%) EDI
5 3 (0.82%) React
5 3 (0.82%) RESTful
6 2 (0.54%) CSS3
6 2 (0.54%) Express.js
6 2 (0.54%) HTML5
6 2 (0.54%) JSON
6 2 (0.54%) Node.js
6 2 (0.54%) OAuth
6 2 (0.54%) Pandas
6 2 (0.54%) Spring
6 2 (0.54%) Spring Boot
6 2 (0.54%) XML
Miscellaneous
1 54 (14.67%) Management Information System
2 23 (6.25%) Legacy Systems
3 16 (4.35%) Analytical Mindset
3 16 (4.35%) Self-Motivation
4 13 (3.53%) Blog
5 11 (2.99%) Product Ownership
6 10 (2.72%) Credit Risk
6 10 (2.72%) Onboarding
6 10 (2.72%) Reference Data
7 9 (2.45%) Cloud Native
7 9 (2.45%) Market Risk
8 7 (1.90%) Data Structures
9 6 (1.63%) IoT
9 6 (1.63%) NHS
9 6 (1.63%) Reinsurance
10 4 (1.09%) Freedom of Information
10 4 (1.09%) Pricing Data
11 3 (0.82%) Enterprise Software
11 3 (0.82%) Housing Association
11 3 (0.82%) PKI
Operating Systems
1 7 (1.90%) Windows
2 4 (1.09%) Linux
3 2 (0.54%) VMS
Processes & Methodologies
1 126 (34.24%) Analytics
2 93 (25.27%) Problem-Solving
3 91 (24.73%) Business Intelligence
4 90 (24.46%) Agile
5 77 (20.92%) Data Governance
6 75 (20.38%) Data Modelling
7 74 (20.11%) Continuous Improvement
8 66 (17.93%) Decision-Making
9 63 (17.12%) Data Architecture
10 59 (16.03%) Data Integration
11 58 (15.76%) Data Engineering
12 56 (15.22%) Visualisation
13 54 (14.67%) ETL
14 51 (13.86%) DevOps
15 48 (13.04%) Data Visualisation
16 45 (12.23%) Validation
17 43 (11.68%) AI
17 43 (11.68%) Migration
18 40 (10.87%) Data Analysis
19 37 (10.05%) Stakeholder Management
Programming Languages
1 121 (32.88%) SQL
2 67 (18.21%) Python
3 22 (5.98%) Java
4 14 (3.80%) C#
5 9 (2.45%) T-SQL
6 8 (2.17%) R
7 7 (1.90%) Groovy
8 6 (1.63%) JavaScript
8 6 (1.63%) PL/SQL
9 4 (1.09%) Fortran
10 3 (0.82%) Bash
10 3 (0.82%) Perl
10 3 (0.82%) VBA
11 2 (0.54%) C++
12 1 (0.27%) ANSI SQL
12 1 (0.27%) PowerShell
12 1 (0.27%) TypeScript
Qualifications
1 69 (18.75%) Degree
2 24 (6.52%) Computer Science Degree
3 17 (4.62%) DBS Check
4 14 (3.80%) CFA
4 14 (3.80%) ITIL Certification
4 14 (3.80%) PMI Certification
4 14 (3.80%) PMP
5 13 (3.53%) Azure Certification
6 10 (2.72%) Master's Degree
6 10 (2.72%) Security Cleared
7 9 (2.45%) Microsoft Certification
8 8 (2.17%) AWS Certification
8 8 (2.17%) AWS Certified Solutions Architect
8 8 (2.17%) SC Cleared
9 5 (1.36%) BPSS Clearance
9 5 (1.36%) CISA
9 5 (1.36%) CISM
9 5 (1.36%) CISSP
9 5 (1.36%) CRISC
10 4 (1.09%) MCSE
Quality Assurance & Compliance
1 81 (22.01%) Data Quality
2 44 (11.96%) Accessibility
3 32 (8.70%) GDPR
4 13 (3.53%) NIST
5 11 (2.99%) QA
6 8 (2.17%) HIPAA
6 8 (2.17%) ISO/IEC 27001
7 5 (1.36%) COBIT
7 5 (1.36%) GRC
7 5 (1.36%) ITGC
8 4 (1.09%) ISO 9001
9 2 (0.54%) ECSS
9 2 (0.54%) Sarbanes-Oxley
10 1 (0.27%) Actionable Recommendations
10 1 (0.27%) California Consumer Privacy Act
System Software
1 26 (7.07%) Docker
2 3 (0.82%) GPFS
2 3 (0.82%) Lustre
2 3 (0.82%) NFS
3 2 (0.54%) Firmware
3 2 (0.54%) Virtual Machines
4 1 (0.27%) VMware Infrastructure
4 1 (0.27%) vSphere
Systems Management
1 15 (4.08%) Kubernetes
2 7 (1.90%) Terraform
3 1 (0.27%) vRealize Orchestrator
Vendors
1 96 (26.09%) Microsoft
2 36 (9.78%) Databricks
3 34 (9.24%) Google
4 21 (5.71%) Oracle
5 18 (4.89%) SAP
6 14 (3.80%) Murex
7 12 (3.26%) Informatica
8 11 (2.99%) Salesforce
9 9 (2.45%) Alteryx
10 8 (2.17%) FIS
11 7 (1.90%) Hyperion
11 7 (1.90%) Sage
12 6 (1.63%) IBM
13 5 (1.36%) Xamarin
13 5 (1.36%) Zoho
14 3 (0.82%) Siebel
14 3 (0.82%) Sparx
14 3 (0.82%) Teradata
15 2 (0.54%) Adobe
15 2 (0.54%) Samsung