Change Control Contracts in London

Change Control
England > London

The following table provides summary statistics for contract job vacancies advertised in London with a requirement for Change Control skills. Included is a benchmarking guide to the contractor rates offered in vacancies that have cited Change Control over the 6 months to 28 May 2024 with a comparison to the same period in the previous 2 years.

6 months to
28 May 2024
Same period 2023 Same period 2022
Rank 279 271 326
Rank change year-on-year -8 +55 +22
Contract jobs citing Change Control 117 220 297
As % of all contract jobs advertised in London 0.67% 0.86% 0.76%
As % of the Processes & Methodologies category 0.76% 0.95% 0.83%
Number of daily rates quoted 74 119 217
10th Percentile £296 £240 £381
25th Percentile £419 £381 £450
Median daily rate (50th Percentile) £500 £503 £550
Median % change year-on-year -0.60% -8.55% +22.22%
75th Percentile £654 £658 £675
90th Percentile £805 £813 £810
England median daily rate £500 £503 £513
% change year-on-year -0.53% -1.92% +20.59%
Number of hourly rates quoted 1 15 6
10th Percentile - £43.86 -
25th Percentile £40.82 £52.74 £35.00
Median hourly rate £43.84 £54.00 £38.75
Median % change year-on-year -18.81% +39.35% +93.75%
75th Percentile £46.86 £69.50 £49.55
90th Percentile - £79.50 £59.80
England median hourly rate £42.50 £54.00 £36.00
% change year-on-year -21.30% +50.00% +41.18%

All Process and Methodology Skills
London

Change Control is in the Processes and Methodologies category. The following table is for comparison with the above and provides summary statistics for all contract job vacancies advertised in London with a requirement for process or methodology skills.

Contract vacancies with a requirement for process or methodology skills 15,459 23,164 35,909
As % of all contract IT jobs advertised in London 88.48% 90.85% 92.23%
Number of daily rates quoted 11,105 16,758 26,272
10th Percentile £340 £375 £388
25th Percentile £450 £475 £475
Median daily rate (50th Percentile) £550 £590 £575
Median % change year-on-year -6.78% +2.61% +9.52%
75th Percentile £675 £700 £688
90th Percentile £800 £800 £775
England median daily rate £525 £550 £540
% change year-on-year -4.55% +1.85% +8.00%
Number of hourly rates quoted 316 266 410
10th Percentile £15.72 £18.25 £16.95
25th Percentile £20.00 £22.50 £23.91
Median hourly rate £28.00 £39.63 £35.29
Median % change year-on-year -29.34% +12.29% +9.52%
75th Percentile £48.75 £64.50 £50.00
90th Percentile £66.88 £82.50 £67.50
England median hourly rate £37.18 £37.32 £25.00
% change year-on-year -0.38% +49.28% +11.11%

Change Control
Job Vacancy Trend in London

Job postings citing Change Control as a proportion of all IT jobs advertised in London.
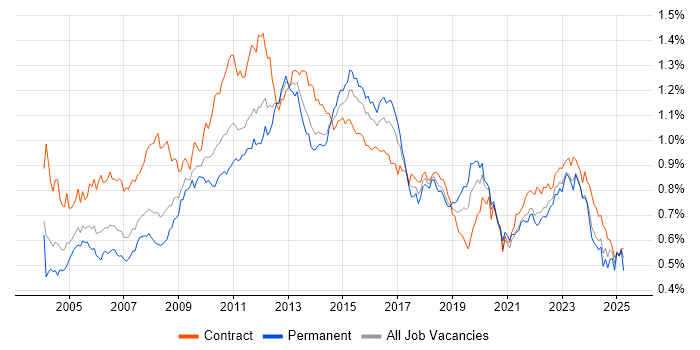
Job vacancy trend for Change Control in London

Change Control
Contractor Daily Rate Trend in London

3-month moving average daily rate quoted in jobs citing Change Control in London.

Daily rate trend for Change Control in London

Change Control
Daily Rate Histogram in London

Daily rate distribution for jobs citing Change Control in London over the 6 months to 28 May 2024.

Daily rate histogram for Change Control in London

Change Control
Contractor Hourly Rate Trend in London

3-month moving average hourly rates quoted in jobs citing Change Control in London.

Hourly rate trend for Change Control in London

Change Control
Contract Job Locations in London

The table below looks at the demand and provides a guide to the median contractor rates quoted in IT jobs citing Change Control within the London region over the 6 months to 28 May 2024. The 'Rank Change' column provides an indication of the change in demand within each location based on the same 6 month period last year.

Location Rank Change
on Same Period
Last Year
Matching
Contract
IT Job Ads
Median
Daily Rate
Past 6 Months
Median Daily Rate
% Change
on Same Period
Last Year
Live
Jobs
Central London +31 17 £500 -6.98% 7
East London -7 5 £365 -0.27% 4
West London +22 3 £581 -10.69% 6
South London +5 1 - - 2
Change Control
England

Change Control
Co-occurring Skills and Capabilities in London by Category

The follow tables expand on the table above by listing co-occurrences grouped by category. The same employment type, locality and period is covered with up to 20 co-occurrences shown in each of the following categories:

Application Platforms
1 8 (6.84%) SharePoint
2 5 (4.27%) Microsoft Exchange
3 3 (2.56%) MQSeries
4 2 (1.71%) IIS
5 1 (0.85%) BizTalk Server
5 1 (0.85%) Confluence
5 1 (0.85%) Exchange Server 2007
5 1 (0.85%) Exchange Server 2010
Applications
1 12 (10.26%) Microsoft Excel
2 8 (6.84%) Microsoft Office
2 8 (6.84%) Microsoft Project
3 5 (4.27%) Microsoft PowerPoint
4 2 (1.71%) Spreadsheet
5 1 (0.85%) MS Visio
Business Applications
1 2 (1.71%) Dynamics CRM
1 2 (1.71%) Loan IQ
2 1 (0.85%) Changepoint
2 1 (0.85%) Oracle Assets
2 1 (0.85%) Oracle Cash Management
2 1 (0.85%) Oracle ERP
2 1 (0.85%) Oracle General Ledger
2 1 (0.85%) Oracle Payables
2 1 (0.85%) Oracle Receivables
2 1 (0.85%) Remedy ITSM
2 1 (0.85%) SAP APO
2 1 (0.85%) SAP IBP
2 1 (0.85%) Unit4 Business World
Cloud Services
1 23 (19.66%) Azure
2 10 (8.55%) AWS
2 10 (8.55%) Microsoft 365
3 6 (5.13%) PaaS
3 6 (5.13%) Power Platform
3 6 (5.13%) SaaS
4 4 (3.42%) OCI
5 3 (2.56%) Cloud Computing
5 3 (2.56%) GitHub
5 3 (2.56%) IaaS
5 3 (2.56%) Miro
6 2 (1.71%) AWS CloudFormation
6 2 (1.71%) Entra ID
6 2 (1.71%) GCP
6 2 (1.71%) OneDrive
7 1 (0.85%) Amazon EC2
7 1 (0.85%) Azure Synapse Analytics
7 1 (0.85%) Dynamics 365
7 1 (0.85%) PowerApps
7 1 (0.85%) WhatsApp
Communications & Networking
1 8 (6.84%) Firewall
1 8 (6.84%) VPN
2 6 (5.13%) LAN
2 6 (5.13%) WAN
2 6 (5.13%) Wireless
3 5 (4.27%) BGP
3 5 (4.27%) OSPF
3 5 (4.27%) WLAN
4 3 (2.56%) Cisco ASA
4 3 (2.56%) Cisco Wireless
4 3 (2.56%) DHCP
4 3 (2.56%) DNS
4 3 (2.56%) IPsec
5 2 (1.71%) Network Security
5 2 (1.71%) Remote Desktop
5 2 (1.71%) TCP/IP
6 1 (0.85%) DMZ
6 1 (0.85%) NetScaler
6 1 (0.85%) Reverse Proxy
6 1 (0.85%) Wi-Fi
Database & Business Intelligence
1 6 (5.13%) Power BI
2 5 (4.27%) Data Warehouse
3 4 (3.42%) Big Data
3 4 (3.42%) Relational Database
4 3 (2.56%) Data Lake
4 3 (2.56%) NoSQL
4 3 (2.56%) OLAP
4 3 (2.56%) OLTP
4 3 (2.56%) SAP HANA
4 3 (2.56%) SQL Server
5 2 (1.71%) MySQL
5 2 (1.71%) Oracle Reports
5 2 (1.71%) RDBMS
6 1 (0.85%) Amazon Aurora
6 1 (0.85%) Azure SQL Data Warehouse
6 1 (0.85%) Azure SQL Database
6 1 (0.85%) Data Mart
6 1 (0.85%) Delta Lake
6 1 (0.85%) PostgreSQL
6 1 (0.85%) Star Schema
Development Applications
1 4 (3.42%) JIRA
2 3 (2.56%) Git
3 2 (1.71%) GitLab
3 2 (1.71%) Jenkins
3 2 (1.71%) Subversion
4 1 (0.85%) AppScan
4 1 (0.85%) Burp Suite
4 1 (0.85%) SonarQube
General
1 54 (46.15%) Finance
2 37 (31.62%) Social Skills
3 20 (17.09%) Banking
4 19 (16.24%) Analytical Skills
5 13 (11.11%) Public Sector
6 10 (8.55%) Retail
7 8 (6.84%) Local Government
7 8 (6.84%) Marketing
8 7 (5.98%) Financial Institution
8 7 (5.98%) Telecoms
9 6 (5.13%) Documentation Skills
10 5 (4.27%) Back Office
10 5 (4.27%) Manufacturing
11 4 (3.42%) Influencing Skills
11 4 (3.42%) Investment Banking
11 4 (3.42%) Legal
12 3 (2.56%) Electronics
12 3 (2.56%) Organisational Skills
12 3 (2.56%) Private Banking
13 2 (1.71%) Automotive
Job Titles
1 22 (18.80%) Project Manager
2 21 (17.95%) Analyst
3 15 (12.82%) Senior
4 10 (8.55%) Business Analyst
5 9 (7.69%) PMO Analyst
5 9 (7.69%) Senior Analyst
6 8 (6.84%) Programme Manager
7 7 (5.98%) Architect
7 7 (5.98%) PMO Manager
8 6 (5.13%) Developer
8 6 (5.13%) Lead
9 5 (4.27%) Senior PMO
9 5 (4.27%) Senior PMO Analyst
10 4 (3.42%) Cloud Architect
10 4 (3.42%) Consultant
10 4 (3.42%) Data Architect
10 4 (3.42%) Finance Business Analyst
10 4 (3.42%) PMO Lead
10 4 (3.42%) Senior Business Analyst
10 4 (3.42%) Solutions Architect
Libraries, Frameworks & Software Standards
1 4 (3.42%) Middleware
1 4 (3.42%) Oracle Fusion
2 3 (2.56%) .NET
2 3 (2.56%) SAP PI
2 3 (2.56%) XML
3 2 (1.71%) AngularJS
3 2 (1.71%) Elastic Stack
3 2 (1.71%) Microsoft Graph
3 2 (1.71%) React
4 1 (0.85%) EDI
4 1 (0.85%) Kafka
4 1 (0.85%) PySpark
4 1 (0.85%) REST
4 1 (0.85%) Unity DI Container
4 1 (0.85%) Web Services
Miscellaneous
1 7 (5.98%) Product Ownership
2 5 (4.27%) Management Information System
3 3 (2.56%) AS400
3 3 (2.56%) iSeries
3 3 (2.56%) PKI
3 3 (2.56%) PMI
3 3 (2.56%) SWIFT Messaging Network
4 2 (1.71%) Clustering
4 2 (1.71%) Derivative
4 2 (1.71%) Fixed Income
4 2 (1.71%) Market Risk
4 2 (1.71%) Onboarding
4 2 (1.71%) Public Cloud
4 2 (1.71%) Self-Motivation
4 2 (1.71%) Virtual Team
5 1 (0.85%) Client/Server
5 1 (0.85%) Mainframe
5 1 (0.85%) NHS
5 1 (0.85%) Security Posture
5 1 (0.85%) Team-Oriented Environment
Operating Systems
1 17 (14.53%) Windows
2 7 (5.98%) Windows Server
3 3 (2.56%) Windows 10
4 2 (1.71%) Linux
5 1 (0.85%) VMS
Processes & Methodologies
1 42 (35.90%) Project Management
2 38 (32.48%) Project Delivery
3 30 (25.64%) Stakeholder Management
4 29 (24.79%) Agile
5 21 (17.95%) Programme Management
6 20 (17.09%) Migration
7 19 (16.24%) Problem-Solving
8 18 (15.38%) PRINCE2
9 17 (14.53%) Business Case
9 17 (14.53%) Change Management
10 16 (13.68%) Decision-Making
11 14 (11.97%) Risk Management
12 13 (11.11%) Programme Delivery
13 11 (9.40%) Capacity Planning
14 10 (8.55%) Configuration Management
14 10 (8.55%) Data Migration
14 10 (8.55%) Workshop Facilitation
15 9 (7.69%) Analytics
15 9 (7.69%) ITIL
15 9 (7.69%) Project Governance
Programming Languages
1 15 (12.82%) PowerShell
2 13 (11.11%) SQL
3 5 (4.27%) Java
4 4 (3.42%) C#
4 4 (3.42%) Python
5 3 (2.56%) RPG
6 2 (1.71%) Bash
6 2 (1.71%) JavaScript
7 1 (0.85%) Ada
7 1 (0.85%) C
7 1 (0.85%) C++
7 1 (0.85%) VBScript
Qualifications
1 25 (21.37%) Security Cleared
2 17 (14.53%) SC Cleared
3 12 (10.26%) Degree
4 10 (8.55%) PRINCE2 Practitioner
5 8 (6.84%) DV Cleared
6 5 (4.27%) Azure Certification
7 4 (3.42%) PMI Certification
7 4 (3.42%) PMP
8 3 (2.56%) APMG
9 2 (1.71%) APMP
9 2 (1.71%) DBS Check
9 2 (1.71%) Numerate Degree
10 1 (0.85%) MCSA
10 1 (0.85%) MCSE
10 1 (0.85%) Microsoft Certification
10 1 (0.85%) SANS
10 1 (0.85%) VMware Certified Professional (VCP)
Quality Assurance & Compliance
1 30 (25.64%) PMO
2 9 (7.69%) QA
3 5 (4.27%) Cyber Essentials
4 4 (3.42%) Data Quality
4 4 (3.42%) PCI DSS
5 3 (2.56%) Cyber Essentials PLUS
5 3 (2.56%) ISO 20022
6 2 (1.71%) Accessibility
7 1 (0.85%) Actionable Recommendations
7 1 (0.85%) NIST
System Software
1 11 (9.40%) Active Directory
2 6 (5.13%) VMware Infrastructure
3 5 (4.27%) Docker
4 3 (2.56%) vSphere
5 1 (0.85%) Firmware
5 1 (0.85%) VMware NSX
5 1 (0.85%) XenApp
5 1 (0.85%) XenDesktop
Systems Management
1 4 (3.42%) Kubernetes
2 3 (2.56%) Ansible
2 3 (2.56%) Control-M
2 3 (2.56%) FortiGate
2 3 (2.56%) Microsoft Intune
2 3 (2.56%) Progress Chef
2 3 (2.56%) Puppet
2 3 (2.56%) SCCM
2 3 (2.56%) Terraform
2 3 (2.56%) WSUS
3 2 (1.71%) Grafana
3 2 (1.71%) Graylog
3 2 (1.71%) Nagios
3 2 (1.71%) Prometheus
4 1 (0.85%) AirWatch
4 1 (0.85%) HP Fortify
4 1 (0.85%) Nessus
4 1 (0.85%) SCOM
4 1 (0.85%) vCenter Server
4 1 (0.85%) WebInspect
Vendors
1 32 (27.35%) Microsoft
2 10 (8.55%) SAP
3 9 (7.69%) Cisco
4 8 (6.84%) Fortinet
4 8 (6.84%) VMware
5 6 (5.13%) Databricks
5 6 (5.13%) Juniper
5 6 (5.13%) Oracle
6 5 (4.27%) Palo Alto
7 4 (3.42%) Qualys
8 3 (2.56%) CyberSource
8 3 (2.56%) Extreme Networks
8 3 (2.56%) IBM
9 2 (1.71%) Cadence
9 2 (1.71%) Citrix
9 2 (1.71%) NEC
9 2 (1.71%) NetApp
9 2 (1.71%) ServiceNow
9 2 (1.71%) SolarWinds
9 2 (1.71%) Splunk