Continuous Improvement Contract Job Trends in London

Continual Improvement
England > London

The table below provides summary statistics and contractor rates for jobs advertised in London requiring Continuous Improvement skills. It covers contract job vacancies from the 6 months leading up to 27 October 2025, with comparisons to the same periods in the previous two years.

6 months to
27 Oct 2025
Same period 2024 Same period 2023
Rank 32 60 66
Rank change year-on-year +28 +6 +29
Contract jobs citing Continuous Improvement 847 597 714
As % of all contract jobs in London 6.31% 3.82% 3.47%
As % of the Processes & Methodologies category 6.83% 4.28% 3.86%
Number of daily rates quoted 564 338 482
10th Percentile £327 £368 £400
25th Percentile £425 £463 £475
Median daily rate (50th Percentile) £525 £569 £575
Median % change year-on-year -7.73% -1.04% -
75th Percentile £675 £688 £700
90th Percentile £750 £788 £800
England median daily rate £500 £525 £563
% change year-on-year -4.76% -6.67% +2.27%
Number of hourly rates quoted 27 11 6
10th Percentile £17.30 £17.08 £19.25
25th Percentile £17.88 £28.34 £24.86
Median hourly rate £20.00 £50.00 £40.46
Median % change year-on-year -60.00% +23.58% -45.82%
75th Percentile £38.88 £64.38 £75.61
90th Percentile £52.50 £75.00 £88.28
England median hourly rate £20.04 £33.93 £65.00
% change year-on-year -40.94% -47.80% -5.87%

All Process and Methodology Skills
London

Continuous Improvement falls under the Processes and Methodologies category. For comparison with the information above, the following table provides summary statistics for all contract job vacancies requiring process or methodology skills in London.

Contract vacancies with a requirement for process or methodology skills 12,407 13,954 18,484
As % of all contract IT jobs advertised in London 92.43% 89.21% 89.76%
Number of daily rates quoted 8,152 8,992 13,332
10th Percentile £331 £350 £363
25th Percentile £425 £450 £463
Median daily rate (50th Percentile) £540 £550 £575
Median % change year-on-year -1.82% -4.35% -2.13%
75th Percentile £663 £675 £688
90th Percentile £775 £800 £800
England median daily rate £510 £525 £550
% change year-on-year -2.86% -4.55% -
Number of hourly rates quoted 248 168 235
10th Percentile £17.98 £17.43 £18.23
25th Percentile £25.01 £24.42 £21.25
Median hourly rate £31.00 £37.79 £38.75
Median % change year-on-year -17.97% -2.49% +2.15%
75th Percentile £47.50 £57.81 £62.75
90th Percentile £64.83 £79.13 £77.50
England median hourly rate £25.15 £40.00 £44.50
% change year-on-year -37.13% -10.11% +27.14%

Continuous Improvement
Job Vacancy Trend in London

Historical trend showing the proportion of contract IT job postings citing Continuous Improvement relative to all contract IT jobs advertised in London.
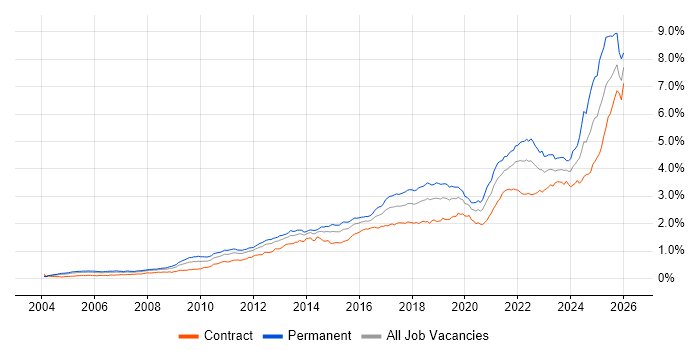
Continuous Improvement job vacancy trend in London

Continuous Improvement
Daily Rate Trend in London

Contractor daily rate distribution trend for jobs in London citing Continuous Improvement.

Contractor daily rate distribution trend for jobs in London citing Continuous Improvement

Continuous Improvement
Daily Rate Histogram in London

Daily rate distribution for jobs citing Continuous Improvement in London over the 6 months to 27 October 2025.

Daily rate histogram for Continuous Improvement in London

Continuous Improvement
Hourly Rate Trend in London

Contractor hourly rate distribution trend for jobs in London citing Continuous Improvement.

Contractor hourly rate distribution trend for jobs in London citing Continuous Improvement

Continuous Improvement
Hourly Rate Histogram in London

Hourly rate distribution of jobs citing Continuous Improvement in London over the 6 months to 27 October 2025.

Hourly rate histogram for Continuous Improvement in London

Continuous Improvement
Contract Job Locations in London

The table below looks at the demand and provides a guide to the median contractor rates quoted in IT jobs citing Continuous Improvement within the London region over the 6 months to 27 October 2025. The 'Rank Change' column provides an indication of the change in demand within each location based on the same 6 month period last year.

Location Rank Change
on Same Period
Last Year
Matching
Contract
IT Job Ads
Median
Daily Rate
Past 6 Months
Median Daily Rate
% Change
on Same Period
Last Year
Live
Jobs
Central London +14 124 £523 -12.92% 433
West London +7 23 £496 +16.76% 60
East London +4 13 £190 -64.40% 26
South London -1 10 £581 +22.39% 16
North London +2 3 £550 - 5
Continuous Improvement
England

Continuous Improvement
Co-Occurring Skills & Capabilities in London by Category

The following tables expand on the one above by listing co-occurrences grouped by category. They cover the same employment type, locality and period, with up to 20 co-occurrences shown in each category:

Application Platforms
1 56 (6.61%) Confluence
2 29 (3.42%) SharePoint
3 12 (1.42%) Apache Airflow
4 10 (1.18%) Apache Spark
5 9 (1.06%) CMS
6 8 (0.94%) Apache
7 7 (0.83%) Microsoft Exchange
8 5 (0.59%) MQSeries
9 3 (0.35%) Appian
9 3 (0.35%) Ethereum
9 3 (0.35%) Headless CMS
9 3 (0.35%) Hyperledger
10 2 (0.24%) HCL Notes
10 2 (0.24%) Luigi
10 2 (0.24%) Oracle SOA Suite
11 1 (0.12%) Drupal
11 1 (0.12%) nginx
11 1 (0.12%) Oracle Service Bus
11 1 (0.12%) Sitecore CMS
11 1 (0.12%) WordPress
Applications
1 56 (6.61%) Microsoft Excel
2 19 (2.24%) Microsoft Office
3 15 (1.77%) Microsoft PowerPoint
4 13 (1.53%) Microsoft Project
5 10 (1.18%) MS Visio
6 6 (0.71%) Chatbot
7 4 (0.47%) Spreadsheet
8 2 (0.24%) Trello
9 1 (0.12%) Adobe Captivate
9 1 (0.12%) Adobe XD
9 1 (0.12%) AutoCAD
9 1 (0.12%) Camtasia
9 1 (0.12%) Notion
9 1 (0.12%) Revit
9 1 (0.12%) Sketch
9 1 (0.12%) Zeplin
Business Applications
1 44 (5.19%) SAP S/4HANA
2 17 (2.01%) Endur
3 4 (0.47%) Infor SunSystems
3 4 (0.47%) Oracle EBS
3 4 (0.47%) SAP PS
4 3 (0.35%) Dynamics CRM
4 3 (0.35%) ION MarketView
4 3 (0.35%) Oracle Payables
4 3 (0.35%) Workfront
5 2 (0.24%) Oracle Assets
5 2 (0.24%) Oracle Cash Management
5 2 (0.24%) Oracle ERP
5 2 (0.24%) Oracle Procure-to-Pay
5 2 (0.24%) Remedy ITSM
5 2 (0.24%) SAP MM
5 2 (0.24%) SAP PM
5 2 (0.24%) Teamcenter
5 2 (0.24%) Workday HCM
6 1 (0.12%) Oracle Financials
6 1 (0.12%) SAP PP
Cloud Services
1 140 (16.53%) Azure
2 118 (13.93%) AWS
3 69 (8.15%) Power Platform
4 47 (5.55%) Azure DevOps
5 42 (4.96%) Microsoft 365
6 35 (4.13%) GCP
7 34 (4.01%) SaaS
8 27 (3.19%) GitHub
8 27 (3.19%) Serverless
9 19 (2.24%) Amazon S3
10 17 (2.01%) AWS Lambda
11 16 (1.89%) Dynamics 365
11 16 (1.89%) Entra ID
11 16 (1.89%) GitHub Actions
12 15 (1.77%) dbt
13 14 (1.65%) AWS CloudFormation
13 14 (1.65%) Power Automate
14 13 (1.53%) PaaS
15 12 (1.42%) PowerApps
15 12 (1.42%) Snowflake
Communications & Networking
1 17 (2.01%) Firewall
2 13 (1.53%) DNS
3 10 (1.18%) TCP/IP
4 9 (1.06%) VPN
5 8 (0.94%) DHCP
6 7 (0.83%) Network Security
6 7 (0.83%) WAN
7 6 (0.71%) LAN
8 4 (0.47%) Multicast
8 4 (0.47%) tcpdump
8 4 (0.47%) Wireshark
9 3 (0.35%) SD-WAN
9 3 (0.35%) SSL
10 2 (0.24%) DKIM
10 2 (0.24%) DMARC
10 2 (0.24%) Intrusion Detection
10 2 (0.24%) Kerberos
10 2 (0.24%) Remote Desktop
10 2 (0.24%) Wi-Fi
10 2 (0.24%) Wireless
Database & Business Intelligence
1 58 (6.85%) Power BI
2 28 (3.31%) PostgreSQL
3 23 (2.72%) SAP HANA
4 20 (2.36%) Data Warehouse
5 19 (2.24%) Tableau
6 17 (2.01%) Relational Database
7 14 (1.65%) NoSQL
8 11 (1.30%) Amazon RDS
8 11 (1.30%) Data Lake
8 11 (1.30%) MySQL
9 10 (1.18%) DynamoDB
9 10 (1.18%) Geospatial Data
9 10 (1.18%) Metadata
9 10 (1.18%) SQL Server
10 9 (1.06%) Redis
11 8 (0.94%) GIS
11 8 (0.94%) Oracle Database
12 7 (0.83%) Big Data
13 6 (0.71%) Amazon Redshift
14 5 (0.59%) MongoDB
Development Applications
1 103 (12.16%) JIRA
2 45 (5.31%) Git
3 38 (4.49%) Jenkins
4 14 (1.65%) Selenium
5 13 (1.53%) GitLab
6 12 (1.42%) JUnit
7 10 (1.18%) Postman
8 9 (1.06%) SonarQube
9 8 (0.94%) Cucumber
9 8 (0.94%) Maven
10 7 (0.83%) REST Assured
11 6 (0.71%) Mockito
11 6 (0.71%) SoapUI
11 6 (0.71%) Xcode
12 5 (0.59%) Atlassian Bamboo
12 5 (0.59%) Subversion
12 5 (0.59%) XCTest
13 4 (0.47%) Cypress.io
14 3 (0.35%) Bitbucket
14 3 (0.35%) Gradle
General
1 421 (49.70%) Social Skills
2 227 (26.80%) Finance
3 168 (19.83%) Analytical Skills
4 99 (11.69%) Public Sector
5 93 (10.98%) Banking
6 35 (4.13%) Influencing Skills
7 28 (3.31%) Legal
8 27 (3.19%) Organisational Skills
9 25 (2.95%) Retail
10 24 (2.83%) Telecoms
11 23 (2.72%) Marketing
12 22 (2.60%) Manufacturing
13 19 (2.24%) Documentation Skills
13 19 (2.24%) Front Office
13 19 (2.24%) Inclusion and Diversity
14 16 (1.89%) Investment Banking
15 14 (1.65%) Financial Institution
16 12 (1.42%) Local Government
17 11 (1.30%) Publishing
18 10 (1.18%) Law
Job Titles
1 130 (15.35%) Analyst
2 109 (12.87%) Lead
3 88 (10.39%) Developer
4 83 (9.80%) Senior
5 61 (7.20%) Architect
6 52 (6.14%) Consultant
7 50 (5.90%) Business Analyst
8 40 (4.72%) Project Manager
9 23 (2.72%) SAP Architect
10 21 (2.48%) Data Engineer
10 21 (2.48%) Senior Analyst
11 19 (2.24%) Product Owner
12 18 (2.13%) Delivery Manager
12 18 (2.13%) Java Developer
12 18 (2.13%) SAP S/4HANA Architect
13 15 (1.77%) IT Analyst
13 15 (1.77%) Scrum Master
14 14 (1.65%) Designer
15 13 (1.53%) Product Manager
15 13 (1.53%) Security Engineer
Libraries, Frameworks & Software Standards
1 38 (4.49%) Web Services
2 35 (4.13%) REST
2 35 (4.13%) Spring
3 29 (3.42%) RESTful
4 25 (2.95%) Kafka
5 24 (2.83%) Spring Boot
6 23 (2.72%) .NET
7 21 (2.48%) React
8 16 (1.89%) AngularJS
8 16 (1.89%) Node.js
8 16 (1.89%) SOAP
8 16 (1.89%) XML
9 12 (1.42%) OAuth
10 11 (1.30%) CSS
11 10 (1.18%) Hibernate
11 10 (1.18%) JSON
11 10 (1.18%) Middleware
12 9 (1.06%) GraphQL
12 9 (1.06%) HTML
12 9 (1.06%) JPA
Miscellaneous
1 80 (9.45%) Product Ownership
2 46 (5.43%) Onboarding
3 41 (4.84%) Cloud Native
4 29 (3.42%) Analytical Mindset
5 25 (2.95%) Management Information System
6 21 (2.48%) Distributed Systems
7 18 (2.13%) Foreign Exchange (FX)
8 17 (2.01%) Self-Motivation
9 16 (1.89%) Data Protection Act
10 15 (1.77%) Algorithms
10 15 (1.77%) Enterprise Software
11 13 (1.53%) Legacy Systems
12 12 (1.42%) Virtual Team
13 11 (1.30%) Mobile App
13 11 (1.30%) Security Posture
14 10 (1.18%) Cyber Defence
14 10 (1.18%) Fixed Income
14 10 (1.18%) PMI
15 9 (1.06%) Operational Technology
16 8 (0.94%) Reinsurance
Operating Systems
1 30 (3.54%) Linux
2 29 (3.42%) Windows
3 22 (2.60%) Unix
4 8 (0.94%) Mac OS
5 6 (0.71%) Android
6 5 (0.59%) Windows Server
7 4 (0.47%) VMS
8 3 (0.35%) Windows 10
9 2 (0.24%) Apple iOS
9 2 (0.24%) Red Hat Enterprise Linux
10 1 (0.12%) Solaris
10 1 (0.12%) tvOS
10 1 (0.12%) watchOS
Processes & Methodologies
1 318 (37.54%) Agile
2 271 (32.00%) Problem-Solving
3 182 (21.49%) Stakeholder Management
4 154 (18.18%) DevOps
5 143 (16.88%) CI/CD
6 130 (15.35%) Stakeholder Engagement
7 100 (11.81%) Decision-Making
8 94 (11.10%) Scrum
9 92 (10.86%) Roadmaps
10 91 (10.74%) Analytics
10 91 (10.74%) Project Delivery
11 85 (10.04%) Project Management
12 73 (8.62%) Mentoring
13 69 (8.15%) Change Management
14 66 (7.79%) Business Intelligence
15 63 (7.44%) AI
16 61 (7.20%) Microservices
17 59 (6.97%) Test Automation
18 58 (6.85%) Risk Management
19 53 (6.26%) Visualisation
Programming Languages
1 134 (15.82%) SQL
2 108 (12.75%) Python
3 79 (9.33%) Java
4 36 (4.25%) JavaScript
5 33 (3.90%) PowerShell
6 26 (3.07%) Bash
7 24 (2.83%) C#
8 17 (2.01%) TypeScript
9 10 (1.18%) C++
9 10 (1.18%) VBA
10 8 (0.94%) Kusto Query Language
10 8 (0.94%) PL/SQL
11 7 (0.83%) Korn
11 7 (0.83%) Shell Script
12 6 (0.71%) Groovy
13 5 (0.59%) Scala
14 4 (0.47%) Go
14 4 (0.47%) RPG
14 4 (0.47%) Ruby
15 3 (0.35%) PHP
Qualifications
1 113 (13.34%) Security Cleared
2 89 (10.51%) SC Cleared
3 79 (9.33%) Degree
4 38 (4.49%) PMI Certification
5 32 (3.78%) PMP
6 25 (2.95%) Computer Science Degree
7 14 (1.65%) Master's Degree
8 13 (1.53%) Azure Certification
9 12 (1.42%) BPSS Clearance
10 10 (1.18%) DV Cleared
11 8 (0.94%) AWS Certification
12 7 (0.83%) Cisco Certification
12 7 (0.83%) CISSP
12 7 (0.83%) ISTQB
12 7 (0.83%) ISTQB Foundation Certification
12 7 (0.83%) Microsoft Certification
13 6 (0.71%) ITIL Certification
14 5 (0.59%) AWS Certified Solutions Architect
14 5 (0.59%) SAP Certification
14 5 (0.59%) Six Sigma Green Belt
Quality Assurance & Compliance
1 63 (7.44%) QA
2 38 (4.49%) Accessibility
3 36 (4.25%) Data Quality
4 28 (3.31%) ISO/IEC 27001
5 26 (3.07%) GDPR
6 23 (2.72%) PMO
7 20 (2.36%) NIST
8 16 (1.89%) SLA
9 14 (1.65%) GRC
10 13 (1.53%) Sarbanes-Oxley
11 10 (1.18%) ITGC
12 9 (1.06%) COBIT
13 8 (0.94%) Actionable Recommendations
13 8 (0.94%) NCSC
14 7 (0.83%) HIPAA
14 7 (0.83%) MiFID
15 6 (0.71%) EMIR
15 6 (0.71%) ISO/IEC 27002 (supersedes ISO/IEC 17799)
15 6 (0.71%) SOX 404
16 5 (0.59%) PCI DSS
System Software
1 67 (7.91%) Docker
2 20 (2.36%) Active Directory
3 6 (0.71%) Virtual Machines
4 3 (0.35%) VMware Infrastructure
5 1 (0.12%) ProxySG
5 1 (0.12%) RACF
Systems Management
1 66 (7.79%) Kubernetes
2 43 (5.08%) Terraform
3 22 (2.60%) Ansible
4 20 (2.36%) Grafana
5 18 (2.13%) ITRS Geneos
6 17 (2.01%) Prometheus
7 13 (1.53%) Microsoft Intune
7 13 (1.53%) SCCM
8 6 (0.71%) Kibana
9 5 (0.59%) Control-M
10 4 (0.47%) Single Sign-On
10 4 (0.47%) WSUS
11 3 (0.35%) BladeLogic
11 3 (0.35%) QRadar
12 2 (0.24%) HP ALM
12 2 (0.24%) Jamf Pro
12 2 (0.24%) logstash
12 2 (0.24%) Systems Management Server (SMS)
13 1 (0.12%) Argo
13 1 (0.12%) Computer Emergency Response Teams
Vendors
1 142 (16.77%) Microsoft
2 60 (7.08%) SAP
3 48 (5.67%) Oracle
4 28 (3.31%) Google
5 26 (3.07%) Salesforce
6 23 (2.72%) Splunk
7 22 (2.60%) ServiceNow
8 19 (2.24%) Databricks
9 15 (1.77%) Dynatrace
10 9 (1.06%) TIBCO
11 8 (0.94%) Adobe
11 8 (0.94%) UiPath
12 7 (0.83%) Workday
13 6 (0.71%) CA Agile Central
13 6 (0.71%) Cisco
13 6 (0.71%) Guidewire
13 6 (0.71%) IBM
13 6 (0.71%) Informatica
13 6 (0.71%) Solace
14 5 (0.59%) Murex