ITIL Contracts in London

ITIL (Information Technology Infrastructure Library)
England > London

The table below provides summary statistics for contract job vacancies advertised in London requiring ITIL skills. It includes a benchmarking guide to the contractor rates offered in vacancies that cited ITIL over the 6 months leading up to 1 May 2025, comparing them to the same period in the previous two years.

6 months to
1 May 2025
Same period 2024 Same period 2023
Rank 77 59 72
Rank change year-on-year -18 +13 +5
Contract jobs citing ITIL 431 630 897
As % of all contract jobs advertised in London 3.43% 3.53% 3.32%
As % of the Processes & Methodologies category 3.73% 3.99% 3.64%
Number of daily rates quoted 267 431 643
10th Percentile £250 £206 £213
25th Percentile £400 £350 £363
Median daily rate (50th Percentile) £500 £500 £495
Median % change year-on-year - +1.01% -1.00%
75th Percentile £600 £623 £588
90th Percentile £690 £700 £700
England median daily rate £468 £500 £475
% change year-on-year -6.35% +5.26% +5.56%
Number of hourly rates quoted 13 10 11
10th Percentile - £16.00 £16.13
25th Percentile £20.24 £23.80 £18.75
Median hourly rate £26.45 £29.50 £22.63
Median % change year-on-year -10.34% +30.36% -30.37%
75th Percentile £34.00 £37.86 £27.81
90th Percentile £45.75 £65.00 £33.82
England median hourly rate £21.63 £17.69 £19.94
% change year-on-year +22.24% -11.29% +26.62%

All Process and Methodology Skills
London

ITIL falls under the Processes and Methodologies category. For comparison with the information above, the following table provides summary statistics for all contract job vacancies requiring process or methodology skills in London.

Contract vacancies with a requirement for process or methodology skills 11,564 15,790 24,631
As % of all contract IT jobs advertised in London 92.16% 88.55% 91.11%
Number of daily rates quoted 7,847 11,316 17,711
10th Percentile £350 £338 £375
25th Percentile £440 £450 £475
Median daily rate (50th Percentile) £550 £550 £590
Median % change year-on-year - -6.78% +2.61%
75th Percentile £688 £675 £700
90th Percentile £813 £800 £800
England median daily rate £525 £525 £550
% change year-on-year - -4.55% +2.33%
Number of hourly rates quoted 166 324 278
10th Percentile £16.17 £16.00 £18.59
25th Percentile £22.68 £20.00 £22.53
Median hourly rate £31.67 £29.50 £38.13
Median % change year-on-year +7.36% -22.62% +5.90%
75th Percentile £50.75 £47.56 £62.64
90th Percentile £63.75 £65.93 £76.78
England median hourly rate £29.07 £36.00 £37.50
% change year-on-year -19.25% -4.00% +53.06%

ITIL
Job Vacancy Trend in London

Job postings citing ITIL as a proportion of all IT jobs advertised in London.
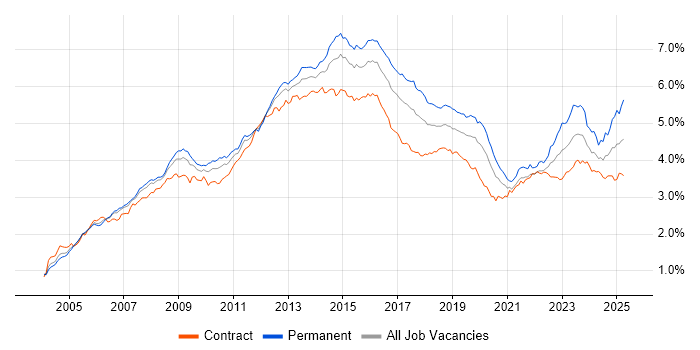
Job vacancy trend for ITIL in London

ITIL
Contractor Daily Rate Trend in London

3-month moving average daily rate quoted in jobs citing ITIL in London.

Daily rate trend for ITIL in London

ITIL
Daily Rate Histogram in London

Daily rate distribution for jobs citing ITIL in London over the 6 months to 1 May 2025.

Daily rate histogram for ITIL in London

ITIL
Contractor Hourly Rate Trend in London

3-month moving average hourly rates quoted in jobs citing ITIL in London.

Hourly rate trend for ITIL in London

ITIL
Hourly Rate Histogram in London

Hourly rate distribution of jobs citing ITIL in London over the 6 months to 1 May 2025.

Hourly rate histogram for ITIL in London

ITIL
Contract Job Locations in London

The table below looks at the demand and provides a guide to the median contractor rates quoted in IT jobs citing ITIL within the London region over the 6 months to 1 May 2025. The 'Rank Change' column provides an indication of the change in demand within each location based on the same 6 month period last year.

Location Rank Change
on Same Period
Last Year
Matching
Contract
IT Job Ads
Median
Daily Rate
Past 6 Months
Median Daily Rate
% Change
on Same Period
Last Year
Live
Jobs
Central London -1 75 £493 -10.45% 54
West London +18 15 £250 -37.50% 15
South London +8 13 £388 +55.10% 8
North London - 7 £285 - 2
East London +7 5 £585 +32.95% 9
ITIL
England

ITIL
Co-occurring Skills and Capabilities in London by Category

The follow tables expand on the table above by listing co-occurrences grouped by category. The same employment type, locality and period is covered with up to 20 co-occurrences shown in each of the following categories:

Application Platforms
1 26 (6.03%) Microsoft Exchange
1 26 (6.03%) SharePoint
2 12 (2.78%) Confluence
3 5 (1.16%) CMS
3 5 (1.16%) IIS
4 4 (0.93%) Oracle Workflow
4 4 (0.93%) SharePoint 2010
4 4 (0.93%) WebSphere
5 3 (0.70%) Skype for Business
6 2 (0.46%) Adobe Experience Manager
6 2 (0.46%) JBoss
6 2 (0.46%) WebSphere Application Server
7 1 (0.23%) Apache
7 1 (0.23%) nginx
7 1 (0.23%) Tomcat
Applications
1 25 (5.80%) Microsoft Office
2 23 (5.34%) Microsoft Excel
3 10 (2.32%) MS Visio
4 9 (2.09%) Microsoft PowerPoint
5 6 (1.39%) Microsoft Project
6 4 (0.93%) InfoPath
7 1 (0.23%) Camtasia
7 1 (0.23%) Final Cut Pro
Business Applications
1 6 (1.39%) Remedy ITSM
2 2 (0.46%) Dynamics CRM
2 2 (0.46%) Fidessa
2 2 (0.46%) Infor CloudSuite
3 1 (0.23%) Cloudability
3 1 (0.23%) Oracle Applications
3 1 (0.23%) SAP HCM
3 1 (0.23%) Shopify
3 1 (0.23%) Summit
Cloud Services
1 93 (21.58%) Azure
2 79 (18.33%) Microsoft 365
3 56 (12.99%) AWS
4 42 (9.74%) Entra ID
5 26 (6.03%) Power Platform
6 24 (5.57%) OneDrive
7 11 (2.55%) PowerApps
7 11 (2.55%) SaaS
8 10 (2.32%) Azure DevOps
8 10 (2.32%) GCP
9 9 (2.09%) Power Automate
10 7 (1.62%) Lucidchart
11 6 (1.39%) IaaS
11 6 (1.39%) Mimecast
12 5 (1.16%) Azure Monitor
13 4 (0.93%) GitHub
13 4 (0.93%) Google Workspace
13 4 (0.93%) OCI
13 4 (0.93%) PaaS
14 3 (0.70%) Cloud Computing
Communications & Networking
1 39 (9.05%) Firewall
2 27 (6.26%) VPN
3 20 (4.64%) DNS
4 17 (3.94%) DHCP
4 17 (3.94%) Network Security
5 16 (3.71%) BGP
5 16 (3.71%) OSPF
6 13 (3.02%) WAN
7 12 (2.78%) TCP/IP
8 11 (2.55%) MPLS
9 10 (2.32%) LAN
10 9 (2.09%) SAN
11 8 (1.86%) EIGRP
12 7 (1.62%) VoIP
12 7 (1.62%) Wi-Fi
13 6 (1.39%) Cisco IOS
13 6 (1.39%) VLAN
13 6 (1.39%) Wireless
14 5 (1.16%) RIP
14 5 (1.16%) Spanning Tree
Database & Business Intelligence
1 22 (5.10%) SQL Server
2 16 (3.71%) Power BI
3 7 (1.62%) MySQL
4 6 (1.39%) NoSQL
5 4 (0.93%) DB2
6 3 (0.70%) BusinessObjects
6 3 (0.70%) BusinessObjects Business Intelligence
6 3 (0.70%) Data Warehouse
6 3 (0.70%) Relational Database
6 3 (0.70%) Snowflake Schema
6 3 (0.70%) Tableau
7 2 (0.46%) Data Lake
7 2 (0.46%) Data Mart
7 2 (0.46%) DTS
7 2 (0.46%) IMS/DB
7 2 (0.46%) SQL Server Integration Services
7 2 (0.46%) SQL Server Reporting Services
7 2 (0.46%) Tableau Server
8 1 (0.23%) Data Hub
8 1 (0.23%) Data Mining
Development Applications
1 33 (7.66%) JIRA
2 7 (1.62%) Git
3 5 (1.16%) Jenkins
4 2 (0.46%) Bitbucket
4 2 (0.46%) Maven
5 1 (0.23%) GitLab
5 1 (0.23%) Selenium
5 1 (0.23%) Visual Studio
General
1 165 (38.28%) Social Skills
2 98 (22.74%) Finance
3 85 (19.72%) Analytical Skills
4 56 (12.99%) Public Sector
5 39 (9.05%) Banking
6 16 (3.71%) Law
6 16 (3.71%) Legal
7 13 (3.02%) Documentation Skills
7 13 (3.02%) Inclusion and Diversity
8 11 (2.55%) Organisational Skills
9 10 (2.32%) Influencing Skills
10 9 (2.09%) Financial Institution
10 9 (2.09%) Front Office
10 9 (2.09%) Local Government
10 9 (2.09%) Retail
10 9 (2.09%) Telecoms
11 8 (1.86%) Presentation Skills
12 6 (1.39%) Back Office
12 6 (1.39%) Investment Banking
12 6 (1.39%) Marketing
Job Titles
1 61 (14.15%) Analyst
1 61 (14.15%) Architect
2 53 (12.30%) Senior
3 44 (10.21%) Service Manager
4 31 (7.19%) Consultant
5 24 (5.57%) Lead
5 24 (5.57%) Project Manager
6 19 (4.41%) Network Engineer
7 17 (3.94%) Developer
8 16 (3.71%) Solutions Architect
9 15 (3.48%) Business Analyst
9 15 (3.48%) Support Engineer
10 14 (3.25%) IT Manager
10 14 (3.25%) Service Delivery Manager
11 13 (3.02%) Applications Support
11 13 (3.02%) Delivery Manager
11 13 (3.02%) Senior Architect
11 13 (3.02%) Service Analyst
11 13 (3.02%) Service Desk Analyst
11 13 (3.02%) ServiceNow Architect
Libraries, Frameworks & Software Standards
1 17 (3.94%) Web Services
2 15 (3.48%) CSS
3 13 (3.02%) HTML
4 11 (2.55%) REST
5 10 (2.32%) SOAP
6 9 (2.09%) .NET
6 9 (2.09%) AngularJS
7 8 (1.86%) LDAP
7 8 (1.86%) RESTful
7 8 (1.86%) XML
8 6 (1.39%) OAuth
8 6 (1.39%) SAML
9 5 (1.16%) Bootstrap
9 5 (1.16%) Node.js
10 4 (0.93%) 802.1X
10 4 (0.93%) Ajax
10 4 (0.93%) J2EE
10 4 (0.93%) Middleware
10 4 (0.93%) Oracle Fusion
10 4 (0.93%) WebSphere MQ
Miscellaneous
1 19 (4.41%) CMDB
1 19 (4.41%) Data Centre
2 16 (3.71%) Onboarding
3 10 (2.32%) Management Information System
4 9 (2.09%) Product Ownership
5 8 (1.86%) Public Cloud
6 7 (1.62%) Data Protection Act
7 6 (1.39%) Hybrid Cloud
7 6 (1.39%) PKI
7 6 (1.39%) Private Cloud
7 6 (1.39%) Self-Motivation
8 5 (1.16%) IVR
8 5 (1.16%) Legacy Systems
8 5 (1.16%) NHS
8 5 (1.16%) Replication
8 5 (1.16%) Video Conferencing
9 4 (0.93%) AI Agents
9 4 (0.93%) Analytical Mindset
9 4 (0.93%) Driving Licence
9 4 (0.93%) Enterprise Software
Operating Systems
1 88 (20.42%) Windows
2 25 (5.80%) Linux
3 22 (5.10%) Windows Server
4 21 (4.87%) Windows 10
5 20 (4.64%) Unix
6 11 (2.55%) Apple iOS
7 8 (1.86%) Android
7 8 (1.86%) Mac OS
8 6 (1.39%) VMS
9 5 (1.16%) CatOS
10 3 (0.70%) Windows Server 2016
11 2 (0.46%) CentOS
11 2 (0.46%) Mac OS X
11 2 (0.46%) Rocky
11 2 (0.46%) Windows Server 2019
12 1 (0.23%) SUSE
12 1 (0.23%) Windows Server 2012
Processes & Methodologies
1 143 (33.18%) Service Management
2 116 (26.91%) ITSM
3 107 (24.83%) Agile
3 107 (24.83%) Problem-Solving
4 73 (16.94%) Project Management
5 64 (14.85%) Stakeholder Management
6 60 (13.92%) Service Delivery
7 59 (13.69%) Change Management
8 53 (12.30%) Continuous Improvement
9 52 (12.06%) Migration
10 46 (10.67%) Incident Management
11 44 (10.21%) Customer Service
11 44 (10.21%) Roadmaps
12 39 (9.05%) DevOps
13 34 (7.89%) Problem Management
13 34 (7.89%) Risk Management
13 34 (7.89%) Stakeholder Engagement
14 31 (7.19%) Business Continuity
15 29 (6.73%) Cybersecurity
15 29 (6.73%) Project Delivery
Programming Languages
1 49 (11.37%) PowerShell
2 42 (9.74%) SQL
3 27 (6.26%) Python
4 24 (5.57%) JavaScript
5 12 (2.78%) Java
6 6 (1.39%) Bash
6 6 (1.39%) PL/SQL
7 4 (0.93%) Shell Script
8 3 (0.70%) ActionScript
8 3 (0.70%) Perl
9 2 (0.46%) REXX
10 1 (0.23%) ActionScript 2.0
10 1 (0.23%) Bicep
10 1 (0.23%) C
10 1 (0.23%) C#
10 1 (0.23%) Kusto Query Language
10 1 (0.23%) PHP
10 1 (0.23%) T-SQL
Qualifications
1 85 (19.72%) Security Cleared
2 67 (15.55%) Degree
3 65 (15.08%) SC Cleared
4 32 (7.42%) ITIL Certification
5 23 (5.34%) PMP
6 21 (4.87%) PMI Certification
7 19 (4.41%) Cisco Certification
8 12 (2.78%) DV Cleared
8 12 (2.78%) Microsoft Certification
9 11 (2.55%) AWS Certification
9 11 (2.55%) Computer Science Degree
10 10 (2.32%) CCNP
11 8 (1.86%) A+ Certification
11 8 (1.86%) Azure Certification
11 8 (1.86%) CCNA
12 7 (1.62%) CISSP
13 6 (1.39%) ITIL Foundation Certificate
14 5 (1.16%) CCIE
14 5 (1.16%) CISA
14 5 (1.16%) CRISC
Quality Assurance & Compliance
1 28 (6.50%) SLA
2 22 (5.10%) QA
3 15 (3.48%) ISO/IEC 27001
4 9 (2.09%) ISO/IEC 20000
5 7 (1.62%) Data Quality
6 6 (1.39%) COBIT
6 6 (1.39%) NIST
7 5 (1.16%) Cyber Essentials
7 5 (1.16%) GDPR
8 4 (0.93%) Government Security Classifications
9 3 (0.70%) GRC
9 3 (0.70%) PCI DSS
10 2 (0.46%) Accessibility
10 2 (0.46%) DICOM
10 2 (0.46%) EMIR
10 2 (0.46%) HL7
10 2 (0.46%) ISO 22301
10 2 (0.46%) MiFID
11 1 (0.23%) Actionable Recommendations
11 1 (0.23%) COSO
System Software
1 77 (17.87%) Active Directory
2 16 (3.71%) Virtual Desktop
2 16 (3.71%) VMware Infrastructure
3 7 (1.62%) Docker
3 7 (1.62%) Hyper-V
3 7 (1.62%) Virtual Machines
4 4 (0.93%) KVM
5 3 (0.70%) Microsoft App-V
5 3 (0.70%) Virtual Servers
5 3 (0.70%) VMware ESXi
5 3 (0.70%) vSphere
6 2 (0.46%) Firmware
6 2 (0.46%) VMware Workstation
7 1 (0.23%) BitLocker
7 1 (0.23%) XenApp
Systems Management
1 46 (10.67%) Microsoft Intune
2 27 (6.26%) SCCM
3 11 (2.55%) Kubernetes
4 10 (2.32%) Ansible
5 9 (2.09%) Terraform
6 8 (1.86%) Single Sign-On
7 6 (1.39%) ZABBIX
8 4 (0.93%) HP ALM
9 3 (0.70%) ITRS Geneos
9 3 (0.70%) WSUS
10 2 (0.46%) AirWatch
10 2 (0.46%) Cisco Prime
10 2 (0.46%) Jamf Pro
10 2 (0.46%) Puppet
10 2 (0.46%) Rancher
10 2 (0.46%) Rundeck
10 2 (0.46%) Symantec Enterprise Vault
11 1 (0.23%) OfficeScan
11 1 (0.23%) Perfmon
11 1 (0.23%) Trend Micro Deep Security
Vendors
1 115 (26.68%) Microsoft
2 102 (23.67%) ServiceNow
3 33 (7.66%) Cisco
4 19 (4.41%) VMware
5 17 (3.94%) Oracle
6 14 (3.25%) SAP
7 12 (2.78%) Google
8 10 (2.32%) Apple
8 10 (2.32%) Citrix
8 10 (2.32%) IBM
9 9 (2.09%) Bloomberg
10 8 (1.86%) CheckPoint
10 8 (1.86%) HP
10 8 (1.86%) Juniper
10 8 (1.86%) Remedy
10 8 (1.86%) SolarWinds
10 8 (1.86%) Splunk
11 6 (1.39%) Fortinet
11 6 (1.39%) Palo Alto
11 6 (1.39%) Reuters