Data-Driven Decision Making Jobs in England

Data-Driven Decision Making
UK > England

The table below provides summary statistics for permanent job vacancies advertised in England requiring Data-Driven Decision Making skills. It includes a benchmarking guide to the annual salaries offered in vacancies that cited Data-Driven Decision Making over the 6 months leading up to 4 May 2025, comparing them to the same period in the previous two years.

6 months to
4 May 2025
Same period 2024 Same period 2023
Rank 231 421 439
Rank change year-on-year +190 +18 +111
Permanent jobs citing Data-Driven Decision Making 629 471 619
As % of all permanent jobs advertised in England 1.35% 0.55% 0.67%
As % of the Processes & Methodologies category 1.44% 0.64% 0.70%
Number of salaries quoted 321 369 159
10th Percentile £40,000 £36,250 £40,000
25th Percentile £51,250 £47,500 £51,250
Median annual salary (50th Percentile) £62,500 £57,500 £60,500
Median % change year-on-year +8.70% -4.96% +10.00%
75th Percentile £82,500 £78,750 £77,500
90th Percentile £102,500 £87,500 £86,500
UK median annual salary £62,500 £57,500 £60,000
% change year-on-year +8.70% -4.17% +9.09%

All Process and Methodology Skills
England

Data-Driven Decision Making falls under the Processes and Methodologies category. For comparison with the information above, the following table provides summary statistics for all permanent job vacancies requiring process or methodology skills in England.

Permanent vacancies with a requirement for process or methodology skills 43,566 73,204 88,358
As % of all permanent jobs advertised in England 93.64% 85.81% 95.63%
Number of salaries quoted 23,957 53,948 52,209
10th Percentile £30,500 £29,000 £34,296
25th Percentile £42,500 £40,000 £45,783
Median annual salary (50th Percentile) £57,500 £55,000 £62,500
Median % change year-on-year +4.55% -12.00% +4.17%
75th Percentile £77,000 £73,750 £82,500
90th Percentile £100,000 £93,750 £101,185
UK median annual salary £57,500 £55,000 £61,500
% change year-on-year +4.55% -10.57% +2.50%

Data-Driven Decision Making
Job Vacancy Trend in England

Job postings citing Data-Driven Decision Making as a proportion of all IT jobs advertised in England.
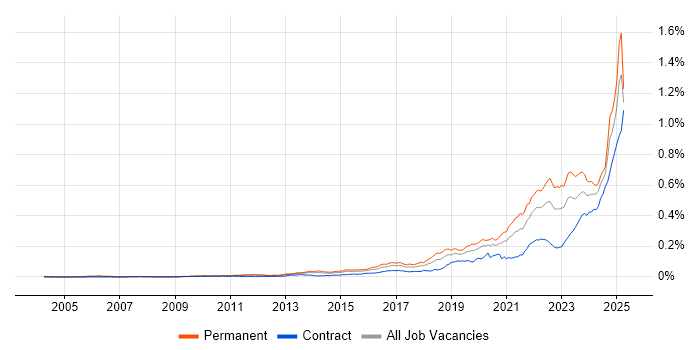
Job vacancy trend for Data-Driven Decision Making in England

Data-Driven Decision Making
Salary Trend in England

3-month moving average salary quoted in jobs citing Data-Driven Decision Making in England.

Salary trend for Data-Driven Decision Making in England

Data-Driven Decision Making
Salary Histogram in England

Salary distribution for jobs citing Data-Driven Decision Making in England over the 6 months to 4 May 2025.

Salary histogram for Data-Driven Decision Making in England

Data-Driven Decision Making
Job Locations in England

The table below looks at the demand and provides a guide to the median salaries quoted in IT jobs citing Data-Driven Decision Making within the England region over the 6 months to 4 May 2025. The 'Rank Change' column provides an indication of the change in demand within each location based on the same 6 month period last year.

Location Rank Change
on Same Period
Last Year
Matching
Permanent
IT Job Ads
Median Salary
Past 6 Months
Median Salary
% Change
on Same Period
Last Year
Live
Jobs
London +147 267 £75,000 +3.45% 600
North of England +97 114 £58,750 +14.63% 96
Midlands +92 84 £57,500 +4.55% 47
South East +87 82 £57,500 +9.42% 173
North West +40 82 £65,000 +13.04% 66
West Midlands +80 67 £57,500 +4.55% 33
South West +133 46 £52,500 -16.00% 36
Yorkshire +92 28 £57,500 +15.00% 25
East of England +57 20 £52,500 +17.32% 37
East Midlands +44 17 £57,500 +17.95% 9
North East +45 4 £57,500 +15.00% 5
Data-Driven Decision Making
UK

Data-Driven Decision Making
Co-occurring Skills and Capabilities in England by Category

The follow tables expand on the table above by listing co-occurrences grouped by category. The same employment type, locality and period is covered with up to 20 co-occurrences shown in each of the following categories:

Application Platforms
1 23 (3.66%) Jupyter
2 13 (2.07%) Apache Spark
3 10 (1.59%) IBM Domino
4 9 (1.43%) Apache
5 6 (0.95%) SharePoint
6 4 (0.64%) CMS
7 3 (0.48%) Apache Airflow
8 2 (0.32%) Confluence
8 2 (0.32%) Drupal
9 1 (0.16%) Umbraco
Applications
1 143 (22.73%) Microsoft Office
2 56 (8.90%) Microsoft Excel
3 4 (0.64%) Microsoft PowerPoint
4 2 (0.32%) Trello
5 1 (0.16%) Chatbot
5 1 (0.16%) MS Visio
5 1 (0.16%) Notion
5 1 (0.16%) Simulink
Business Applications
1 11 (1.75%) Salesforce CRM
2 10 (1.59%) Raiser’s Edge
3 3 (0.48%) NetSuite
3 3 (0.48%) Oracle EBS
3 3 (0.48%) Oracle ERP
3 3 (0.48%) SAP S/4HANA
4 2 (0.32%) Dynamics CRM
4 2 (0.32%) Dynamics GP
5 1 (0.16%) iTrent
5 1 (0.16%) Sparx Enterprise Architect
5 1 (0.16%) Sprinklr
5 1 (0.16%) Workday HCM
Cloud Services
1 104 (16.53%) Power Platform
2 94 (14.94%) Azure
3 32 (5.09%) AWS
4 27 (4.29%) SaaS
5 25 (3.97%) Google Analytics
6 20 (3.18%) Azure Data Factory
7 14 (2.23%) GCP
7 14 (2.23%) Snowflake
8 13 (2.07%) Microsoft 365
9 12 (1.91%) Google Ads
10 9 (1.43%) Miro
10 9 (1.43%) Power Automate
11 8 (1.27%) Dynamics 365
12 7 (1.11%) AWS Lambda
12 7 (1.11%) Azure Synapse Analytics
12 7 (1.11%) dbt
12 7 (1.11%) Google Sheets
12 7 (1.11%) Serverless
13 6 (0.95%) Azure DevOps
13 6 (0.95%) Datadog
Communications & Networking
1 5 (0.79%) LoRaWAN
1 5 (0.79%) SMS
2 4 (0.64%) Firewall
2 4 (0.64%) Internet
2 4 (0.64%) Intrusion Detection
2 4 (0.64%) Network Security
2 4 (0.64%) VPN
2 4 (0.64%) Wi-Fi
3 1 (0.16%) 5G
3 1 (0.16%) Broadband
3 1 (0.16%) Intranet
3 1 (0.16%) Modbus
3 1 (0.16%) MQTT
3 1 (0.16%) WPA
Database & Business Intelligence
1 103 (16.38%) Power BI
2 55 (8.74%) Data Warehouse
3 36 (5.72%) Tableau
4 34 (5.41%) SQL Server
5 33 (5.25%) Big Data
6 21 (3.34%) Data Lake
7 15 (2.38%) SQL Server Integration Services
8 9 (1.43%) Azure SQL Database
8 9 (1.43%) Data Hub
9 8 (1.27%) BigQuery
9 8 (1.27%) Metadata
10 7 (1.11%) SQL Server Reporting Services
11 5 (0.79%) Amazon Redshift
11 5 (0.79%) Looker
11 5 (0.79%) NoSQL
12 4 (0.64%) Data Mining
12 4 (0.64%) MS Access
12 4 (0.64%) Oracle Reports
12 4 (0.64%) TimescaleDB
13 3 (0.48%) MySQL
Development Applications
1 24 (3.82%) JIRA
2 6 (0.95%) Octopus Deploy
3 5 (0.79%) Git
4 4 (0.64%) Jenkins
4 4 (0.64%) Visual Studio
5 2 (0.32%) Cucumber
5 2 (0.32%) ERwin
5 2 (0.32%) JUnit
5 2 (0.32%) Selenium
5 2 (0.32%) TestNG
5 2 (0.32%) TestRail
6 1 (0.16%) ER Studio
6 1 (0.16%) GitLab
General
1 332 (52.78%) Social Skills
2 262 (41.65%) Finance
3 199 (31.64%) Marketing
4 159 (25.28%) Analytical Skills
5 139 (22.10%) Legal
6 65 (10.33%) Law
7 49 (7.79%) Retail
8 32 (5.09%) Inclusion and Diversity
9 24 (3.82%) Banking
10 19 (3.02%) Manufacturing
11 13 (2.07%) Influencing Skills
12 12 (1.91%) Public Sector
13 11 (1.75%) Advertising
14 10 (1.59%) Games
15 8 (1.27%) Aviation
15 8 (1.27%) Front Office
15 8 (1.27%) Organisational Skills
16 7 (1.11%) Presentation Skills
17 6 (0.95%) Agriculture
18 5 (0.79%) Telecoms
Job Titles
1 123 (19.55%) Customer Executive
2 81 (12.88%) Lead
3 76 (12.08%) Senior
4 60 (9.54%) Analyst
5 47 (7.47%) Product Manager
6 40 (6.36%) Developer
7 32 (5.09%) Data Scientist
8 29 (4.61%) Data Engineer
9 24 (3.82%) Senior Data Scientist
10 22 (3.50%) SQL Developer
11 18 (2.86%) Data Analyst
12 16 (2.54%) Data Analytics Director
12 16 (2.54%) Database Developer
12 16 (2.54%) IT Manager
12 16 (2.54%) SQL Database Developer
13 15 (2.38%) Product Owner
14 12 (1.91%) Senior Manager
15 11 (1.75%) Data Manager
16 10 (1.59%) Database Manager
17 9 (1.43%) Junior
Libraries, Frameworks & Software Standards
1 10 (1.59%) .NET
2 7 (1.11%) HTML
2 7 (1.11%) RESTful
3 6 (0.95%) NestJS
3 6 (0.95%) React
4 5 (0.79%) CSS
4 5 (0.79%) XML
5 4 (0.64%) EDI
5 4 (0.64%) Node.js
6 3 (0.48%) Oracle Fusion
6 3 (0.48%) Pandas
6 3 (0.48%) REST
7 2 (0.32%) GraphQL
7 2 (0.32%) NumPy
7 2 (0.32%) Pyramid
7 2 (0.32%) React Native
7 2 (0.32%) scikit-learn
7 2 (0.32%) TensorFlow
8 1 (0.16%) NetworkX
8 1 (0.16%) Tailwind CSS
Miscellaneous
1 67 (10.65%) Product Ownership
2 33 (5.25%) FMCG
3 27 (4.29%) Algorithms
4 26 (4.13%) Analytical Mindset
5 23 (3.66%) Cyberattack
6 21 (3.34%) Management Information System
7 20 (3.18%) Self-Motivation
8 15 (2.38%) Social Media
9 13 (2.07%) IoT
10 12 (1.91%) Cloud Native
11 9 (1.43%) Renewable Energy
12 7 (1.11%) Data Structures
12 7 (1.11%) Onboarding
13 6 (0.95%) Legacy Systems
13 6 (0.95%) Mobile Games
14 5 (0.79%) Credit Risk
14 5 (0.79%) Operational Technology
15 4 (0.64%) Greenfield Project
15 4 (0.64%) Life Science
15 4 (0.64%) Security Posture
Operating Systems
1 5 (0.79%) Windows
1 5 (0.79%) Windows Server
2 3 (0.48%) Linux
3 2 (0.32%) Unix
4 1 (0.16%) VMS
Processes & Methodologies
1 511 (81.24%) Decision-Making
2 231 (36.72%) Analytics
3 184 (29.25%) Problem-Solving
4 145 (23.05%) Business Intelligence
5 136 (21.62%) Business Development
6 124 (19.71%) Contract Negotiation
6 124 (19.71%) Roadmaps
7 112 (17.81%) Visualisation
8 101 (16.06%) Continuous Improvement
9 100 (15.90%) Artificial Intelligence
10 98 (15.58%) Agile
11 96 (15.26%) Data Governance
12 94 (14.94%) Data Analysis
13 92 (14.63%) Actionable Insight
14 82 (13.04%) Data Science
15 81 (12.88%) Machine Learning
16 80 (12.72%) Project Management
17 76 (12.08%) Data Strategy
18 71 (11.29%) Stakeholder Management
19 61 (9.70%) Computer Science
Programming Languages
1 133 (21.14%) SQL
2 93 (14.79%) Python
3 33 (5.25%) T-SQL
4 32 (5.09%) JavaScript
5 28 (4.45%) Java
6 10 (1.59%) R
7 6 (0.95%) TypeScript
8 5 (0.79%) C#
8 5 (0.79%) Data Analysis Expressions
8 5 (0.79%) VBA
9 4 (0.64%) PHP
10 3 (0.48%) Scala
10 3 (0.48%) VB
11 2 (0.32%) C++
11 2 (0.32%) PowerShell
12 1 (0.16%) F#
12 1 (0.16%) Lisp
12 1 (0.16%) MATLAB
12 1 (0.16%) SPARQL
12 1 (0.16%) VBScript
Qualifications
1 148 (23.53%) Degree
2 34 (5.41%) Computer Science Degree
3 27 (4.29%) Security Cleared
4 25 (3.97%) DV Cleared
5 21 (3.34%) DBS Check
6 10 (1.59%) BPSS Clearance
6 10 (1.59%) Master's Degree
7 8 (1.27%) Azure Certification
8 6 (0.95%) Six Sigma Black Belt
9 5 (0.79%) Microsoft Certification
9 5 (0.79%) PMI Certification
9 5 (0.79%) PMP
10 4 (0.64%) ACCA
10 4 (0.64%) HND
11 3 (0.48%) Numerate Degree
11 3 (0.48%) SC Cleared
12 2 (0.32%) CCAB
12 2 (0.32%) CIMA
12 2 (0.32%) ISTQB Advanced Certification
12 2 (0.32%) Tableau Certification
Quality Assurance & Compliance
1 49 (7.79%) Data Quality
2 34 (5.41%) GDPR
3 32 (5.09%) Accessibility
4 17 (2.70%) QA
5 8 (1.27%) Cyber Essentials
6 5 (0.79%) Actionable Recommendations
7 3 (0.48%) PCI DSS
8 2 (0.32%) IEC 62304
8 2 (0.32%) ISO 13485
8 2 (0.32%) ISO/IEC 27001
8 2 (0.32%) SLA
9 1 (0.16%) GRC
9 1 (0.16%) MiFID
9 1 (0.16%) NCSC
9 1 (0.16%) NIST
9 1 (0.16%) PSD2
System Software
1 35 (5.56%) Docker
2 5 (0.79%) VMware Infrastructure
3 4 (0.64%) Hyper-V
4 1 (0.16%) Active Directory
4 1 (0.16%) HDFS
Systems Management
1 29 (4.61%) Kubernetes
2 4 (0.64%) FortiGate
3 3 (0.48%) Ansible
4 2 (0.32%) Grafana
4 2 (0.32%) Prometheus
5 1 (0.16%) Matomo
5 1 (0.16%) Terraform
Vendors
1 164 (26.07%) Salesforce
2 107 (17.01%) Microsoft
3 43 (6.84%) Google
4 24 (3.82%) Databricks
4 24 (3.82%) SAP
5 8 (1.27%) Informatica
6 6 (0.95%) Adobe
6 6 (0.95%) HubSpot
6 6 (0.95%) Oracle
7 5 (0.79%) VMware
8 4 (0.64%) Fortinet
8 4 (0.64%) ServiceNow
8 4 (0.64%) Zoho
9 3 (0.48%) Xero
10 2 (0.32%) Tealium
10 2 (0.32%) Workday
11 1 (0.16%) BeyondTrust
11 1 (0.16%) Hotjar
11 1 (0.16%) Nimble Storage
11 1 (0.16%) Snow