Unified Communications
UK > England
The table below provides summary statistics and salary benchmarking for jobs advertised in England requiring Unified Communications skills. It covers permanent job vacancies from the 6 months leading up to 22 February 2026, with comparisons to the same periods in the previous two years.
| 6 months to 22 Feb 2026 |
Same period 2025 | Same period 2024 | |
|---|---|---|---|
| Rank | 431 | 580 | 569 |
| Rank change year-on-year | +149 | -11 | +146 |
| Permanent jobs citing Unified Communications | 201 | 75 | 199 |
| As % of all permanent jobs in England | 0.33% | 0.17% | 0.30% |
| As % of the Communications & Networking category | 2.20% | 1.25% | 2.16% |
| Number of salaries quoted | 109 | 49 | 153 |
| 10th Percentile | £30,000 | £39,778 | £24,450 |
| 25th Percentile | £36,750 | £46,250 | £40,000 |
| Median annual salary (50th Percentile) | £45,000 | £65,000 | £60,000 |
| Median % change year-on-year | -30.77% | +8.33% | +15.57% |
| 75th Percentile | £53,750 | £92,500 | £71,757 |
| 90th Percentile | £62,500 | £97,500 | £85,000 |
| UK median annual salary | £45,000 | £65,000 | £55,000 |
| % change year-on-year | -30.77% | +18.18% | +5.94% |
All Communications and Computer Networking Skills
England
Unified Communications falls under the Communications and Computer Networking category. For comparison with the information above, the following table provides summary statistics for all permanent job vacancies requiring communications or computer networking skills in England.
| Permanent vacancies with a requirement for communications or computer networking skills | 9,149 | 5,991 | 9,230 |
| As % of all permanent jobs advertised in England | 15.04% | 13.75% | 13.80% |
| Number of salaries quoted | 3,538 | 3,255 | 7,608 |
| 10th Percentile | £26,250 | £30,750 | £26,500 |
| 25th Percentile | £29,000 | £40,000 | £32,750 |
| Median annual salary (50th Percentile) | £41,375 | £55,000 | £50,000 |
| Median % change year-on-year | -24.77% | +10.00% | -2.91% |
| 75th Percentile | £65,000 | £72,500 | £65,000 |
| 90th Percentile | £83,750 | £88,750 | £80,000 |
| UK median annual salary | £40,000 | £55,000 | £49,000 |
| % change year-on-year | -27.27% | +12.24% | -6.67% |
Unified Communications
Job Vacancy Trend in England
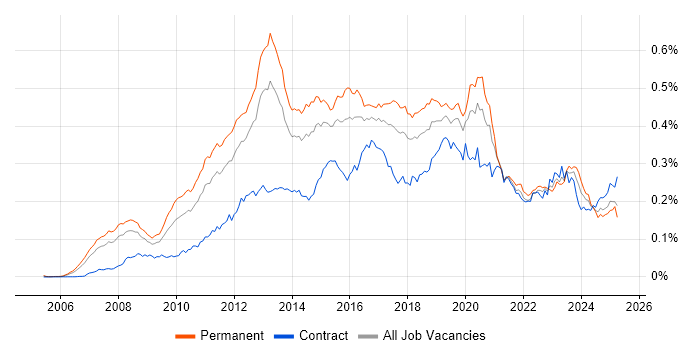
Historical trend showing the proportion of permanent IT job postings citing Unified Communications relative to all permanent IT jobs advertised in England.

Unified Communications
Salary Trend in England
Salary distribution trend for jobs in England citing Unified Communications.

Unified Communications
Salary Histogram in England
Salary distribution for jobs citing Unified Communications in England over the 6 months to 22 February 2026.
Unified Communications
Job Locations in England
The table below looks at the demand and provides a guide to the median salaries quoted in IT jobs citing Unified Communications within the England region over the 6 months to 22 February 2026. The 'Rank Change' column provides an indication of the change in demand within each location based on the same 6 month period last year.
| Location | Rank Change on Same Period Last Year |
Matching Permanent IT Job Ads |
Median Salary Past 6 Months |
Median Salary % Change on Same Period Last Year |
Live Jobs |
|---|---|---|---|---|---|
| South East | +90 | 95 | £42,500 | -27.66% | 13 |
| North of England | +27 | 52 | £60,000 | +9.09% | 7 |
| North West | +26 | 33 | £60,000 | +9.09% | 2 |
| London | +24 | 23 | £38,500 | -54.71% | 13 |
| Yorkshire | -15 | 17 | £41,250 | - | 5 |
| Midlands | +16 | 15 | £42,500 | -29.17% | 8 |
| West Midlands | +29 | 14 | £42,500 | -29.17% | 5 |
| East of England | +19 | 9 | £27,500 | -31.25% | 2 |
| South West | -19 | 4 | £47,500 | -6.86% | 3 |
| North East | - | 2 | - | - | |
| East Midlands | - | 1 | £32,500 | - | 3 |
| Unified Communications UK |
|||||
Unified Communications
Co-Occurring Skills & Capabilities in England by Category
The following tables expand on the one above by listing co-occurrences grouped by category. They cover the same employment type, locality and period, with up to 20 co-occurrences shown in each category:
|
|
||||||||||||||||||||||||||||||||||||||||||||||||||||||||||||||||||||||||||||||||||||||||||||||||||||||
|
|
||||||||||||||||||||||||||||||||||||||||||||||||||||||||||||||||||||||||||||||||||||||||||||||||||||||
|
|
||||||||||||||||||||||||||||||||||||||||||||||||||||||||||||||||||||||||||||||||||||||||||||||||||||||
|
|
||||||||||||||||||||||||||||||||||||||||||||||||||||||||||||||||||||||||||||||||||||||||||||||||||||||
|
|
||||||||||||||||||||||||||||||||||||||||||||||||||||||||||||||||||||||||||||||||||||||||||||||||||||||
|
|
||||||||||||||||||||||||||||||||||||||||||||||||||||||||||||||||||||||||||||||||||||||||||||||||||||||
|
|
||||||||||||||||||||||||||||||||||||||||||||||||||||||||||||||||||||||||||||||||||||||||||||||||||||||
|
|
||||||||||||||||||||||||||||||||||||||||||||||||||||||||||||||||||||||||||||||||||||||||||||||||||||||
|
|
||||||||||||||||||||||||||||||||||||||||||||||||||||||||||||||||||||||||||||||||||||||||||||||||||||||
|
|||||||||||||||||||||||||||||||||||||||||||||||||||||||||||||||||||||||||||||||||||||||||||||||||||||||
