Presales Jobs in England

Presales
UK > England

The table below provides summary statistics for permanent job vacancies advertised in England requiring Presales skills. It includes a benchmarking guide to the annual salaries offered in vacancies that cited Presales over the 6 months leading up to 26 July 2024, comparing them to the same period in the previous two years.

6 months to
26 Jul 2024
Same period 2023 Same period 2022
Rank 173 157 301
Rank change year-on-year -16 +144 -104
Permanent jobs citing Presales 1,257 1,600 2,051
As % of all permanent jobs advertised in England 1.60% 2.25% 1.40%
As % of the Processes & Methodologies category 1.96% 2.36% 1.45%
Number of salaries quoted 748 646 1,283
10th Percentile £24,500 £43,500 £42,500
25th Percentile £38,000 £57,500 £52,500
Median annual salary (50th Percentile) £61,500 £75,000 £70,000
Median % change year-on-year -18.00% +7.14% -
75th Percentile £85,000 £91,250 £91,875
90th Percentile £97,500 £112,500 £111,250
UK median annual salary £61,500 £75,000 £72,500
% change year-on-year -18.00% +3.45% +3.57%

All Process and Methodology Skills
England

Presales falls under the Processes and Methodologies category. For comparison with the information above, the following table provides summary statistics for all permanent job vacancies requiring process or methodology skills in England.

Permanent vacancies with a requirement for process or methodology skills 64,248 67,718 141,741
As % of all permanent jobs advertised in England 81.99% 95.27% 96.41%
Number of salaries quoted 43,335 45,004 76,070
10th Percentile £30,000 £33,750 £33,515
25th Percentile £40,000 £45,000 £44,500
Median annual salary (50th Percentile) £55,000 £62,000 £60,000
Median % change year-on-year -11.29% +3.33% +4.35%
75th Percentile £75,000 £81,250 £80,000
90th Percentile £95,000 £101,185 £97,500
UK median annual salary £55,000 £60,000 £60,000
% change year-on-year -8.33% - +9.09%

Presales
Job Vacancy Trend in England

Job postings citing Presales as a proportion of all IT jobs advertised in England.
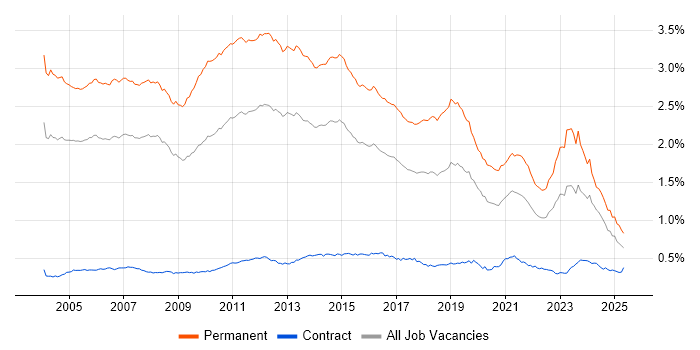
Job vacancy trend for Presales in England

Presales
Salary Trend in England

3-month moving average salary quoted in jobs citing Presales in England.

Salary trend for Presales in England

Presales
Salary Histogram in England

Salary distribution for jobs citing Presales in England over the 6 months to 26 July 2024.

Salary histogram for Presales in England

Presales
Job Locations in England

The table below looks at the demand and provides a guide to the median salaries quoted in IT jobs citing Presales within the England region over the 6 months to 26 July 2024. The 'Rank Change' column provides an indication of the change in demand within each location based on the same 6 month period last year.

Location Rank Change
on Same Period
Last Year
Matching
Permanent
IT Job Ads
Median Salary
Past 6 Months
Median Salary
% Change
on Same Period
Last Year
Live
Jobs
London -47 346 £80,000 -3.03% 52
South East +56 332 £45,000 -25.00% 46
North of England -40 218 £62,500 - 27
Midlands -5 169 £65,000 -5.45% 20
North West -33 162 £62,500 -5.66% 10
South West +8 120 £56,250 -29.69% 21
West Midlands +38 109 £72,500 +11.54% 17
Yorkshire +26 64 £75,000 +30.43% 11
East of England +16 56 £57,500 +7.98% 12
East Midlands -57 56 £60,000 -14.29% 3
North East -17 4 £62,500 +83.82% 6
Presales
UK

Presales
Co-occurring Skills and Capabilities in England by Category

The follow tables expand on the table above by listing co-occurrences grouped by category. The same employment type, locality and period is covered with up to 20 co-occurrences shown in each of the following categories:

Application Platforms
1 84 (6.68%) SharePoint
2 40 (3.18%) Microsoft Exchange
3 29 (2.31%) CMS
3 29 (2.31%) Umbraco
4 26 (2.07%) Headless CMS
4 26 (2.07%) IIS
4 26 (2.07%) Kentico
4 26 (2.07%) Sitecore CMS
5 4 (0.32%) Apache
5 4 (0.32%) Apache Airflow
5 4 (0.32%) Apache Spark
6 1 (0.080%) Confluence
Applications
1 22 (1.75%) Microsoft Office
2 9 (0.72%) AutoCAD
2 9 (0.72%) Autodesk Inventor
2 9 (0.72%) Fusion 360
3 7 (0.56%) Microsoft Excel
4 6 (0.48%) Microsoft PowerPoint
5 4 (0.32%) Microsoft Project
5 4 (0.32%) MS Visio
6 3 (0.24%) Revit
7 1 (0.080%) Spreadsheet
Business Applications
1 55 (4.38%) Dynamics CRM
2 23 (1.83%) Remedy ITSM
3 20 (1.59%) NEC Housing
4 16 (1.27%) SAP S/4HANA
5 5 (0.40%) Oracle General Ledger
5 5 (0.40%) Oracle Payables
5 5 (0.40%) Oracle Payroll
5 5 (0.40%) Oracle Receivables
6 4 (0.32%) Oracle Applications
6 4 (0.32%) Oracle Cash Management
6 4 (0.32%) Oracle EBS
6 4 (0.32%) Oracle ERP
6 4 (0.32%) PeopleSoft HCM
7 2 (0.16%) Dynamics NAV
7 2 (0.16%) NetSuite
7 2 (0.16%) SAP GRC
7 2 (0.16%) SAP IBP
8 1 (0.080%) Oracle SCM
8 1 (0.080%) SAP BPC
8 1 (0.080%) SAP SCM
Cloud Services
1 357 (28.40%) Azure
2 212 (16.87%) Microsoft 365
3 165 (13.13%) AWS
4 106 (8.43%) Dynamics 365
5 93 (7.40%) Power Platform
6 87 (6.92%) SaaS
7 75 (5.97%) Azure DevOps
8 70 (5.57%) GCP
9 44 (3.50%) Entra ID
10 29 (2.31%) PowerApps
11 26 (2.07%) Kontent
11 26 (2.07%) OCI
11 26 (2.07%) Power Automate
12 21 (1.67%) Azure Service Bus
13 20 (1.59%) Figma
14 19 (1.51%) Cloud Computing
15 17 (1.35%) Azure Cosmos DB
16 13 (1.03%) Azure Monitor
17 12 (0.95%) OneDrive
18 11 (0.88%) Snowflake
Communications & Networking
1 109 (8.67%) WAN
2 93 (7.40%) SD-WAN
3 78 (6.21%) Firewall
4 64 (5.09%) LAN
5 38 (3.02%) Cisco Firepower
6 33 (2.63%) Wireless
7 32 (2.55%) Wi-Fi
8 24 (1.91%) VLAN
9 21 (1.67%) VPN
10 19 (1.51%) TCP/IP
11 18 (1.43%) DNS
12 16 (1.27%) Network Security
13 15 (1.19%) BGP
13 15 (1.19%) Cisco ISE
13 15 (1.19%) WLAN
14 14 (1.11%) DHCP
15 12 (0.95%) MPLS
15 12 (0.95%) Unified Communications
16 10 (0.80%) SAN
17 9 (0.72%) Internet
Database & Business Intelligence
1 52 (4.14%) Data Warehouse
2 36 (2.86%) Power BI
3 30 (2.39%) Data Lake
4 28 (2.23%) Azure SQL Data Warehouse
5 25 (1.99%) SQL Server
6 19 (1.51%) SQL Server Analysis Services
7 9 (0.72%) Relational Database
8 5 (0.40%) Big Data
8 5 (0.40%) BusinessObjects
8 5 (0.40%) NoSQL
8 5 (0.40%) QlikView
9 4 (0.32%) Amazon Redshift
9 4 (0.32%) BigQuery
9 4 (0.32%) Data Mining
9 4 (0.32%) SQL Server Reporting Services
10 3 (0.24%) Metadata
10 3 (0.24%) MySQL
10 3 (0.24%) PostgreSQL
11 2 (0.16%) Azure SQL Database
12 1 (0.080%) SAP Data Services
Development Applications
1 28 (2.23%) JIRA
2 20 (1.59%) Visual Studio
3 18 (1.43%) Team Foundation Server
4 6 (0.48%) Git
5 4 (0.32%) Jenkins
General
1 356 (28.32%) Social Skills
2 190 (15.12%) Finance
3 171 (13.60%) Presentation Skills
4 96 (7.64%) Marketing
5 92 (7.32%) Billing
6 52 (4.14%) Public Sector
7 43 (3.42%) Analytical Skills
8 41 (3.26%) Inclusion and Diversity
9 38 (3.02%) Local Government
10 34 (2.70%) Retail
11 29 (2.31%) Telecoms
12 25 (1.99%) Organisational Skills
13 24 (1.91%) Law
13 24 (1.91%) Social Housing
14 20 (1.59%) Police
15 18 (1.43%) German Language
16 17 (1.35%) Documentation Skills
16 17 (1.35%) Legal
17 16 (1.27%) Manufacturing
18 14 (1.11%) Back Office
Job Titles
1 382 (30.39%) Architect
2 266 (21.16%) Consultant
3 212 (16.87%) Senior
4 148 (11.77%) Solutions Architect
5 87 (6.92%) Project Manager
6 79 (6.28%) Senior Architect
7 67 (5.33%) Technical Consultant
8 64 (5.09%) Cloud Architect
9 63 (5.01%) Presales Manager
10 55 (4.38%) Security Architect
10 55 (4.38%) Senior Consultant
11 54 (4.30%) Lead
11 54 (4.30%) Presales Consultant
12 51 (4.06%) Cisco Architect
12 51 (4.06%) Dynamics 365 Architect
12 51 (4.06%) Senior Cisco Architect
13 41 (3.26%) Presales Solution Architect
14 37 (2.94%) Solutions Consultant
15 36 (2.86%) Cisco Security Architect
15 36 (2.86%) Senior Security Architect
Libraries, Frameworks & Software Standards
1 67 (5.33%) .NET
2 42 (3.34%) .NET Core
3 34 (2.70%) React
4 30 (2.39%) RESTful
5 29 (2.31%) ASP.NET
6 28 (2.23%) Next.js
7 26 (2.07%) .NET Framework
7 26 (2.07%) ASP.NET MVC
8 12 (0.95%) CSS
9 9 (0.72%) HTML
10 8 (0.64%) REST
10 8 (0.64%) SOAP
10 8 (0.64%) Web Services
11 6 (0.48%) AngularJS
11 6 (0.48%) Node.js
11 6 (0.48%) Oracle Fusion
12 5 (0.40%) JSON
13 4 (0.32%) Apache Beam
13 4 (0.32%) Kafka
13 4 (0.32%) Node-RED
Miscellaneous
1 180 (14.32%) Data Centre
2 150 (11.93%) Self-Motivation
3 97 (7.72%) Public Cloud
4 93 (7.40%) Video Conferencing
5 91 (7.24%) Digital Signage
6 89 (7.08%) Video\Live Streaming
7 52 (4.14%) PKI
8 42 (3.34%) Hybrid Cloud
9 33 (2.63%) Private Cloud
10 27 (2.15%) Onboarding
11 26 (2.07%) Virtual Team
12 25 (1.99%) Driving Licence
12 25 (1.99%) Mobile App
13 24 (1.91%) IoT
14 23 (1.83%) FMCG
15 21 (1.67%) Cloud Native
16 16 (1.27%) Management Information System
17 14 (1.11%) Enterprise Software
18 12 (0.95%) Client/Server
19 10 (0.80%) Data Structures
Operating Systems
1 92 (7.32%) Windows
2 33 (2.63%) Windows 10
3 31 (2.47%) Linux
4 24 (1.91%) Windows Server
5 7 (0.56%) Unix
6 4 (0.32%) Windows Server 2008
6 4 (0.32%) Windows Server 2012
7 3 (0.24%) Windows 8
7 3 (0.24%) Windows Server 2003
7 3 (0.24%) Windows Server 2016
8 2 (0.16%) Windows Server 2019
9 1 (0.080%) Android
9 1 (0.080%) CentOS
9 1 (0.080%) Debian
9 1 (0.080%) Red Hat Enterprise Linux
9 1 (0.080%) SUSE
9 1 (0.080%) Ubuntu
9 1 (0.080%) Windows 7
Processes & Methodologies
1 211 (16.79%) Agile
2 206 (16.39%) Project Management
3 198 (15.75%) Cybersecurity
4 181 (14.40%) Project Delivery
5 179 (14.24%) Actionable Insight
6 144 (11.46%) Customer Service
7 143 (11.38%) Problem-Solving
8 136 (10.82%) Software Licensing
9 134 (10.66%) Roadmaps
10 123 (9.79%) Customer Requirements
11 114 (9.07%) DevOps
12 111 (8.83%) CRM
13 108 (8.59%) Time Management
14 107 (8.51%) Migration
15 103 (8.19%) Software Delivery
16 98 (7.80%) Logistics
17 93 (7.40%) TOGAF
18 89 (7.08%) Preventative Maintenance
19 84 (6.68%) Customer Engagement
20 82 (6.52%) SDLC
Programming Languages
1 84 (6.68%) C#
2 60 (4.77%) JavaScript
3 48 (3.82%) SQL
4 32 (2.55%) Python
5 22 (1.75%) PowerShell
6 15 (1.19%) Java
7 13 (1.03%) Bicep
8 12 (0.95%) Bash
9 7 (0.56%) C
10 6 (0.48%) C++
11 4 (0.32%) Kusto Query Language
12 3 (0.24%) R
13 2 (0.16%) TypeScript
14 1 (0.080%) Perl
14 1 (0.080%) X++
Qualifications
1 232 (18.46%) Degree
2 139 (11.06%) Security Cleared
3 87 (6.92%) SC Cleared
4 75 (5.97%) Cisco Certification
5 67 (5.33%) CCNP
6 65 (5.17%) CCNA
7 61 (4.85%) Microsoft Certification
8 50 (3.98%) Azure Certification
9 35 (2.78%) DBS Check
10 32 (2.55%) DV Cleared
11 30 (2.39%) AWS Certification
12 26 (2.07%) MCP
13 21 (1.67%) TOGAF Certification
14 19 (1.51%) Computer Science Degree
15 14 (1.11%) BPSS Clearance
16 10 (0.80%) CEH
16 10 (0.80%) CompTIA Security+
17 9 (0.72%) MCSE
18 8 (0.64%) CREST Certified
18 8 (0.64%) ITIL Certification
Quality Assurance & Compliance
1 103 (8.19%) SLA
2 37 (2.94%) Accessibility
3 21 (1.67%) COBIT
4 20 (1.59%) GDPR
5 17 (1.35%) PMO
6 16 (1.27%) ISO/IEC 27001
7 12 (0.95%) Cyber Essentials
8 11 (0.88%) QA
9 7 (0.56%) GRC
10 6 (0.48%) NIST
11 4 (0.32%) NCSC
11 4 (0.32%) PCI DSS
12 3 (0.24%) ISO 9001
13 2 (0.16%) GAMP
13 2 (0.16%) GMP
13 2 (0.16%) ISO/IEC 27002 (supersedes ISO/IEC 17799)
14 1 (0.080%) Cyber Essentials PLUS
14 1 (0.080%) Data Quality
14 1 (0.080%) Government Security Classifications
14 1 (0.080%) ISO/IEC 20000
System Software
1 86 (6.84%) Active Directory
2 38 (3.02%) Hyper-V
3 37 (2.94%) VMware Infrastructure
4 12 (0.95%) Virtual Desktop
5 6 (0.48%) NFS
6 3 (0.24%) Docker
6 3 (0.24%) Virtual Machines
7 2 (0.16%) vCloud
7 2 (0.16%) VMware ESXi
7 2 (0.16%) VMware NSX
7 2 (0.16%) vSphere
Systems Management
1 43 (3.42%) Microsoft Intune
2 36 (2.86%) Stealthwatch
3 21 (1.67%) OpenView
4 16 (1.27%) CASB
5 10 (0.80%) Terraform
6 5 (0.40%) Kubernetes
7 4 (0.32%) Grafana
7 4 (0.32%) SCCM
8 2 (0.16%) Active Directory Federation Services
8 2 (0.16%) Aspera SmartTrack
8 2 (0.16%) FortiGate
8 2 (0.16%) RSA Archer
8 2 (0.16%) Single Sign-On
8 2 (0.16%) SmoothWall
8 2 (0.16%) vCenter Server
9 1 (0.080%) HP UCMDB
9 1 (0.080%) MOM
9 1 (0.080%) PaperCut
9 1 (0.080%) QRadar
9 1 (0.080%) ZABBIX
Vendors
1 503 (40.02%) Microsoft
2 140 (11.14%) Adobe
3 139 (11.06%) Apple
4 112 (8.91%) Cisco
5 86 (6.84%) Meraki
6 68 (5.41%) Dell
7 59 (4.69%) HP
8 56 (4.46%) VMware
9 51 (4.06%) Google
10 50 (3.98%) Oracle
11 34 (2.70%) Aruba
12 32 (2.55%) Samsung
13 29 (2.31%) Fortinet
13 29 (2.31%) ServiceNow
14 27 (2.15%) SAP
15 26 (2.07%) Optimizely
15 26 (2.07%) Sitecore
16 25 (1.99%) BMC
17 23 (1.83%) Remedy
18 20 (1.59%) NEC