Business Continuity Jobs in England

Business Continuity
UK > England

The table below provides summary statistics for permanent job vacancies advertised in England requiring Business Continuity skills. It includes a benchmarking guide to the annual salaries offered in vacancies that cited Business Continuity over the 6 months leading up to 31 May 2025, comparing them to the same period in the previous two years.

6 months to
31 May 2025
Same period 2024 Same period 2023
Rank 395 355 419
Rank change year-on-year -40 +64 +10
Permanent jobs citing Business Continuity 312 645 627
As % of all permanent jobs advertised in England 0.63% 0.72% 0.74%
As % of the Processes & Methodologies category 0.67% 0.86% 0.77%
Number of salaries quoted 262 470 399
10th Percentile £39,750 £36,250 £32,000
25th Percentile £46,250 £45,000 £41,250
Median annual salary (50th Percentile) £60,000 £57,500 £55,000
Median % change year-on-year +4.35% +4.55% +4.76%
75th Percentile £75,000 £76,250 £73,125
90th Percentile £90,000 £85,000 £95,000
UK median annual salary £60,000 £55,540 £55,000
% change year-on-year +8.03% +0.98% +4.76%

All Process and Methodology Skills
England

Business Continuity falls under the Processes and Methodologies category. For comparison with the information above, the following table provides summary statistics for all permanent job vacancies requiring process or methodology skills in England.

Permanent vacancies with a requirement for process or methodology skills 46,342 75,409 81,364
As % of all permanent jobs advertised in England 93.97% 83.96% 95.53%
Number of salaries quoted 23,102 54,812 48,959
10th Percentile £29,250 £29,000 £34,452
25th Percentile £41,250 £40,000 £46,000
Median annual salary (50th Percentile) £57,500 £55,000 £62,500
Median % change year-on-year +4.55% -12.00% +4.17%
75th Percentile £75,000 £72,500 £82,500
90th Percentile £97,528 £93,750 £102,500
UK median annual salary £57,000 £55,000 £60,899
% change year-on-year +3.64% -9.69% +1.50%

Business Continuity
Job Vacancy Trend in England

Job postings citing Business Continuity as a proportion of all IT jobs advertised in England.
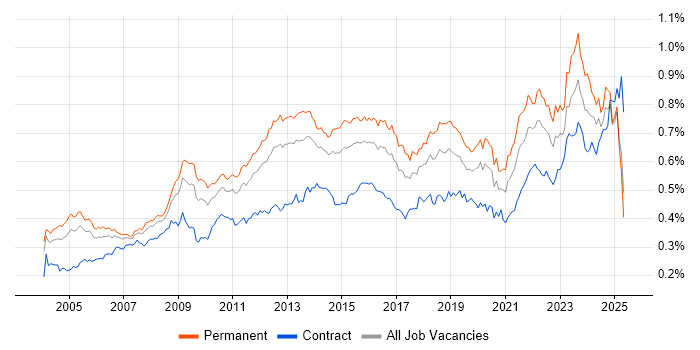
Job vacancy trend for Business Continuity in England

Business Continuity
Salary Trend in England

3-month moving average salary quoted in jobs citing Business Continuity in England.

Salary trend for Business Continuity in England

Business Continuity
Salary Histogram in England

Salary distribution for jobs citing Business Continuity in England over the 6 months to 31 May 2025.

Salary histogram for Business Continuity in England

Business Continuity
Job Locations in England

The table below looks at the demand and provides a guide to the median salaries quoted in IT jobs citing Business Continuity within the England region over the 6 months to 31 May 2025. The 'Rank Change' column provides an indication of the change in demand within each location based on the same 6 month period last year.

Location Rank Change
on Same Period
Last Year
Matching
Permanent
IT Job Ads
Median Salary
Past 6 Months
Median Salary
% Change
on Same Period
Last Year
Live
Jobs
London -23 113 £72,500 -3.33% 173
North of England +16 89 £52,500 +7.69% 50
South East +15 52 £56,250 +7.14% 38
North West -14 44 £47,683 -7.72% 30
Yorkshire +50 32 £53,375 +17.00% 14
South West +98 31 £46,250 -5.61% 22
Midlands +21 16 £55,000 -6.78% 35
North East +49 13 £57,500 +15.00% 6
West Midlands +24 10 £55,000 -21.43% 21
East of England +22 8 £52,500 -16.00% 13
East Midlands +30 5 £55,000 +37.50% 13
Business Continuity
UK

Business Continuity
Co-occurring Skills and Capabilities in England by Category

The follow tables expand on the table above by listing co-occurrences grouped by category. The same employment type, locality and period is covered with up to 20 co-occurrences shown in each of the following categories:

Application Platforms
1 27 (8.65%) Microsoft Exchange
2 26 (8.33%) SharePoint
3 6 (1.92%) Moodle
4 5 (1.60%) Exchange Server 2013
4 5 (1.60%) nginx
5 4 (1.28%) IIS
Applications
1 33 (10.58%) Microsoft Office
2 25 (8.01%) Simulink
3 3 (0.96%) MS Visio
4 2 (0.64%) Microsoft Excel
4 2 (0.64%) Microsoft PowerPoint
5 1 (0.32%) Spreadsheet
Business Applications
1 4 (1.28%) Fidessa
2 3 (0.96%) SAP S/4HANA
3 2 (0.64%) Oracle ERP
4 1 (0.32%) Dynamics CRM
4 1 (0.32%) Oracle EBS
4 1 (0.32%) Sage 200
Cloud Services
1 114 (36.54%) Azure
2 83 (26.60%) Microsoft 365
3 49 (15.71%) AWS
4 27 (8.65%) Entra ID
5 19 (6.09%) Power Platform
6 11 (3.53%) Power Automate
6 11 (3.53%) PowerApps
7 9 (2.88%) GCP
7 9 (2.88%) SaaS
8 7 (2.24%) Azure Logic Apps
8 7 (2.24%) Microsoft Purview
8 7 (2.24%) OneDrive
8 7 (2.24%) PaaS
9 6 (1.92%) Azure Sentinel
9 6 (1.92%) Google Workspace
10 5 (1.60%) Amazon CloudWatch
10 5 (1.60%) Cloud Computing
10 5 (1.60%) IaaS
10 5 (1.60%) OCI
11 4 (1.28%) Azure Monitor
Communications & Networking
1 76 (24.36%) Firewall
2 48 (15.38%) LAN
3 46 (14.74%) WAN
4 38 (12.18%) VPN
5 37 (11.86%) Network Security
6 29 (9.29%) VLAN
7 26 (8.33%) Intrusion Detection
8 25 (8.01%) DNS
9 22 (7.05%) SD-WAN
10 19 (6.09%) TCP/IP
11 16 (5.13%) Wireless
12 15 (4.81%) DHCP
13 14 (4.49%) SAN
13 14 (4.49%) SSL
14 10 (3.21%) BGP
14 10 (3.21%) MPLS
15 9 (2.88%) OSPF
16 8 (2.56%) IPsec
17 7 (2.24%) Wi-Fi
18 6 (1.92%) VoIP
Database & Business Intelligence
1 19 (6.09%) SQL Server
2 11 (3.53%) Power BI
3 6 (1.92%) Data Warehouse
4 4 (1.28%) Amazon RDS
4 4 (1.28%) DB2
4 4 (1.28%) Oracle Reports
5 3 (0.96%) MariaDB
6 2 (0.64%) Azure SQL Data Warehouse
6 2 (0.64%) Azure SQL Database
6 2 (0.64%) Data Lake
6 2 (0.64%) HDInsight
7 1 (0.32%) MySQL
7 1 (0.32%) Oracle Database
7 1 (0.32%) Oracle Exadata
Development Applications
1 6 (1.92%) JIRA
1 6 (1.92%) Rational DOORS
General
1 147 (47.12%) Social Skills
2 78 (25.00%) Finance
3 36 (11.54%) Analytical Skills
4 25 (8.01%) Aerospace
5 20 (6.41%) Law
6 19 (6.09%) Manufacturing
7 17 (5.45%) Banking
8 12 (3.85%) Inclusion and Diversity
9 10 (3.21%) Organisational Skills
10 9 (2.88%) Legal
10 9 (2.88%) Retail
11 7 (2.24%) Military
11 7 (2.24%) Pharmaceutical
11 7 (2.24%) Public Sector
11 7 (2.24%) Tech for Good
12 6 (1.92%) Electronics
12 6 (1.92%) Retail Banking
13 5 (1.60%) Advertising
13 5 (1.60%) Telecoms
14 3 (0.96%) Marketing
Job Titles
1 56 (17.95%) Senior
2 51 (16.35%) Lead
3 42 (13.46%) Infrastructure Engineer
4 35 (11.22%) Analyst
5 31 (9.94%) Senior Systems Engineer
5 31 (9.94%) Systems Engineer
6 27 (8.65%) Team Leader
7 25 (8.01%) Lead Systems Engineer
8 18 (5.77%) Security Engineer
9 17 (5.45%) IT Analyst
10 16 (5.13%) IT Engineer
10 16 (5.13%) Support Engineer
11 13 (4.17%) IT Manager
11 13 (4.17%) Network Engineer
12 11 (3.53%) Consultant
12 11 (3.53%) Infrastructure Manager
12 11 (3.53%) Security Analyst
13 10 (3.21%) IT Support
14 9 (2.88%) Administrator
14 9 (2.88%) Senior Infrastructure Engineer
Libraries, Frameworks & Software Standards
1 5 (1.60%) HTML
2 4 (1.28%) .NET
2 4 (1.28%) CSS
2 4 (1.28%) HTML5 Canvas
2 4 (1.28%) Oracle Fusion
3 3 (0.96%) 802.1X
3 3 (0.96%) Software Packaging
4 2 (0.64%) EDI
5 1 (0.32%) .NET Core
5 1 (0.32%) .NET Framework
5 1 (0.32%) ARM Templates
5 1 (0.32%) Middleware
5 1 (0.32%) ModSecurity
5 1 (0.32%) Oracle GoldenGate
5 1 (0.32%) YAML
Miscellaneous
1 31 (9.94%) Management Information System
2 15 (4.81%) Self-Motivation
3 14 (4.49%) Cyber Threat
3 14 (4.49%) Data Centre
4 13 (4.17%) Operational Technology
5 12 (3.85%) Security Posture
6 11 (3.53%) Data Protection Act
6 11 (3.53%) Driving Licence
6 11 (3.53%) Hybrid Cloud
7 9 (2.88%) Replication
8 8 (2.56%) Cloud Native
9 7 (2.24%) Enterprise Cloud
9 7 (2.24%) Learning Management System
10 6 (1.92%) Algorithms
10 6 (1.92%) CMDB
10 6 (1.92%) Cyberattack
10 6 (1.92%) Enterprise Software
10 6 (1.92%) Mainframe
10 6 (1.92%) PKI
11 5 (1.60%) Virtual Team
Operating Systems
1 63 (20.19%) Windows
2 38 (12.18%) Windows Server
3 17 (5.45%) Linux
4 8 (2.56%) Unix
5 4 (1.28%) Windows Server 2016
6 3 (0.96%) Windows Server 2012
6 3 (0.96%) Windows Server 2019
7 2 (0.64%) Windows 10
8 1 (0.32%) Debian
8 1 (0.32%) Mac OS
8 1 (0.32%) Ubuntu
8 1 (0.32%) VMS
8 1 (0.32%) Windows Server 2008
Processes & Methodologies
1 150 (48.08%) Disaster Recovery
2 67 (21.47%) Cybersecurity
3 62 (19.87%) Business Continuity Planning
4 61 (19.55%) Continuous Improvement
4 61 (19.55%) Problem-Solving
5 56 (17.95%) BCP
6 55 (17.63%) ITIL
7 51 (16.35%) Agile
8 49 (15.71%) Project Management
9 48 (15.38%) Infrastructure Engineering
10 46 (14.74%) Risk Management
11 45 (14.42%) Information Security
12 42 (13.46%) Coaching
13 40 (12.82%) Data Protection
13 40 (12.82%) Line Management
14 37 (11.86%) Migration
14 37 (11.86%) Technical Leadership
15 35 (11.22%) Change Management
16 34 (10.90%) Service Delivery
17 33 (10.58%) Customer Service
Programming Languages
1 38 (12.18%) PowerShell
2 27 (8.65%) SQL
3 9 (2.88%) Python
4 7 (2.24%) T-SQL
5 5 (1.60%) Bash
6 4 (1.28%) Java
6 4 (1.28%) JavaScript
7 3 (0.96%) R
8 2 (0.64%) C#
9 1 (0.32%) Bicep
9 1 (0.32%) PHP
9 1 (0.32%) PL/SQL
9 1 (0.32%) Shell Script
9 1 (0.32%) VBA
Qualifications
1 32 (10.26%) BPSS Clearance
2 23 (7.37%) Degree
3 17 (5.45%) Security Cleared
4 15 (4.81%) Microsoft Certification
5 12 (3.85%) Azure Certification
5 12 (3.85%) Cisco Certification
6 11 (3.53%) SC Cleared
7 10 (3.21%) CCNA
8 9 (2.88%) CISA
9 8 (2.56%) CISM
9 8 (2.56%) MCSA
10 7 (2.24%) CISSP
11 6 (1.92%) AWS Certification
11 6 (1.92%) CompTIA Security+
11 6 (1.92%) GIAC
12 5 (1.60%) CCNP
12 5 (1.60%) CompTIA CySA+
12 5 (1.60%) Oracle Certification
13 4 (1.28%) ITIL Certification
14 3 (0.96%) MCP
Quality Assurance & Compliance
1 56 (17.95%) ISO/IEC 27001
2 50 (16.03%) GDPR
3 32 (10.26%) Cyber Essentials
4 20 (6.41%) NIST
5 12 (3.85%) ISO/IEC 27002 (supersedes ISO/IEC 17799)
6 10 (3.21%) Cyber Essentials PLUS
7 8 (2.56%) PCI DSS
8 6 (1.92%) GRC
8 6 (1.92%) ISO 22301
8 6 (1.92%) ISO/IEC 15288
8 6 (1.92%) NCSC
8 6 (1.92%) SLA
9 4 (1.28%) Accessibility
9 4 (1.28%) Sarbanes-Oxley
10 2 (0.64%) ISO/IEC 27005
10 2 (0.64%) ITGC
10 2 (0.64%) PMO
10 2 (0.64%) QA
10 2 (0.64%) SOC 2
11 1 (0.32%) NIST 800
System Software
1 43 (13.78%) Active Directory
2 42 (13.46%) VMware Infrastructure
3 37 (11.86%) Hyper-V
4 14 (4.49%) Virtual Desktop
5 9 (2.88%) VMware ESXi
6 7 (2.24%) Virtual Machines
6 7 (2.24%) vSphere
7 2 (0.64%) Docker
7 2 (0.64%) Virtual Servers
7 2 (0.64%) VMware Workstation
8 1 (0.32%) NFS
8 1 (0.32%) XenApp
Systems Management
1 35 (11.22%) Microsoft Intune
2 13 (4.17%) Terraform
3 12 (3.85%) SCCM
3 12 (3.85%) Single Sign-On
4 7 (2.24%) Jamf Pro
5 5 (1.60%) Kubernetes
5 5 (1.60%) vCenter Server
6 4 (1.28%) FortiGate
7 3 (0.96%) Ansible
7 3 (0.96%) Iperf
8 2 (0.64%) Grafana
8 2 (0.64%) HAProxy
8 2 (0.64%) Istio
8 2 (0.64%) linkerd
8 2 (0.64%) Microsoft Clustering
8 2 (0.64%) Prometheus
8 2 (0.64%) SCOM
9 1 (0.32%) cPanel
9 1 (0.32%) Oracle RMAN
9 1 (0.32%) QRadar
Vendors
1 145 (46.47%) Microsoft
2 50 (16.03%) VMware
3 33 (10.58%) Cisco
4 25 (8.01%) MathWorks
5 18 (5.77%) Citrix
6 16 (5.13%) Google
7 13 (4.17%) Oracle
8 12 (3.85%) Fortinet
9 11 (3.53%) Veeam
10 9 (2.88%) Meraki
11 8 (2.56%) Palo Alto
11 8 (2.56%) ServiceNow
12 6 (1.92%) IBM
13 5 (1.60%) arcserve
13 5 (1.60%) CrowdStrike
13 5 (1.60%) Dell
13 5 (1.60%) F5
13 5 (1.60%) SonicWALL
14 4 (1.28%) Acronis
14 4 (1.28%) Refinitiv