Thought Leadership Jobs in London

Thought Leadership
England > London

The following table provides summary statistics for permanent job vacancies advertised in London with a requirement for Thought Leadership skills. Included is a benchmarking guide to the salaries offered in vacancies that have cited Thought Leadership over the 6 months to 4 May 2024 with a comparison to the same period in the previous 2 years.

6 months to
4 May 2024
Same period 2023 Same period 2022
Rank 189 206 177
Rank change year-on-year +17 -29 +77
Permanent jobs citing Thought Leadership 405 617 1,644
As % of all permanent jobs advertised in London 1.72% 1.75% 2.46%
As % of the Processes & Methodologies category 1.88% 1.84% 2.54%
Number of salaries quoted 260 273 600
10th Percentile £35,000 £64,200 £56,250
25th Percentile £54,538 £72,500 £73,750
Median annual salary (50th Percentile) £80,000 £85,000 £90,000
Median % change year-on-year -5.88% -5.56% +9.09%
75th Percentile £105,000 £105,000 £108,750
90th Percentile £135,250 £120,000 £120,000
England median annual salary £80,000 £85,000 £80,000
% change year-on-year -5.88% +6.25% +6.67%

All Process and Methodology Skills
London

Thought Leadership is in the Processes and Methodologies category. The following table is for comparison with the above and provides summary statistics for all permanent job vacancies advertised in London with a requirement for process or methodology skills.

Permanent vacancies with a requirement for process or methodology skills 21,515 33,562 64,646
As % of all permanent jobs advertised in London 91.30% 95.35% 96.86%
Number of salaries quoted 16,011 24,064 34,411
10th Percentile £38,000 £43,477 £42,500
25th Percentile £52,000 £55,000 £53,750
Median annual salary (50th Percentile) £70,000 £75,000 £70,000
Median % change year-on-year -6.67% +7.14% -
75th Percentile £95,000 £95,000 £92,500
90th Percentile £115,000 £115,000 £111,250
England median annual salary £55,000 £62,500 £60,000
% change year-on-year -12.00% +4.17% +9.09%

Thought Leadership
Job Vacancy Trend in London

Job postings citing Thought Leadership as a proportion of all IT jobs advertised in London.
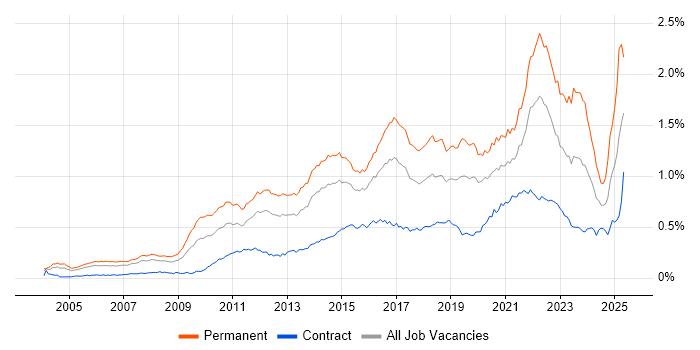
Job vacancy trend for Thought Leadership in London

Thought Leadership
Salary Trend in London

3-month moving average salary quoted in jobs citing Thought Leadership in London.

Salary trend for Thought Leadership in London

Thought Leadership
Salary Histogram in London

Salary distribution for jobs citing Thought Leadership in London over the 6 months to 4 May 2024.

Salary histogram for Thought Leadership in London

Thought Leadership
Job Locations in London

The table below looks at the demand and provides a guide to the median salaries quoted in IT jobs citing Thought Leadership within the London region over the 6 months to 4 May 2024. The 'Rank Change' column provides an indication of the change in demand within each location based on the same 6 month period last year.

Location Rank Change
on Same Period
Last Year
Matching
Permanent
IT Job Ads
Median Salary
Past 6 Months
Median Salary
% Change
on Same Period
Last Year
Live
Jobs
Central London +31 46 £130,000 +30.00% 17
South London +3 6 £100,000 +53.85% 1
East London +20 2 £120,000 - 4
Thought Leadership
England

Thought Leadership
Co-occurring Skills and Capabilities in London by Category

The follow tables expand on the table above by listing co-occurrences grouped by category. The same employment type, locality and period is covered with up to 20 co-occurrences shown in each of the following categories:

Application Platforms
1 12 (2.96%) Apache Spark
2 9 (2.22%) Confluence
3 6 (1.48%) CMS
4 5 (1.23%) Appian
5 4 (0.99%) Apache
5 4 (0.99%) Apache Airflow
6 3 (0.74%) Adobe Experience Manager
7 2 (0.49%) WordPress
8 1 (0.25%) Headless CMS
Applications
1 13 (3.21%) Adobe XD
1 13 (3.21%) Microsoft PowerPoint
2 9 (2.22%) Microsoft Excel
3 6 (1.48%) Microsoft Office
4 5 (1.23%) MS Visio
5 4 (0.99%) Microsoft Project
5 4 (0.99%) SPSS
6 1 (0.25%) Adobe Premiere
6 1 (0.25%) InDesign
6 1 (0.25%) Photoshop
Business Applications
1 15 (3.70%) Remedy ITSM
2 13 (3.21%) SAP SCM
3 12 (2.96%) SAP S/4HANA
4 8 (1.98%) Elite 3E
5 7 (1.73%) Dynamics CRM
6 5 (1.23%) SAP EWM
7 4 (0.99%) SAP CRM
7 4 (0.99%) SAP CX
7 4 (0.99%) SAP GTS
7 4 (0.99%) SAP SD
7 4 (0.99%) SAP Travel Management
7 4 (0.99%) SAP WM
8 1 (0.25%) NEC Housing
8 1 (0.25%) Oracle ERP
8 1 (0.25%) SAP IBP
8 1 (0.25%) SAP MDG
8 1 (0.25%) SAP MM
8 1 (0.25%) SAP PM
8 1 (0.25%) Sprinklr
Cloud Services
1 80 (19.75%) AWS
2 69 (17.04%) Azure
3 33 (8.15%) Azure DevOps
3 33 (8.15%) SaaS
4 32 (7.90%) dbt
5 18 (4.44%) Azure Cosmos DB
5 18 (4.44%) Azure Service Bus
6 16 (3.95%) Azure Monitor
7 14 (3.46%) Power Platform
8 13 (3.21%) IaaS
8 13 (3.21%) PaaS
9 10 (2.47%) GCP
9 10 (2.47%) Snowflake
10 9 (2.22%) AWS Lambda
10 9 (2.22%) Serverless
11 8 (1.98%) Datadog
11 8 (1.98%) Dynamics 365
12 7 (1.73%) Azure Data Factory
13 6 (1.48%) Azure Synapse Analytics
13 6 (1.48%) PowerApps
Communications & Networking
1 11 (2.72%) Firewall
2 8 (1.98%) VPN
3 7 (1.73%) SSL
4 6 (1.48%) Wireless
5 2 (0.49%) 5G
5 2 (0.49%) Broadband
5 2 (0.49%) Cisco IPT
6 1 (0.25%) DNS
6 1 (0.25%) LAN
6 1 (0.25%) Network Security
6 1 (0.25%) Radio Access Network
6 1 (0.25%) SAN
6 1 (0.25%) WAN
6 1 (0.25%) Wi-Fi
Database & Business Intelligence
1 27 (6.67%) SQL Server
2 16 (3.95%) Relational Database
2 16 (3.95%) SQL Server Analysis Services
3 13 (3.21%) Data Warehouse
4 11 (2.72%) Data Lake
4 11 (2.72%) Tableau
5 10 (2.47%) NoSQL
5 10 (2.47%) PostgreSQL
6 9 (2.22%) MySQL
7 8 (1.98%) Data Mining
8 7 (1.73%) Big Data
9 6 (1.48%) Amazon QuickSight
9 6 (1.48%) BigQuery
10 5 (1.23%) Power BI
11 4 (0.99%) Amazon Aurora
11 4 (0.99%) Azure SQL Database
11 4 (0.99%) Delta Lake
11 4 (0.99%) Parquet
11 4 (0.99%) RDBMS
12 3 (0.74%) Oracle Exadata
Development Applications
1 16 (3.95%) JIRA
2 13 (3.21%) Axure RP
2 13 (3.21%) Balsamiq
3 7 (1.73%) Git
3 7 (1.73%) Jenkins
4 4 (0.99%) JMeter
4 4 (0.99%) Selenium
4 4 (0.99%) Visual Studio
5 1 (0.25%) IBM UrbanCode
5 1 (0.25%) Oracle Forms
General
1 191 (47.16%) Social Skills
2 85 (20.99%) Finance
3 80 (19.75%) Marketing
4 63 (15.56%) Inclusion and Diversity
5 57 (14.07%) Public Sector
6 48 (11.85%) Local Government
7 46 (11.36%) Analytical Skills
8 44 (10.86%) Influencing Skills
9 31 (7.65%) Presentation Skills
10 29 (7.16%) Legal
11 27 (6.67%) Digital Economy
12 24 (5.93%) Back Office
13 18 (4.44%) Law
14 17 (4.20%) Retail
15 10 (2.47%) Banking
16 9 (2.22%) Billing
17 5 (1.23%) Brand Awareness
18 4 (0.99%) Advertising
18 4 (0.99%) Manufacturing
18 4 (0.99%) Telecoms
Job Titles
1 97 (23.95%) Architect
1 97 (23.95%) Senior
2 82 (20.25%) Lead
3 70 (17.28%) Consultant
4 60 (14.81%) Solutions Architect
5 30 (7.41%) Senior Consultant
6 29 (7.16%) SAP Consultant
7 18 (4.44%) Enterprise Architect
7 18 (4.44%) Senior SAP Consultant
8 15 (3.70%) Lead Architect
9 14 (3.46%) Lead Solutions Architect
9 14 (3.46%) Senior Architect
10 13 (3.21%) Senior Manager
10 13 (3.21%) User Experience Consultant
11 12 (2.96%) Presales Solution Architect
11 12 (2.96%) Senior Solutions Architect
12 10 (2.47%) Technical Architect
13 9 (2.22%) Infrastructure Manager
13 9 (2.22%) Principal Architect
13 9 (2.22%) SAP SCM Consultant
Libraries, Frameworks & Software Standards
1 29 (7.16%) HTML
2 26 (6.42%) .NET
3 21 (5.19%) CSS
3 21 (5.19%) Web Services
4 18 (4.44%) .NET Core
5 17 (4.20%) XML
6 15 (3.70%) SOAP
7 12 (2.96%) JSON
8 11 (2.72%) LDAP
9 9 (2.22%) RESTful
10 8 (1.98%) Kafka
10 8 (1.98%) React
10 8 (1.98%) REST
11 7 (1.73%) Ajax
11 7 (1.73%) PySpark
12 5 (1.23%) Apache Beam
12 5 (1.23%) Middleware
12 5 (1.23%) SAP TM
13 4 (0.99%) Playwright
13 4 (0.99%) Redux
Miscellaneous
1 47 (11.60%) Self-Motivation
2 35 (8.64%) Social Media
3 26 (6.42%) Product Ownership
4 19 (4.69%) Legacy Systems
5 12 (2.96%) Blog
5 12 (2.96%) Cloud Native
5 12 (2.96%) CMDB
5 12 (2.96%) Virtual Team
6 10 (2.47%) Algorithms
6 10 (2.47%) Data Centre
7 9 (2.22%) Management Information System
8 8 (1.98%) Data Structures
9 7 (1.73%) Onboarding
10 6 (1.48%) Client/Server
11 5 (1.23%) Distributed Systems
11 5 (1.23%) Public Cloud
11 5 (1.23%) Robotics
12 4 (0.99%) IoT
13 3 (0.74%) Cyber Defence
13 3 (0.74%) Cyberattack
Operating Systems
1 9 (2.22%) Linux
2 5 (1.23%) Windows
3 3 (0.74%) Windows Server
4 2 (0.49%) Unix
5 1 (0.25%) CoreOS
5 1 (0.25%) zOS
Processes & Methodologies
1 101 (24.94%) Agile
2 89 (21.98%) Project Delivery
3 81 (20.00%) Roadmaps
4 79 (19.51%) Mentoring
5 72 (17.78%) Problem-Solving
6 67 (16.54%) Presales
7 63 (15.56%) Project Management
8 62 (15.31%) DevOps
9 59 (14.57%) Continuous Improvement
10 54 (13.33%) Artificial Intelligence
11 51 (12.59%) Analytics
11 51 (12.59%) Business Development
12 48 (11.85%) Coaching
13 43 (10.62%) Stakeholder Engagement
14 41 (10.12%) Machine Learning
15 39 (9.63%) Business Strategy
15 39 (9.63%) Collaborative Working
16 38 (9.38%) Digital Transformation Programme
17 37 (9.14%) Actionable Insight
18 36 (8.89%) Stakeholder Management
Programming Languages
1 44 (10.86%) Python
2 36 (8.89%) SQL
3 35 (8.64%) JavaScript
4 25 (6.17%) C#
5 16 (3.95%) Bicep
6 13 (3.21%) Java
7 8 (1.98%) Perl
7 8 (1.98%) Scala
8 7 (1.73%) Go
9 6 (1.48%) TypeScript
10 5 (1.23%) R
11 4 (0.99%) C
12 2 (0.49%) Ada
12 2 (0.49%) VBA
13 1 (0.25%) Cypher
13 1 (0.25%) Gremlin
Qualifications
1 101 (24.94%) Degree
2 51 (12.59%) Security Cleared
3 32 (7.90%) SC Cleared
4 16 (3.95%) Master's Degree
5 15 (3.70%) Computer Science Degree
6 14 (3.46%) Microsoft Certification
7 13 (3.21%) CISSP
8 11 (2.72%) CISM
9 8 (1.98%) BPSS Clearance
10 6 (1.48%) CHECK Team Leader
10 6 (1.48%) CHECK Team Member
10 6 (1.48%) CREST Certified
10 6 (1.48%) Cyber Scheme
10 6 (1.48%) OSCP
10 6 (1.48%) PCI QSA
10 6 (1.48%) Tigerscheme
11 5 (1.23%) ITIL Certification
11 5 (1.23%) MBA
11 5 (1.23%) PhD
12 4 (0.99%) ISTQB
Quality Assurance & Compliance
1 18 (4.44%) Accessibility
2 13 (3.21%) WCAG
3 10 (2.47%) Data Quality
4 9 (2.22%) QA
5 8 (1.98%) GRC
5 8 (1.98%) NIST
5 8 (1.98%) PMO
6 7 (1.73%) Actionable Recommendations
7 6 (1.48%) PCI DSS
8 4 (0.99%) GDPR
9 2 (0.49%) Cyber Essentials
9 2 (0.49%) GAAP
9 2 (0.49%) IFRS
9 2 (0.49%) ISO/IEC 27001
10 1 (0.25%) COBIT
10 1 (0.25%) PMBOK
System Software
1 22 (5.43%) Active Directory
2 5 (1.23%) Docker
3 1 (0.25%) OpenAM
3 1 (0.25%) vCloud
3 1 (0.25%) VMware Infrastructure
3 1 (0.25%) vSphere
Systems Management
1 17 (4.20%) Functional Safety
2 8 (1.98%) Kubernetes
3 7 (1.73%) HP UCMDB
4 4 (0.99%) Active Directory Federation Services
4 4 (0.99%) Terraform
5 3 (0.74%) Oracle ZFS
6 2 (0.49%) WebSphere Cast Iron
7 1 (0.25%) Ansible
7 1 (0.25%) CA Endevor
7 1 (0.25%) Cisco Prime
7 1 (0.25%) Nagios
7 1 (0.25%) ZABBIX
Vendors
1 64 (15.80%) Microsoft
2 42 (10.37%) SAP
3 22 (5.43%) Oracle
4 19 (4.69%) ServiceNow
5 17 (4.20%) Adobe
6 15 (3.70%) BMC
6 15 (3.70%) HP
6 15 (3.70%) Remedy
7 13 (3.21%) Databricks
8 11 (2.72%) Google
9 5 (1.23%) Duck Creek
9 5 (1.23%) Facebook
9 5 (1.23%) Guidewire
9 5 (1.23%) Pega
9 5 (1.23%) YouTube
10 4 (0.99%) Dataiku
10 4 (0.99%) Twitter
11 3 (0.74%) Sparx
11 3 (0.74%) Teradata
12 2 (0.49%) Okta